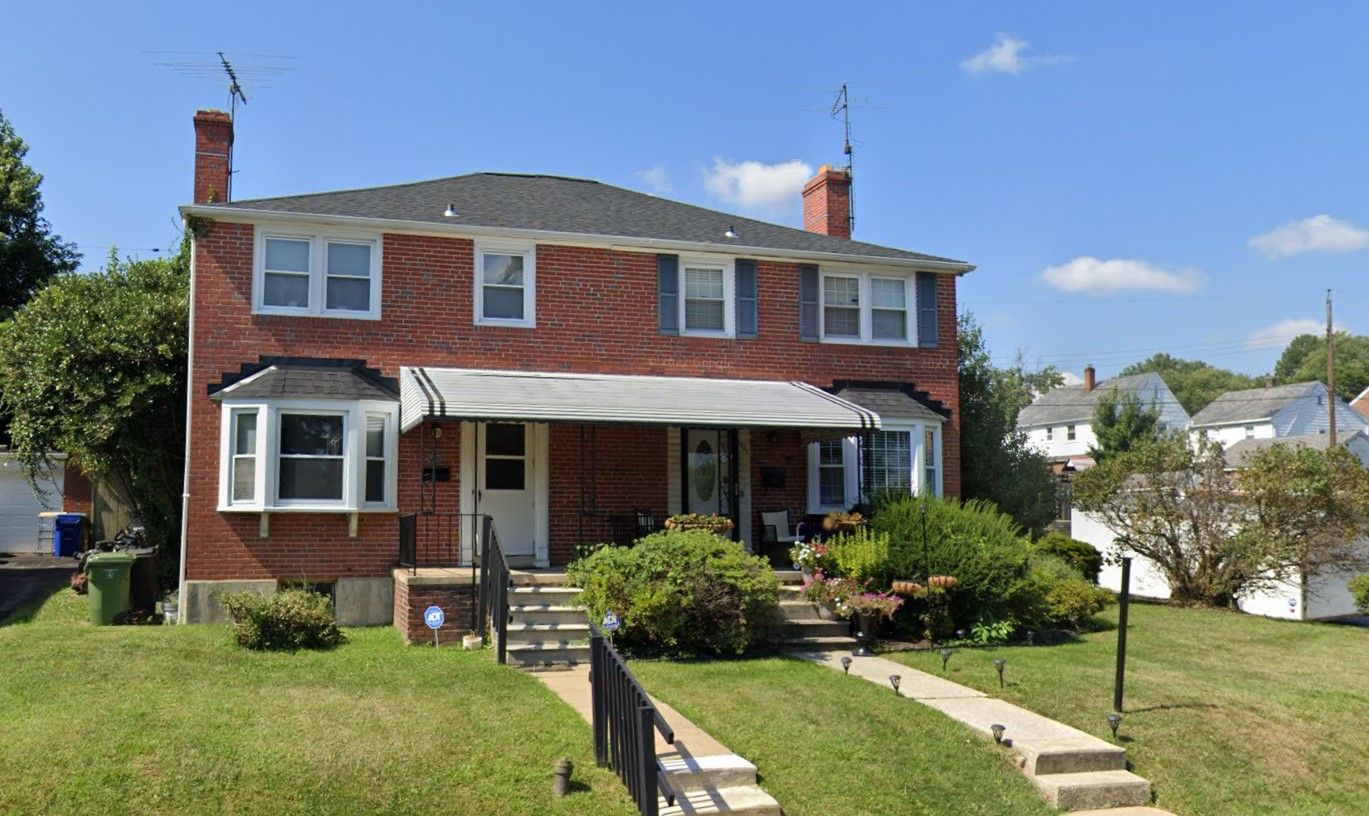
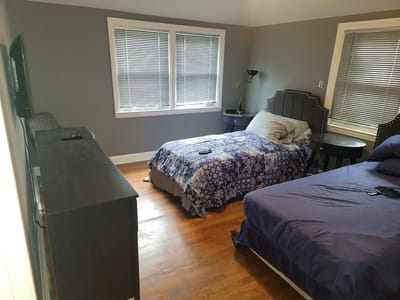
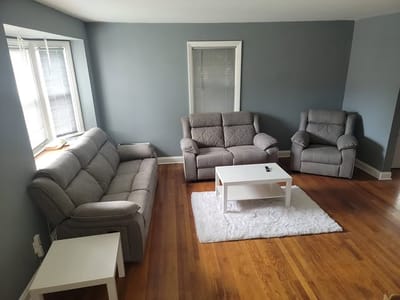
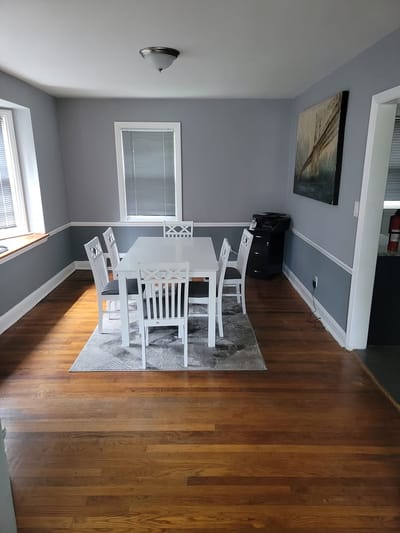
Smaller home · May offer a more intimate, personalized care environment.
First Family Living I
Peacefully nestled in the quiet residential area of Ailsa Avenue, Baltimore, MD, First Family Living I is an astounding community that offers assisted living. The community is dedicated to enhancing residents’ quality of life with top-tier care and assistance around the clock. With different levels of care, residents can rest assured of receiving the necessary care for their specific needs.
A full calendar of enjoyable activities and enriching programs are conducted for residents to easily adapt to their surroundings and live actively. Delight with healthy and nutritious meals that cater to their dietary needs and tastes. Spend your golden years without worries with the community’s top-tier care and specially designed amenities.
Community insights.
About This Community
Places of interest near First Family Living I
5.4 miles from city center
Estimated distance in miles from Baltimore's city center to First Family Living I's address, calculated via Google Maps.
Calculate Travel Distance to First Family Living I
Add your location
Compare Assisted Living around Baltimore
Info below is compiled from the MD Dept. of Health (OHCQ), senior community websites & trusted data sources such as Walk Score & BBB.
Communities are listed from highest-ranked to lowest-ranked based on our methodology.
Care Types in This Table
AL (Assisted Living):
Housing with help for daily activities like bathing, dressing, and medication, without 24-hour skilled nursing.
MC (Memory Care):
Secured, specialized care for people living with Alzheimer's or dementia.
RC (Respite Care):
Short-term temporary care that gives family caregivers a break.
IL (Independent Living):
Community living with dining, activities, and transportation for active seniors who need little personal care.
HOS (Hospice Care):
Comfort-focused care for those with a terminal illness, prioritizing quality of life over treatment.
PC (Palliative Care):
Comfort-focused care for serious illness at any stage, including alongside curative treatment.
|
City and state of the facility. Used for mapping and state-average comparisons.
|
Licensed bed capacity (maximum allowed). Not the same as how many beds are currently filled.
|
Indicates whether residents are allowed to have pets in the facility.
|
Third-party neighborhood walkability score (0–100). Convenience/context metric, not a healthcare quality measure.
|
Description of bed or unit types offered (e.g. assisted living, memory care), as reported in state or facility disclosures.
|
Number of years the company has been in operation.
|
Better Business Bureau grade for the operating company. Reflects complaint handling and business practices, not clinical care quality.
|
Percentage of residents reported as male in state demographics, shown as a whole-number percent.
|
Percentage of residents reported as female in state demographics, shown as a whole-number percent.
|
Share of residents reported as White in the state-published race/ethnicity breakdown for this facility, shown as a whole-number percent. Parsed from the same source as the profile demographics section.
|
Share of residents reported as African American or Black in the state breakdown, shown as a whole-number percent. Labels in the raw data are normalized to this bucket for compare.
|
Combined share of all race/ethnicity groups that are not classified as White or African American (e.g. Hispanic, Asian, multiracial, and other labeled categories), summed to a single whole-number percent.
|
Share of residents aged 65–74 in reported demographics, as a whole-number percentage of residents.
|
Share of residents aged 75–84 in reported demographics, as a whole-number percentage of residents.
|
Share of residents aged 85–94 in reported demographics, as a whole-number percentage of residents.
|
Share of residents aged 95 or older in reported demographics, as a whole-number percentage of residents.
| |
|---|---|---|---|---|---|---|---|---|---|---|---|---|---|---|---|---|---|
| Caritas House Assisted Living | AL HOS PC | Baltimore (Violetville) | 60
Facility
60
MD AVG
28
Rank
#110 / 577 | No |
50
Facility
50
MD AVG
43
Rank
#303 / 752 | Studio | 23
Facility
23
MD AVG
21
Rank
#93 / 186 | A |
31% Male Residents — State Benchmarked 31% of residents are male, compared to the Maryland average of 31%. This facility caters to a majority female resident pool (69% female), consistent with the broader assisted living trend where women significantly outnumber men. |
69% Female Residents — State Benchmarked 69% of residents are female, compared to the Maryland average of 69%. Women comprise the large majority, consistent with national assisted living demographics where women live longer and enter care facilities at higher rates. |
93% White Residents — State Benchmarked 93% of residents are reported as White, compared to the Maryland average of 81%. A higher White share than is typical for assisted living in Maryland in this dataset — compare with peer facilities for local context. |
5% African American Residents — State Benchmarked 5% of residents are reported as African American or Black, compared to the Maryland average of 13%. In line with the Maryland average for African American residents among facilities reporting this breakdown. |
2% Other Ethnicity Residents — State Benchmarked 2% of residents fall into categories other than White or African American (combined), compared to the Maryland average of 6%. This column aggregates Hispanic, Asian, multiracial, and any other labeled groups that are not classified as White or African American. Reported subgroups in this total: Hispanic (2%). |
12% Residents Age 65–74 — State Benchmarked 12% of residents are 65–74, compared to the Maryland average of 13%. In line with the statewide profile for this youngest senior bracket in assisted living. |
38% Residents Age 75–84 — State Benchmarked 38% of residents are 75–84, compared to the Maryland average of 31%. A high concentration in this mid-range bracket, where residents typically need moderate support with daily activities. |
41% Residents Age 85–94 — State Benchmarked 41% of residents are 85–94, compared to the Maryland average of 44%. This is typically the most common age bracket in assisted living — this facility is in line with the statewide norm. |
9% Residents Age 95+ — State Benchmarked 9% of residents are 95 or older, compared to the Maryland average of 16%. Most residents here have not yet reached the oldest-old bracket, suggesting a younger overall community. |
| Symphony Manor | AL MC RC | Baltimore (Roland Park) | 69
Facility
69
MD AVG
28
Rank
#102 / 577 | Yes |
71
Facility
71
MD AVG
43
Rank
#140 / 752 | Studio | 15
Facility
15
MD AVG
21
Rank
#121 / 186 | - |
21% Male Residents — State Benchmarked 21% of residents are male, compared to the Maryland average of 31%. This facility caters to a majority female resident pool (79% female), consistent with the broader assisted living trend where women significantly outnumber men. |
79% Female Residents — State Benchmarked 79% of residents are female, compared to the Maryland average of 69%. Women comprise the large majority, consistent with national assisted living demographics where women live longer and enter care facilities at higher rates. |
79% White Residents — State Benchmarked 79% of residents are reported as White, compared to the Maryland average of 81%. Close to the average for this category among assisted living facilities in Maryland with reported race/ethnicity data. |
19% African American Residents — State Benchmarked 19% of residents are reported as African American or Black, compared to the Maryland average of 13%. In line with the Maryland average for African American residents among facilities reporting this breakdown. |
1% Other Ethnicity Residents — State Benchmarked 1% of residents fall into categories other than White or African American (combined), compared to the Maryland average of 6%. This column aggregates Hispanic, Asian, multiracial, and any other labeled groups that are not classified as White or African American. Reported subgroups in this total: Asian (1%). |
15% Residents Age 65–74 — State Benchmarked 15% of residents are 65–74, compared to the Maryland average of 13%. In line with the statewide profile for this youngest senior bracket in assisted living. |
44% Residents Age 75–84 — State Benchmarked 44% of residents are 75–84, compared to the Maryland average of 31%. A high concentration in this mid-range bracket, where residents typically need moderate support with daily activities. |
18% Residents Age 85–94 — State Benchmarked 18% of residents are 85–94, compared to the Maryland average of 44%. The population here skews younger than the statewide norm, which may indicate a more active, lower-acuity community. |
24% Residents Age 95+ — State Benchmarked 24% of residents are 95 or older, compared to the Maryland average of 16%. A high proportion of the oldest-old suggests strong end-of-life care experience and very-high-acuity capabilities. |
| Springwell Senior Living Community | AL IL MC | Baltimore | 151
Facility
151
MD AVG
28
Rank
#14 / 577 | No |
30
Facility
30
MD AVG
43
Rank
#464 / 752 | Studio / 1 Bed / 2 Bed | - | A+ |
20% Male Residents — State Benchmarked 20% of residents are male, compared to the Maryland average of 31%. This facility caters to a majority female resident pool (80% female), consistent with the broader assisted living trend where women significantly outnumber men. |
80% Female Residents — State Benchmarked 80% of residents are female, compared to the Maryland average of 69%. Women comprise the large majority, consistent with national assisted living demographics where women live longer and enter care facilities at higher rates. |
91% White Residents — State Benchmarked 91% of residents are reported as White, compared to the Maryland average of 81%. A higher White share than is typical for assisted living in Maryland in this dataset — compare with peer facilities for local context. |
6% African American Residents — State Benchmarked 6% of residents are reported as African American or Black, compared to the Maryland average of 13%. In line with the Maryland average for African American residents among facilities reporting this breakdown. |
3% Other Ethnicity Residents — State Benchmarked 3% of residents fall into categories other than White or African American (combined), compared to the Maryland average of 6%. This column aggregates Hispanic, Asian, multiracial, and any other labeled groups that are not classified as White or African American. Reported subgroups in this total: Hispanic (2%), Asian (1%). |
8% Residents Age 65–74 — State Benchmarked 8% of residents are 65–74, compared to the Maryland average of 13%. Fewer younger seniors suggests the resident population skews older, likely requiring higher acuity care and more hands-on support. |
30% Residents Age 75–84 — State Benchmarked 30% of residents are 75–84, compared to the Maryland average of 31%. This is the second most common age bracket in assisted living, representing residents with moderate care needs. |
45% Residents Age 85–94 — State Benchmarked 45% of residents are 85–94, compared to the Maryland average of 44%. This is typically the most common age bracket in assisted living — this facility is in line with the statewide norm. |
15% Residents Age 95+ — State Benchmarked 15% of residents are 95 or older, compared to the Maryland average of 16%. In line with the statewide profile for the oldest resident bracket. |
| Phoenix Rising Assisted Living | AL | Baltimore (Rosemont East) | 15
Facility
15
MD AVG
28
Rank
#166 / 577 | No |
78
Facility
78
MD AVG
43
Rank
#83 / 752 | - | 16
Facility
16
MD AVG
21
Rank
#116 / 186 | A+ |
43% Male Residents — State Benchmarked 43% of residents are male, compared to the Maryland average of 31%. A relatively balanced gender mix for assisted living, where facilities typically skew heavily female. |
57% Female Residents — State Benchmarked 57% of residents are female, compared to the Maryland average of 69%. Closer to an even gender split than most assisted living facilities, which typically have 65–75% female residents. |
50% White Residents — State Benchmarked 50% of residents are reported as White, compared to the Maryland average of 81%. A lower White share than the Maryland average — the community may draw a more diverse resident mix relative to other facilities in Maryland. |
50% African American Residents — State Benchmarked 50% of residents are reported as African American or Black, compared to the Maryland average of 13%. A higher African American share than the typical Maryland average — useful context when comparing cultural fit and community composition. |
0% Other Ethnicity Residents — State Benchmarked 0% of residents fall into categories other than White or African American (combined), compared to the Maryland average of 6%. This column aggregates Hispanic, Asian, multiracial, and any other labeled groups that are not classified as White or African American. |
21% Residents Age 65–74 — State Benchmarked 21% of residents are 65–74, compared to the Maryland average of 13%. A higher share of younger seniors often signals a more independent, active resident community with lower acuity care needs. |
36% Residents Age 75–84 — State Benchmarked 36% of residents are 75–84, compared to the Maryland average of 31%. This is the second most common age bracket in assisted living, representing residents with moderate care needs. |
7% Residents Age 85–94 — State Benchmarked 7% of residents are 85–94, compared to the Maryland average of 44%. The population here skews younger than the statewide norm, which may indicate a more active, lower-acuity community. | - |
| First Family Living I | AL | Baltimore (Waltherson) | 4
Facility
4
MD AVG
28
Rank
#487 / 577 | No |
60
Facility
60
MD AVG
43
Rank
#236 / 752 | Private / Shared Rooms | - | - | - | - | - | - | - | - | - | - | - |
Rank badges are statewide and care-type specific: each assisted living community is ranked against every other MD assisted living community we track that reports that metric, not just the 5 on this page. See how we rank facilities
Programs that may help with care and living costs in Maryland
First Family Living I is in Baltimore, Maryland. These programs may support different care settings or living expenses. A listing does not confirm this community participates; our concierge team can help confirm.
Supporting Older Adults with Resources (SOAR)
Maryland SOAR
- Income limit
- Income below 60% of Maryland median income.
Eligibility
- General
- Maryland residents age 62 or older who need daily-living assistance and meet SOAR financial criteria; designed for people not qualifying for Medicaid or waiting for Medicaid-funded supports.
- MD specifics
- Senior Care, Senior Assisted Living Subsidy and Congregate Housing were consolidated into SOAR on July 1, 2026.
What it provides
- Case management; approved home/community supports and partial assistance with monthly assisted-living fees; funding and individual authorization apply.
Maryland Nursing Home Medicaid
Maryland Medical Assistance (Medicaid) Nursing Home Program
Eligibility
- General
- People who meet Maryland Medicaid nursing-facility medical and financial criteria; not limited solely to adults age 65 or older.
What it provides
- Authorized Medicaid nursing-facility care; resident contribution and covered services are subject to current rules.
Veterans Aid and Attendance (A&A) Benefit
VA Pension Aid and Attendance and Housebound Benefits (Federal)
- Who it is for
- Veterans or survivors with VA pension eligibility and an Aid and Attendance or Housebound medical need
- Income limit
- No single monthly income cutoff. VA compares countable annual income, after permitted deductions, with the applicable Maximum Annual Pension Rate for the household and benefit category.
- Asset limit
- Net-worth limit is $163,699 from December 1, 2025 through November 30, 2026. Net worth includes countable assets plus annual income; exclusions and transfer rules apply.
Eligibility
- General
- Veterans or eligible survivors who qualify for VA Pension or Survivors Pension and meet the additional Aid and Attendance or Housebound criteria. Service, discharge, family status and pension eligibility rules also apply.
- MD specifics
- A federal VA pension benefit; Aid and Attendance and Housebound enhancements cannot be received together.
What it provides
- A higher pension ceiling for eligible Aid and Attendance or Housebound recipients. Actual pension equals the applicable annual maximum minus countable income; the two enhancements cannot be paid together.
Increased Community Services (ICS)
Maryland Increased Community Services (ICS)
- Income limit
- Monthly income exceeds 300% of SSI; the excess is paid toward care under program rules.
- Asset limit
- Applicant countable assets no more than $2,500.
Eligibility
- General
- Adults 18 or older who need nursing-facility-level care, have lived in a nursing facility at least six months with Medicaid eligibility for at least 30 consecutive days, and are not eligible for an HCBS waiver or PACE. Community living must be safe and cost no more than institutional care.
- MD specifics
- Referral must come from Medicaid’s Eligibility Determination Division; there is no direct application.
What it provides
- Approved services may include assisted living; personal assistance; medical day care; respite; adaptations and supports planning.
Community Options Waiver
Maryland Medicaid Community Options Waiver
- Income limit
- Income up to 300% of the SSI benefit rate, subject to the applicable Medicaid category.
- Asset limit
- Countable assets up to $2,000 or $2,500, depending on eligibility category.
Eligibility
- General
- Age 18 or older, nursing-facility level of care, safely living at home/community, meeting Medicaid requirements and cost-effectiveness rules; cannot simultaneously join another waiver or PACE.
- MD specifics
- Community applicants join a registry and await invitation. A person whose nursing-facility services have been Medicaid-paid for at least 30 days may apply without that wait.
What it provides
- Medicaid benefits including Community First Choice plus authorized waiver services such as assisted living; behavioral consultation; case management; family training and medical day care.
Community Personal Assistance Services (CPAS)
Maryland Medicaid Community Personal Assistance Services
Eligibility
- General
- People of any age with full Medicaid, living in a community setting and needing help with at least one activity of daily living.
- MD specifics
- State-plan benefit with no age limit.
What it provides
- Personal assistance; nurse monitoring and supports planning; plus other covered Medicaid benefits.
Community First Choice (CFC)
Maryland Community First Choice (CFC)
Eligibility
- General
- People of any age with full Maryland Medicaid who need an institutional level of care and live in a community setting.
What it provides
- Authorized personal assistance; supports planning; nurse monitoring; accessibility adaptations; assistive technology; meals; emergency response systems and transition services.
Medical Day Care Services Waiver
Maryland Medical Day Care Services Waiver
Eligibility
- General
- People age 16 or older with full Medicaid, nursing-facility-level care needs and a medical order for day care. They may not be enrolled in another waiver and community services must cost no more than institutional care.
What it provides
- Authorized medical day care including nursing; medication monitoring; meals; activities; therapies; social work and transportation.
Senior Prescription Drug Assistance Program (SPDAP)
Maryland Senior Prescription Drug Assistance Program
- Income limit
- Income at or below 300% of the federal poverty level.
Eligibility
- General
- Maryland resident for at least six months, Medicare recipient and enrolled in a prescription-drug plan, meeting SPDAP income requirements.
- MD specifics
- Not restricted to age 65 and older.
What it provides
- Assistance with eligible Medicare prescription-plan premiums.
Medicare Savings Programs (MSP)
Maryland Medicare Savings Programs
- Who it is for
- Medicare beneficiaries with limited income who need help with premiums or cost sharing
Eligibility
- General
- Medicare beneficiaries meeting the applicable state Medicare Savings Program eligibility rules.
- MD specifics
- Applications are administered by the state Medicaid program.
What it provides
- Assistance with Medicare premiums and; for qualified QMB beneficiaries; Medicare-covered deductibles and coinsurance. The qualifying category determines which costs are paid.