


Sunny Side Manor Communities I
Sunny Side Manor Communities I
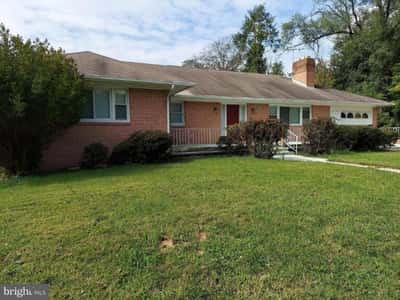
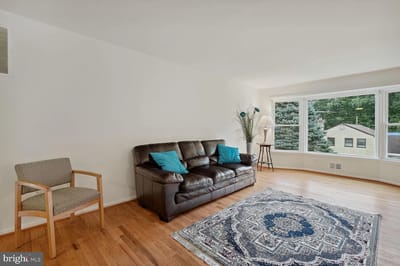
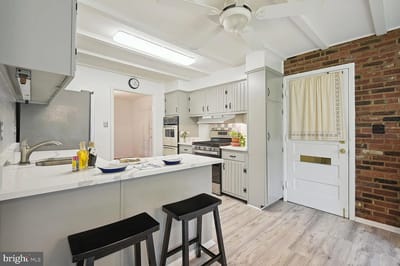
Based in Silver Spring, MD, Sunny Side Manor Communities I is a budget-friendly yet excellent senior living community, offering assisted living. The community is known for its warm and supportive environment with a range of living arrangements to cater to residents’ unique needs. Residents can freely choose the degree of care and assistance they’ll receive based on their individual needs and preferences–maintaining their independence and autonomy.
At Sunny Side Manor Communities I, residents enjoy a maintenance-free lifestyle with more time for the community’s fitness activities, social events, and planned day trips. Meals are prepared using fresh and organic ingredients with accommodations for special dietary needs. Conveniences like scheduled transportation and concierge services are also offered to make residents’ lives as comfortable as possible.
5-bed community Rank #430 / 690Bed count — State benchmarkedThis home is ranked 430th out of 690 homes in Maryland for Bed Count. Shows this facility's certified or reported bed count compared to other Maryland facilities. Larger communities may offer more amenities, programs, and on-site services for residents and families.Facilities with the same value for a metric share the same rank. Rankings are based only on facilities in Maryland that report data for that category. Facilities without available data are excluded from the ranking.Click the rank badge to see the full State ranking.Click here to see the full State ranking.
A smaller, more intimate setting that may offer a quieter environment and closer staff-resident interactions.
Walk Score: 24 / 100 Rank #693 / 985Walk Score — State benchmarkedThis home is ranked 693rd out of 985 homes in Maryland for Walk Score. Shows how walkable this facility's neighborhood is compared to the average Walk Score across Maryland facilities. Higher scores benefit residents, families, and staff.Facilities with the same value for a metric share the same rank. Rankings are based only on facilities in Maryland that report data for that category. Facilities without available data are excluded from the ranking.Click the rank badge to see the full State ranking.Click here to see the full State ranking.
Car-dependent. Most errands require a car, with limited nearby walkable options.
About this community
CountyMontgomery
No mild Alzheimer's level
No moderate Alzheimer's level
No severe Alzheimer's level
What does this home offer?
No pets allowed
Housing Options: Private / Semi-Private Rooms
Building Type: Single-story
Transportation Services
Fitness and Recreation
Places of interest near Sunny Side Manor Communities I
![]() 4.9 miles from city center
4.9 miles from city center
![]() Estimated distance in miles from Silver Spring's city center to Sunny Side Manor Communities I's address, calculated via Google Maps.
Estimated distance in miles from Silver Spring's city center to Sunny Side Manor Communities I's address, calculated via Google Maps.
Calculate Travel Distance to Sunny Side Manor Communities I
Add your location
Compare Assisted Living around Silver Spring
The information below is reported by the Maryland Department of Health, Office of Health Care Quality.
| Riderwood Village | AL IL MC | Silver Spring | 275
Facility
275
MD AVG
43
Rank
#3 / 690 | No |
33
Facility
33
MD AVG
43
Rank
#597 / 985 | - | 23
Facility
23
MD AVG
21
Rank
#101 / 210 |
29% Male Residents — State Benchmarked 29% of residents are male, compared to the Maryland average of 31%. This facility caters to a majority female resident pool (71% female), consistent with the broader assisted living trend where women significantly outnumber men. |
71% Female Residents — State Benchmarked 71% of residents are female, compared to the Maryland average of 69%. Women comprise the large majority, consistent with national assisted living demographics where women live longer and enter care facilities at higher rates. |
89% White Residents — State Benchmarked 89% of residents are reported as White, compared to the Maryland average of 81%. Close to the average for this category among assisted living facilities in Maryland with reported race/ethnicity data. |
7% African American Residents — State Benchmarked 7% of residents are reported as African American or Black, compared to the Maryland average of 13%. In line with the Maryland average for African American residents among facilities reporting this breakdown. |
4% Other Ethnicity Residents — State Benchmarked 4% of residents fall into categories other than White or African American (combined), compared to the Maryland average of 6%. This column aggregates Hispanic, Asian, multiracial, and any other labeled groups that are not classified as White or African American. Reported subgroups in this total: Asian (3%), Hispanic (0%). |
2% Residents Age 65–74 — State Benchmarked 2% of residents are 65–74, compared to the Maryland average of 13%. Fewer younger seniors suggests the resident population skews older, likely requiring higher acuity care and more hands-on support. |
23% Residents Age 75–84 — State Benchmarked 23% of residents are 75–84, compared to the Maryland average of 31%. Below the state norm — the resident mix may skew either younger or older than this typical middle bracket. |
52% Residents Age 85–94 — State Benchmarked 52% of residents are 85–94, compared to the Maryland average of 44%. A high concentration of very elderly residents signals a higher-acuity facility with experience caring for advanced age-related needs. |
23% Residents Age 95+ — State Benchmarked 23% of residents are 95 or older, compared to the Maryland average of 16%. A high proportion of the oldest-old suggests strong end-of-life care experience and very-high-acuity capabilities. |
| Brightview Crofton Riverwalk | AL IL MC | Crofton | 92
Facility
92
MD AVG
43
Rank
#151 / 690 | Yes |
45
Facility
45
MD AVG
43
Rank
#475 / 985 | Studio / 1 Bed / 2 Bed | 6
Facility
6
MD AVG
21
Rank
#178 / 210 |
27% Male Residents — State Benchmarked 27% of residents are male, compared to the Maryland average of 31%. This facility caters to a majority female resident pool (73% female), consistent with the broader assisted living trend where women significantly outnumber men. |
73% Female Residents — State Benchmarked 73% of residents are female, compared to the Maryland average of 69%. Women comprise the large majority, consistent with national assisted living demographics where women live longer and enter care facilities at higher rates. |
0% White Residents — State Benchmarked 0% of residents are reported as White, compared to the Maryland average of 81%. A lower White share than the Maryland average — the community may draw a more diverse resident mix relative to other facilities in Maryland. |
0% African American Residents — State Benchmarked 0% of residents are reported as African American or Black, compared to the Maryland average of 13%. A lower African American share than is typical in Maryland; local markets still vary widely. |
100% Other Ethnicity Residents — State Benchmarked 100% of residents fall into categories other than White or African American (combined), compared to the Maryland average of 6%. This column aggregates Hispanic, Asian, multiracial, and any other labeled groups that are not classified as White or African American. Reported subgroups in this total: Other (100%). | - | - | - | - |
| Bedford Court, a CCRC | AL HOS IL MC NH RC SNF | Silver Spring (International Drive) | 76
Facility
76
MD AVG
43
Rank
#179 / 690 | Yes |
64
Facility
64
MD AVG
43
Rank
#261 / 985 | Studio / 1 Bed | 34
Facility
34
MD AVG
21
Rank
#22 / 210 |
15% Male Residents — State Benchmarked 15% of residents are male, compared to the Maryland average of 31%. This facility caters to a majority female resident pool (85% female), consistent with the broader assisted living trend where women significantly outnumber men. |
85% Female Residents — State Benchmarked 85% of residents are female, compared to the Maryland average of 69%. Women comprise the large majority, consistent with national assisted living demographics where women live longer and enter care facilities at higher rates. |
95% White Residents — State Benchmarked 95% of residents are reported as White, compared to the Maryland average of 81%. A higher White share than is typical for assisted living in Maryland in this dataset — compare with peer facilities for local context. |
3% African American Residents — State Benchmarked 3% of residents are reported as African American or Black, compared to the Maryland average of 13%. A lower African American share than is typical in Maryland; local markets still vary widely. |
2% Other Ethnicity Residents — State Benchmarked 2% of residents fall into categories other than White or African American (combined), compared to the Maryland average of 6%. This column aggregates Hispanic, Asian, multiracial, and any other labeled groups that are not classified as White or African American. Reported subgroups in this total: Asian (2%). |
2% Residents Age 65–74 — State Benchmarked 2% of residents are 65–74, compared to the Maryland average of 13%. Fewer younger seniors suggests the resident population skews older, likely requiring higher acuity care and more hands-on support. |
8% Residents Age 75–84 — State Benchmarked 8% of residents are 75–84, compared to the Maryland average of 31%. Below the state norm — the resident mix may skew either younger or older than this typical middle bracket. |
65% Residents Age 85–94 — State Benchmarked 65% of residents are 85–94, compared to the Maryland average of 44%. A high concentration of very elderly residents signals a higher-acuity facility with experience caring for advanced age-related needs. |
26% Residents Age 95+ — State Benchmarked 26% of residents are 95 or older, compared to the Maryland average of 16%. A high proportion of the oldest-old suggests strong end-of-life care experience and very-high-acuity capabilities. |
| Bedford Court | AL HOS IL MC NH RC SNF | Silver Spring (International Drive) | 76
Facility
76
MD AVG
43
Rank
#179 / 690 | Yes |
66
Facility
66
MD AVG
43
Rank
#240 / 985 | Studio / 1 Bed / 2 Bed | 34
Facility
34
MD AVG
21
Rank
#22 / 210 |
15% Male Residents — State Benchmarked 15% of residents are male, compared to the Maryland average of 31%. This facility caters to a majority female resident pool (85% female), consistent with the broader assisted living trend where women significantly outnumber men. |
85% Female Residents — State Benchmarked 85% of residents are female, compared to the Maryland average of 69%. Women comprise the large majority, consistent with national assisted living demographics where women live longer and enter care facilities at higher rates. |
95% White Residents — State Benchmarked 95% of residents are reported as White, compared to the Maryland average of 81%. A higher White share than is typical for assisted living in Maryland in this dataset — compare with peer facilities for local context. |
3% African American Residents — State Benchmarked 3% of residents are reported as African American or Black, compared to the Maryland average of 13%. A lower African American share than is typical in Maryland; local markets still vary widely. |
2% Other Ethnicity Residents — State Benchmarked 2% of residents fall into categories other than White or African American (combined), compared to the Maryland average of 6%. This column aggregates Hispanic, Asian, multiracial, and any other labeled groups that are not classified as White or African American. Reported subgroups in this total: Asian (2%). |
2% Residents Age 65–74 — State Benchmarked 2% of residents are 65–74, compared to the Maryland average of 13%. Fewer younger seniors suggests the resident population skews older, likely requiring higher acuity care and more hands-on support. |
8% Residents Age 75–84 — State Benchmarked 8% of residents are 75–84, compared to the Maryland average of 31%. Below the state norm — the resident mix may skew either younger or older than this typical middle bracket. |
65% Residents Age 85–94 — State Benchmarked 65% of residents are 85–94, compared to the Maryland average of 44%. A high concentration of very elderly residents signals a higher-acuity facility with experience caring for advanced age-related needs. |
26% Residents Age 95+ — State Benchmarked 26% of residents are 95 or older, compared to the Maryland average of 16%. A high proportion of the oldest-old suggests strong end-of-life care experience and very-high-acuity capabilities. |
| Sunny Side Manor Communities I | AL | Silver Spring | 5
Facility
5
MD AVG
43
Rank
#430 / 690 | No |
24
Facility
24
MD AVG
43
Rank
#693 / 985 | Private / Semi-Private Rooms | - | - | - | - | - | - | - | - | - | - |
Financial Assistance for
Assisted Living in Maryland
Sunny Side Manor Communities I is located in Silver Spring, Maryland.
Here are the financial assistance programs available to residents in Maryland.
More homes from the same operator
Operated by
Sunny Side Manor Communities
Frequently Asked Questions about Sunny Side Manor Communities I
Is Sunny Side Manor Communities I in a walkable area?
Sunny Side Manor Communities I has a walk score of 24. Car-dependent. Most errands require a car, with limited nearby walkable options.
Are pets allowed at Sunny Side Manor Communities I?
No, Sunny Side Manor Communities I has a no-pet policy.
How many beds does Sunny Side Manor Communities I have?
Sunny Side Manor Communities I has 5 beds.
Are there photos of Sunny Side Manor Communities I?
Yes — there are 4 photos of Sunny Side Manor Communities I in the photo gallery on this page.
What is the address of Sunny Side Manor Communities I?
Sunny Side Manor Communities I is located at 12805 Bluet Ln, Silver Spring, MD 20906.
What is the phone number of Sunny Side Manor Communities I?
(301) 625-8655 will put you in contact with the team at Sunny Side Manor Communities I.
What county is Sunny Side Manor Communities I located in?
Sunny Side Manor Communities I is in Montgomery County.
Guides for Better Senior Living
Care Cost Calculator: See Prices in Your Area
Assisted Living Explorer
Don’t Wait Too Long: 7 Red Flag Signs Your Parent Needs Assisted Living Now
The True Cost of Assisted Living in 2025 – And How Families Are Paying For It
Understanding Senior Living Costs: Pricing Models, Discounts & Financial Assistance
Updated on
