


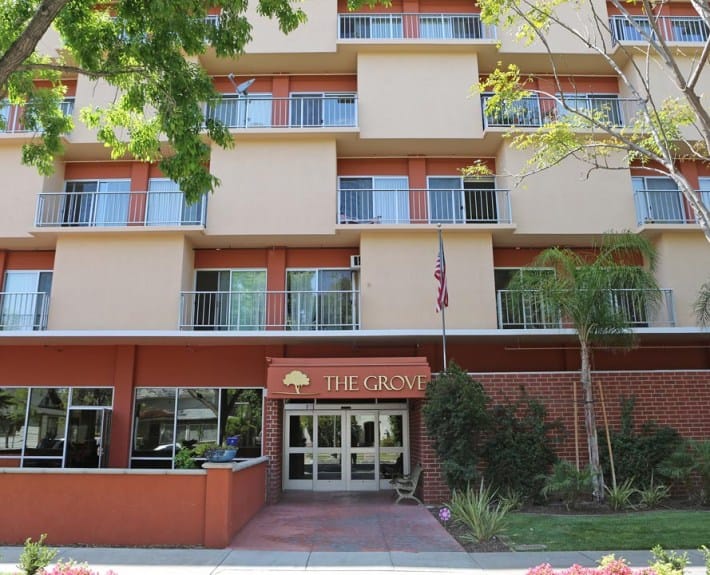
The Grove
Assisted Living & Independent Living · Columbia, MS

The Grove

Assisted Living & Independent Living · Columbia, MS
Calculator: See prices in your area
The Grove accepts Medicaid and Medicare.

Overview of The Grove

Michael Bradshaw owns and operates The Grove, an 86-bed nursing home located on Pecan Drive in Columbia, Mississippi. The business office works with several insurance and financial setups, accepting Medicare, Medicaid, and private pay options. For visitors, the surrounding neighborhood is moderately pedestrian-friendly, allowing family members to take care of a few simple errands on foot, though most trips through the area will require a vehicle.

Stays at this facility average roughly 318 days, which points to a daily workload that balances permanent residential care with short-term post-hospital therapy. To manage the clinical schedule, the 24-hour staffing model delivers an average of 5 hours and 5 minutes of total nursing care per resident each day. This time is distributed among registered nurses, licensed practical nurses, and nurse aides who handle daily medical checks and direct personal care.

State records track the property’s compliance history through regular licensing evaluations. Inspection files verify that the administration manages its clinical routines and building operations in line with statutory rules, managing tracking protocols effectively to keep the facility’s cumulative citations-per-inspection rate at zero.

Older adults have access to structured rehabilitation services, physical therapy loops, and spacious resident rooms. The campus features outdoor activity spaces and a restaurant-style dining area that provides daily meals planned around standard nutritional guidelines. The day-to-day schedule pairs these clinical programs and meal services with standard housekeeping chores, laundry assistance, and open visiting hours for family members.

Staffing hours breakdown

Info Daily nursing hours per resident by staff type, reported to CMS. Higher is generally better — compare this facility to state and national averages to see where staffing stands.

Hours per resident per day — compared to state averages

Staff typeHours / Day / Residentvs state avg
Registered Nurse (RN) Info RNs hold the highest nursing license and can assess residents, interpret test results, and direct care plans. More RN hours per day often signals stronger clinical oversight and faster response to health changes. 30m per day ▼ 21% State avg: 38m per day · National avg: 41m per day
LPN / LVN Info Licensed Practical Nurses (LPNs) or Licensed Vocational Nurses (LVNs) deliver routine hands-on care — medication administration, wound dressing, and monitoring vital signs. They work under RN supervision and make up a large share of daily bedside care. 1h 38m per day ▲ 48% State avg: 1h 6m per day · National avg: 52m per day
Nurse Aide Info Certified Nurse Aides (CNAs) provide the most direct day-to-day assistance: bathing, dressing, feeding, and mobility. Nurse aide hours are typically the largest staffing category and directly affect residents' quality of life. 2h 40m per day ▲ 7% State avg: 2h 29m per day · National avg: 2h 20m per day
Weekend Total Nursing Info Combined nursing hours (RN + LPN + Nurse Aide) per resident per day on weekends. Staffing often drops on weekends — this figure reveals whether the facility maintains adequate coverage outside of weekday hours. 4h 5m per day ▲ 16% State avg: 3h 31m per day · National avg: 3h 26m per day
Physical Therapist Info Hours per resident per day provided by licensed Physical Therapists (PTs) or PT Assistants. PT services help residents recover mobility after injury or illness and are especially important for post-acute (short-stay) rehabilitation. 3m per day ▲ 50% State avg: 2m per day · National avg: 4m per day
Weekend RN Info Registered nurse hours specifically on weekends. Facilities sometimes reduce RN presence on Saturdays and Sundays — a low weekend RN figure compared to weekday hours can indicate reduced clinical oversight when most administrative staff are absent. 16m per day ▼ 27% State avg: 22m per day · National avg: 28m per day
Bed community size
86-bed community
A larger shared setting that may offer more common spaces and organized community services.
Walk Score
Walk Score: 56 / 100
Moderately walkable. Some errands can be accomplished on foot, with a mix of nearby amenities.

About this community

License Details

Facility TypeHha
CountyMarion
CMS Certification Number255316

Ownership & Operating Entity

The Grove is administered by Michael Bradshaw.

Therapy & Rehabilitation

1 service
Rehabilitation Services

Staffing & Medical

2 services
Licensed Nurses/CNAs
24-Hour Staffing

Amenities & Lifestyle

Restaurant-Style Eatery
Lovely Outdoor Spaces
Spacious Rooms
Beautiful Artwork
Specific ProgramsAccommodations, At Your Service, Things To Do

Contact The Grove

Inspection History

In Mississippi, the State Department of Health, Bureau of Health Facilities Licensure conducts unannounced surveys to monitor facility compliance with health, safety, and resident rights laws.

Since 2019 · 7 years of data 14 deficiencies 3 inspections

Inspection Scorecard Info This scorecard compares key inspection, deficiency, and complaint metrics at this facility against the Mississippi state average. Metrics rated ≥15% worse than average are highlighted in red; those ≥15% better are highlighted in green.

Since 2019 vs. Mississippi state average
Overall vs. MS average 1 Worse Metrics worse than Mississippi average:
• Deficiencies per inspection (57% above)
2 Better Metrics better than Mississippi average:
• Total deficiencies (69% below)
• Deficiencies per year (69% below)
Latest Inspection August 29, 2024 Annual Inspection

Deficiencies Info Deficiencies are formal regulatory issues recorded during state inspections.

This FacilityMS Averagevs. MS Avg
Total deficiencies Info Formal regulatory issues recorded by inspectors across all inspection types. 1445 This facility has 69% fewer total deficiencies than a typical Mississippi assisted living residence (14 vs. MS avg 45).↓ 69% better
Deficiencies per year Info Average deficiencies per year since 2019. 26.4 This facility has 69% fewer deficiencies per year than a typical Mississippi assisted living residence (2 vs. MS avg 6.4).↓ 69% better
Deficiencies per inspection Info Average deficiencies per inspection. 4.73 This facility has 57% more deficiencies per inspection than a typical Mississippi assisted living residence (4.7 vs. MS avg 3).↑ 57% worse

Inspections Info State inspections evaluate whether the facility meets health and safety standards.

This FacilityMS Averagevs. MS Avg
Total inspections Info Combined count of all routine and focused inspections. Excludes complaint investigations. 315 This facility has had 80% fewer total inspections than the Mississippi average (3 vs. MS avg 15). More inspections can mean more regulatory scrutiny rather than worse care.↓ 80% fewer

Quality of care over time

These measures show how residents usually do over time at this home, based on health outcomes and preventive care.

Long-stay resident measures
Significantly below average State avg: 2.0 Info CMS star rating based on long-stay quality measure performance. 5 stars = significantly above average, 1 star = significantly below average.
Hospitalizations per 1,000 days Info Number of hospitalizations per 1,000 long-stay resident days. 2.21
9% better than State average

State average: 2.44

ED visits per 1,000 days Info Number of outpatient emergency department visits per 1,000 long-stay resident days. 3.53
23% worse than State average

State average: 2.88

Short-stay resident measures
Significantly below average State avg: 1.9 Info CMS star rating based on short-stay quality measure performance. 5 stars = much above average, 1 star = much below average.
Re-hospitalized after SNF stay Info Percentage of short-stay residents who were re-hospitalized after their nursing home admission. 29.4%
5% worse than State average

State average: 27.9%

Emergency department visits Info Percentage of short-stay residents who had an outpatient emergency department visit. 15.5%
In line with State average

State average: 15.3%

Falls with major injury Info Percentage of SNF residents who experience falls with major injury during their stay. 2.1%
174% worse than State average

State average: 0.8%

Ability to care for self at discharge Info Percentage of residents at or above expected ability to care for themselves at discharge. 72.4%
35% better than State average

State average: 53.7%

Successful return to home or community Info Rate of successful return to home or community from a skilled nursing facility. 43.1%
15% worse than State average

State average: 50.6%

Places of interest near The Grove

Address 0.0 miles from city center Info Estimated distance in miles from Columbia's city center to The Grove's address, calculated via Google Maps.

Calculate Travel Distance to The Grove

Add your location

Address

Compare Assisted Living around the area

The information below is reported by the Mississippi State Department of Health, Bureau of Health Facilities Licensure.

Traceway Retirement Community
AL
IL
MC
NH
SNF
Tupelo (West Main Street)140 Yes - 43 Private Rooms / Semi-Private Rooms
The Magnolia at Oxford Commons
AL
MC
RC
Oxford (Ed Perry Boulevard)115 Yes - 32 Studio / 1 Bed / 2 Bed
Landmark Lifestyles at Tupelo
AL
IL
MC
Tupelo112 Yes A 32 Studio / 1 Bed / 2 Bed
The Grove
AL
IL
Columbia86 No - 56 -
Indywood Personal Care Home
AL
Indianola29 No A+ 30 Studio

Frequently Asked Questions about The Grove

Is The Grove in a walkable area?

The Grove has a walk score of 56. Moderately walkable. Some errands can be accomplished on foot, with a mix of nearby amenities.

Who is the administrator of The Grove?

Michael Bradshaw is the administrator of The Grove.

How many beds does The Grove have?

The Grove has 86 beds.

Are there photos of The Grove?

Yes — there is 1 photo of The Grove in the photo gallery on this page.

What is the address of The Grove?

The Grove is located at 11 Pecan Drive, Columbia, MS 39429.

What is the phone number of The Grove?

(601) 736-4747 will put you in contact with the team at The Grove.

What county is The Grove located in?

The Grove is in Marion County.

Guides for Better Senior Living

Care Cost Calculator: See Prices in Your Area

Assisted Living Explorer

Don’t Wait Too Long: 7 Red Flag Signs Your Parent Needs Assisted Living Now

The True Cost of Assisted Living in 2025 – And How Families Are Paying For It

Understanding Senior Living Costs: Pricing Models, Discounts & Financial Assistance


