


Total staff
299
Employees
195
Contractors
104
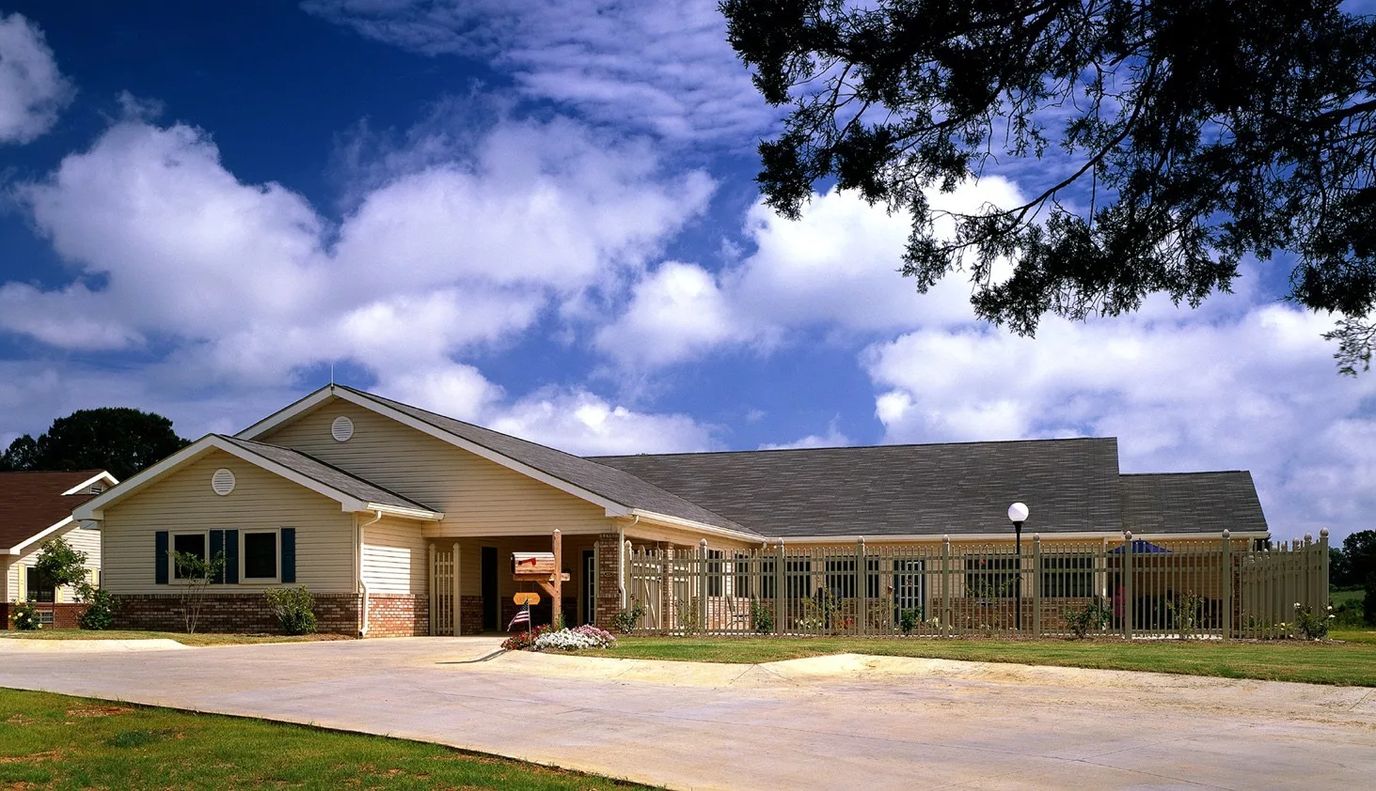
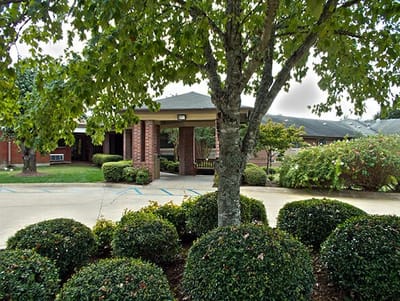
Owned by United Methodist Senior Services Health Care, Traceway Retirement Community is a Christian-grounded senior living community in Tupelo, Mississippi. The community offers a full continuum of care, including independent living, cottages, assisted living, memory care, skilled nursing, and traditional nursing home care. Residents can move between levels of care as their needs change without leaving the campus.
The single-story community has 140 beds with private and semi-private accommodations and an occupancy rate of about 91.9%. The average length of stay is 210 days, which is a mix of long-term nursing residents and shorter rehabilitation stays. Medicare, Medicaid, and private pay are accepted, giving families several ways to cover the cost of care.
Residents receive an average of about 5 hours and 51 minutes of total nursing care each day. Registered nurses provide about 38 minutes of that care, adding clinical oversight alongside the broader nursing team. The community also has a 24-hour emergency call system and immediate nursing assistance when needed.
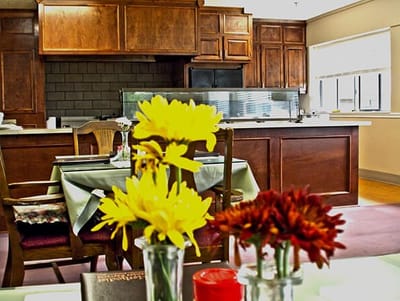
Residents can attend worship services and Bible classes that reflect the community’s Christian foundation. The community also has an on-site beauty shop. It offers scheduled outings, including trips to a nearby Walmart Supercenter. Residents can bring their pets, and fitness and recreation programmes are part of daily life. Utilities are included in the cost of living, helping simplify monthly budgeting. The area has a Walk Score of 43 out of 100, which is somewhat walkable. Some errands can be completed on foot, but most trips require a car or the community’s transportation service.
Families considering Traceway Retirement Community may want to ask which room or cottage options are currently available because availability can change with occupancy.
| Staff type | Hours / Day / Resident | vs state avg |
|---|---|---|
|
Registered Nurse (RN)
| 38m per day | ■ Avg State avg: 38m per day · National avg: 41m per day |
|
LPN / LVN
| 1h 10m per day | ▲ 4% State avg: 1h 7m per day · National avg: 52m per day |
|
Nurse Aide
| 3h 24m per day | ▲ 38% State avg: 2h 27m per day · National avg: 2h 20m per day |
|
Weekend Total Nursing
| 4h 34m per day | ▲ 28% State avg: 3h 34m per day · National avg: 3h 27m per day |
|
Physical Therapist
| 2m per day | ▼ 34% State avg: 3m per day · National avg: 4m per day |
|
Weekend RN
| 13m per day | ▼ 40% State avg: 22m per day · National avg: 29m per day |
Reporting period: October 1 – December 31, 2025 (Q4 2025). Source: CMS Payroll-Based Journal report.
Manages medical care and health needs.
Assists with medical care and medications.
Helps with daily care and mobility.
Total hours from contractors
10,329 contractor hours this quarter
| Certified Nursing Assistant | 127 | 57 | 184 | 40,156 | 92 | 100% | 6.1 |
| Licensed Practical Nurse | 33 | 22 | 55 | 13,248 | 92 | 100% | 9.5 |
| Registered Nurse | 15 | 1 | 16 | 5,108 | 92 | 100% | 8.5 |
| Other Dietary Services Staff | 5 | 0 | 5 | 1,548 | 67 | 73% | 7.9 |
| Speech Language Pathologist | 0 | 4 | 4 | 1,478 | 69 | 75% | 7.1 |
| Clinical Nurse Specialist | 3 | 0 | 3 | 1,306 | 76 | 83% | 7.5 |
| Nurse Practitioner | 2 | 0 | 2 | 1,032 | 65 | 71% | 8.3 |
| Physical Therapy Aide | 0 | 5 | 5 | 992 | 66 | 72% | 6.7 |
| Occupational Therapy Aide | 2 | 0 | 2 | 974 | 63 | 68% | 8.4 |
| Administrator | 2 | 0 | 2 | 961 | 65 | 71% | 7.9 |
| Mental Health Service Worker | 2 | 0 | 2 | 896 | 63 | 68% | 7.5 |
| Physical Therapy Assistant | 0 | 5 | 5 | 640 | 67 | 73% | 6.1 |
| Qualified Social Worker | 0 | 5 | 5 | 616 | 69 | 75% | 5.1 |
| RN Director of Nursing | 1 | 0 | 1 | 483 | 55 | 60% | 8.8 |
| Dietitian | 1 | 0 | 1 | 441 | 57 | 62% | 7.7 |
| Respiratory Therapy Technician | 0 | 5 | 5 | 343 | 67 | 73% | 4.2 |
| Medical Director | 1 | 0 | 1 | 116 | 15 | 16% | 7.7 |
| Occupational Therapy Assistant | 1 | 0 | 1 | 64 | 8 | 9% | 8 |
Federal penalties imposed by CMS for regulatory violations, including civil money penalties (fines) and denials of payment for new Medicare/Medicaid admissions.
Source: CMS Penalties Database
No penalties in the past 3 years
No civil money penalties or payment denials were reported in the last 3 years.
These measures show how residents usually do over time at this home, based on health outcomes and preventive care.
Mississippi average: 12.4
Mississippi average: 22.3
Mississippi average: 21.2%
Mississippi average: 24.5%
Mississippi average: 21.4%
Mississippi average: 3.2%
Mississippi average: 7.1%
Mississippi average: 2.6%
Mississippi average: 6.2%
Mississippi average: 1.5%
Mississippi average: 21.2%
Mississippi average: 95.9%
Mississippi average: 97.0%
Mississippi average: 87.9%
Mississippi average: 2.5%
Mississippi average: 84.6%
Quality measures are calculated from Minimum Data Set (MDS) assessments. For most measures, lower percentages indicate better care quality.
Source: CMS Long-Term Care Facility Characteristics (Data as of Jan 2026)
Residents meet regularly to discuss policies, care quality, and activities
State-approved Nurse Aide Training and Competency Evaluation Program on-site
Part of a Continuing Care Retirement Community offering multiple care levels
Organized group of residents that meets regularly to discuss facility policies, quality of life, and activities.
Data sourced from CMS Long-Term Care Facility Characteristics quarterly report. Payer mix reflects the current resident census by primary payment source.
Historical financial and operational data for Traceway Retirement Community from 2011–2023, based on CMS SNF Cost Reports.
Key figures below are for fiscal year ending in 12/2023.
Based on CMS SNF Cost Report for fiscal year ending in 12/2023.
Pets Allowed
Housing Options: Private Rooms / Semi-Private Rooms
Building Type: Single-story
Transportation Services
Fitness and Recreation
![]() 3.0 miles from city center
3.0 miles from city center
![]() Estimated distance in miles from Tupelo's city center to Traceway Retirement Community's address, calculated via Google Maps.
Estimated distance in miles from Tupelo's city center to Traceway Retirement Community's address, calculated via Google Maps.
Add your location
Info below is compiled from CMS reports & the MS State Dept. of Health (MSDH), senior community websites & trusted data sources such as Walk Score & BBB.
Communities are listed from highest to lowest based on our ranking methodology.
| North Pointe Health Rehabilitation Services | NH MC | Meridian | 60
Facility
60
MS AVG
70
Rank
#121 / 265 |
90.0%
Facility
90.0%
MS AVG
84.4
Rank
#44 / 107 | +7% | 6.35
Facility
6.35
MS AVG
4.63
Rank
#4 / 113 | +6% | +37% | $0
Facility
$0
MS AVG
$40.1k
Rank
#1 / 117 | 8
Facility
8
MS AVG
16.9
Rank
#9 / 113 | 2.7
Facility
2.7
MS AVG
3.8
Rank
#17 / 113 | - | 54 | - |
13
Facility
13
MS AVG
33
Rank
#234 / 319 | - | $7.6MFiscal year ending 12/2023
Facility
$7.6MFiscal year ending 12/2023
MS AVG
$9.6M
Rank
#50 / 111 | $3.3MFiscal year ending 12/2023
Facility
$3.3MFiscal year ending 12/2023
MS AVG
$3.5M
Rank
#61 / 111 | 43.3%Fiscal year ending 12/2023
Facility
43.3%Fiscal year ending 12/2023
MS AVG
37.9%
Rank
#79 / 111 | 255340 | ||||
| Sunshine Health Care | NH SNF | North Pontotoc | 60
Facility
60
MS AVG
70
Rank
#121 / 265 |
90.3%
Facility
90.3%
MS AVG
84.4
Rank
#41 / 107 | +7% | 7.56
Facility
7.56
MS AVG
4.63
Rank
#2 / 113 | -9% | +63% | $0
Facility
$0
MS AVG
$40.1k
Rank
#1 / 117 | 3
Facility
3
MS AVG
16.9
Rank
#2 / 113 | 1.0
Facility
1.0
MS AVG
3.8
Rank
#1 / 113 | - | 54 | - |
46
Facility
46
MS AVG
33
Rank
#106 / 319 | Sunshine Health Care, Inc | $7.0MFiscal year ending 12/2023
Facility
$7.0MFiscal year ending 12/2023
MS AVG
$9.6M
Rank
#84 / 111 | $4.2MFiscal year ending 12/2023
Facility
$4.2MFiscal year ending 12/2023
MS AVG
$3.5M
Rank
#57 / 111 | 60.5%Fiscal year ending 12/2023
Facility
60.5%Fiscal year ending 12/2023
MS AVG
37.9%
Rank
#23 / 111 | 255319 | ||||
| Vicksburg Convalescent Center | NH SNF | Vicksburg | 100
Facility
100
MS AVG
70
Rank
#67 / 265 |
78.0%
Facility
78.0%
MS AVG
84.4
Rank
#87 / 107 | -8% | 3.46
Facility
3.46
MS AVG
4.63
Rank
#101 / 113 | -20% | -25% | $0
Facility
$0
MS AVG
$40.1k
Rank
#1 / 117 | 5
Facility
5
MS AVG
16.9
Rank
#4 / 113 | 2.5
Facility
2.5
MS AVG
3.8
Rank
#15 / 113 | - | 78 | - |
74
Facility
74
MS AVG
33
Rank
#5 / 319 | Vicksburg Management Associates, LLC | $8.8MFiscal year ending 12/2023
Facility
$8.8MFiscal year ending 12/2023
MS AVG
$9.6M
Rank
#40 / 111 | $5.0MFiscal year ending 12/2023
Facility
$5.0MFiscal year ending 12/2023
MS AVG
$3.5M
Rank
#22 / 111 | 57.2%Fiscal year ending 12/2023
Facility
57.2%Fiscal year ending 12/2023
MS AVG
37.9%
Rank
#38 / 111 | 255253 | ||||
| Union County Health and Rehabilitation Center | NH HOS PC SNF | New Albany | 60
Facility
60
MS AVG
70
Rank
#121 / 265 |
83.8%
Facility
83.8%
MS AVG
84.4
Rank
#71 / 107 | -1% | 5.96
Facility
5.96
MS AVG
4.63
Rank
#6 / 113 | -28% | +29% | $0
Facility
$0
MS AVG
$40.1k
Rank
#1 / 117 | 9
Facility
9
MS AVG
16.9
Rank
#12 / 113 | 2.3
Facility
2.3
MS AVG
3.8
Rank
#6 / 113 | - | 50 | - |
60
Facility
60
MS AVG
33
Rank
#37 / 319 | Joseph Speetjens | $6.0MFiscal year ending 12/2023
Facility
$6.0MFiscal year ending 12/2023
MS AVG
$9.6M
Rank
#67 / 111 | $3.4MFiscal year ending 12/2023
Facility
$3.4MFiscal year ending 12/2023
MS AVG
$3.5M
Rank
#81 / 111 | 56.4%Fiscal year ending 12/2023
Facility
56.4%Fiscal year ending 12/2023
MS AVG
37.9%
Rank
#59 / 111 | 255312 | ||||
| Traceway Retirement Community | NH AL IL MC SNF | Tupelo (West Main Street) | 140
Facility
140
MS AVG
70
Rank
#14 / 265 |
91.9%
Facility
91.9%
MS AVG
84.4
Rank
#30 / 107 | +9% | 5.85
Facility
5.85
MS AVG
4.63
Rank
#8 / 113 | -43% | +26% | $24.9k
Facility
$24.9k
MS AVG
$40.1k
Rank
#90 / 117 | 17
Facility
17
MS AVG
16.9
Rank
#58 / 113 | 2.8
Facility
2.8
MS AVG
3.8
Rank
#18 / 113 | 1 | 129 | - |
43
Facility
43
MS AVG
33
Rank
#122 / 319 | United Methodist Senior Services Health Care, Inc | $16.3MFiscal year ending 12/2023
Facility
$16.3MFiscal year ending 12/2023
MS AVG
$9.6M
Rank
#1 / 111 | $8.9MFiscal year ending 12/2023
Facility
$8.9MFiscal year ending 12/2023
MS AVG
$3.5M
Rank
#2 / 111 | 54.6%Fiscal year ending 12/2023
Facility
54.6%Fiscal year ending 12/2023
MS AVG
37.9%
Rank
#35 / 111 | 255309 |
Traceway Retirement Community is in the West Main Street neighborhood.
Traceway Retirement Community has a walk score of 43. Somewhat walkable. A few nearby services may be reachable on foot, but most trips require transportation.
Traceway Retirement Community's occupancy is 92.1%.
Yes, Traceway Retirement Community allows residents to bring their pets.
Traceway Retirement Community is registered as a non-profit.
Yes — there are 3 photos of Traceway Retirement Community in the photo gallery on this page.
Traceway Retirement Community is located at 2800 W Main St, Tupelo, MS 38801.
Care Cost Calculator: See Prices in Your Area
Nursing Home Data Explorer
Don’t Wait Too Long: 7 Red Flag Signs Your Parent Needs Assisted Living Now
The True Cost of Assisted Living in 2025 – And How Families Are Paying For It
Understanding Senior Living Costs: Pricing Models, Discounts & Financial Assistance


