Best Nursing Homes in Kansas City, KS

Why trust this guide? Our editorial team analyzed 3 nursing homes in Kansas City, KS using CMS data, inspection records, complaints, amenities, and facility-level details. How we rank nursing homes in KS
Reviewed by
Last updated
We analyzed These are the facilities in Kansas City, KS our team has analyzed — not a count of every nursing home provider in Kansas City, KS.
3 homes
Other senior care options in Kansas City:
Avg Overall CMS Rating: 2.0/ 5The average Overall CMS Rating for all CMS-certified nursing homes in Kansas City, KS. Ratings combine health inspections, staffing, and quality measures, with inspections weighted most. Individual facilities can vary widely from this average.
National Average: 3.2/ 5
Avg Staffing Rating: 2.0/ 5The average Staffing Rating across all CMS-certified nursing homes in Kansas City, KS. Reflects nursing staff hours per resident per day (including RNs), adjusted for residents' care needs. Individual facilities can vary widely from this average.
National Average: 3.4/ 5
Avg Health Insp. Rating: 1.5/ 5The average Health Inspection Rating across all CMS-certified nursing homes in Kansas City, KS. Based on each facility's recent inspections and complaint investigations, weighing the number, scope, and severity of deficiencies. Individual facilities can vary widely from this average.
National Average: 3.0/ 5

Compare Nursing Homes around Kansas City (Metro Area)

Info below is compiled from CMS reports & the KS Dept. for Aging & Disability Services (KDADS), senior community websites & trusted data sources such as Walk Score & BBB.

Communities are listed from highest to lowest based on our ranking methodology.

The facility name. Click to view the full profile page on Assisted Living Magazine, including photos, services, and contact info.
CMS (Centers for Medicare & Medicaid Services, the federal agency that regulates nursing homes) Overall 5-star rating — a composite of Health Inspection, Staffing, and Quality Measures scores. 5 stars = top 10% nationally. 1 star = bottom 10%. The single most important number to start with when comparing facilities.
Care Types in This Table AL (Assisted Living): Housing with help for daily activities like bathing, dressing, and medication, without 24-hour skilled nursing. NH (Nursing Home): 24/7 skilled nursing care for residents with complex, ongoing medical needs. SNF (Skilled Nursing Facility): Round-the-clock nursing care, often for recovery after surgery, injury, or illness. MC (Memory Care): Secured, specialized care for people living with Alzheimer's or dementia. PC (Palliative Care): Comfort-focused care for serious illness at any stage, including alongside curative treatment.
Neighborhood or city area where the facility is located. Proximity to family, hospitals, and green space matters for both quality of life and ease of visitation. Consider drive time and transit access when evaluating location.
Licensed bed capacity. Larger facilities (300+ beds) often have more specialized programs but can feel institutional. Smaller homes (under 150 beds) tend to deliver more personalized care. Compare with Avg Res/Day to understand how full the facility typically runs.
Percentage of licensed beds filled on an average day. Color indicates financial health: green (90%+) = operationally strong, typically profitable. Amber (80–89%) = stable but leaving revenue on the table. Orange (70–79%) = financial strain likely, may struggle with fixed costs. Red (<70%) = significant distress, closure or ownership change risk increases sharply.
This facility's occupancy rate compared to the statewide average for similar facilities. A positive number means above-average demand. Facilities running 5%+ above the state average are typically the most sought-after in their market — a strong proxy for reputation.
CMS-adjusted total nurse hours per resident per day (RN + LPN + CNA combined). The national average is approximately 3.5 hrs. Higher is better — more direct care time per resident. Below 3.0 is a red flag. CMS weights RN hours more heavily because RNs handle complex clinical decisions that CNAs cannot.
CMS Health Inspection star rating (1–5 stars), based on the 3 most recent annual state surveys plus any complaint investigations. This is the hardest rating to manipulate — it reflects real surveyor findings on-site. 5 stars = fewest deficiencies found. 1 star = most. It carries the heaviest weight in the Overall CMS rating.
CMS Staffing star rating (1–5 stars), based on daily nurse staffing hours submitted to CMS via verified payroll data. Compares RN, LPN, and CNA coverage relative to resident acuity level. 5 stars = well above expected staffing. Weekend staffing is evaluated separately, as that's where many facilities quietly reduce coverage.
CMS Quality Measures star rating (1–5 stars), based on 15 clinical outcome metrics including fall rates, pressure ulcers, antipsychotic drug use, and hospital readmissions. Captures actual resident health outcomes, not just compliance. High QM combined with low Health Inspection scores can indicate a facility with strong care but weak documentation practices.
Registered Nurse hours per resident/day compared to the statewide average. RNs are the highest-skilled nursing staff — they assess residents, manage medications, and respond to emergencies. A value of +50% means RN coverage is 50% above the state norm. Negative values are a concern for residents with complex or acute medical needs.
Total nursing staff hours (RN + LPN + CNA combined) per resident/day vs. the statewide average. A broader measure than RN vs State — it captures the entire care team. A facility can have high total staffing but low RN hours, meaning more aides and fewer nurses. Read both columns together for the full picture.
Total dollar amount of federal monetary fines (civil money penalties) issued by CMS in the past 3 years. Fines are only levied for serious violations — typically actual harm to residents, repeated uncorrected deficiencies, or systemic non-compliance. Even a single fine is noteworthy. Multiple fines strongly suggest a pattern, not isolated incidents.
Total health deficiency citations from the most recent standard inspection cycle. Minor citations (scope A–C) are common and often administrative in nature. Higher counts aren't always disqualifying, but should be read alongside Severe Citations to understand actual harm levels. Under 10 is strong for a large facility; 30+ warrants a closer look.
Average deficiency citations per CMS inspection (survey) in the reporting window — total citations divided by the number of inspections. Lower is better; compare alongside total Citations and Severe Citations for context.
Citations at CMS scope/severity level G or higher — G–I means actual harm occurred; J–L means residents were placed in immediate jeopardy. (D–F is potential for harm only). Examples include unaddressed falls, medication errors causing injury, neglect, or abuse.
Average number of residents in the building on any given day, derived from annual census data. Reflects true operating scale — a 400-bed facility running 200 residents/day operates very differently from one at 390. Higher resident counts generally mean more funded staffing hours.
Better Business Bureau rating (A+ to F). Reflects complaint history, business transparency, and how family disputes were resolved. A+ means no significant unresolved complaints. A blank (—) means the facility isn't BBB-accredited, which is common for healthcare providers and not necessarily a negative signal.
Walk Score® (0–100). Measures walkability of the surrounding area. 90–100 = Walker's Paradise. 70–89 = Very Walkable. 50–69 = Somewhat Walkable. Below 50 = Car-Dependent. Higher scores benefit family visitors, resident outings, and staff commuting.
The licensed owner or operator of record filed with CMS — the individual or organization legally accountable for the facility. Searching the operator name across other facilities can reveal chain or multi-site ownership, which matters: chain-operated homes tend to have more variable quality outcomes than independently run facilities.
What the home actually collects for resident care, after contractual allowances, bad debt and discounts — not gross billings. Taken from the latest complete annual cost report, so it is comparable across homes reporting the same period. Revenue alone doesn't indicate care quality, but it funds staffing and capital reinvestment. Pair with Payroll %. Figures are from each facility's most recent complete fiscal year — hover a value for the exact year; a * marks homes that report an older period than most facilities.
Staff salaries plus wage-related benefits from the latest complete annual cost report. Contract and agency labour is counted separately, under other operating costs, so a home leaning on agency staff can show a low figure here. Payroll is the cost most directly tied to care quality — compare with Payroll % for full context. Figures are from each facility's most recent complete fiscal year — hover a value for the exact year; a * marks homes that report an older period than most facilities.
Payroll as a share of NET PATIENT REVENUE (not gross revenue). Both figures come from the same cost-report year. A higher figure means more of each revenue dollar goes to staff pay. Read with the Staffing star rating to judge whether spend translates into coverage — and note that homes whose patient revenue covers only part of their operation can read implausibly high. The Kansas average is: 57.8% Figures are from each facility's most recent complete fiscal year — hover a value for the exact year; a * marks homes that report an older period than most facilities.
CMS Certification Number: the unique federal identifier for this skilled nursing provider.
Kansas City Transitional Care
NH
PC
SNF
Kansas City (Rosedale)
96
Facility 96
KS AVG 69
Rank #40 / 223
97.9%
Facility 97.9%
KS AVG 77.3%
Rank #8 / 203
+27%
3.08
Facility 3.08
KS AVG 4.63
Rank #131 / 137
+43%-34%
$0
Facility $0
KS AVG $49.2k
Rank #1 / 143
42
Facility 42
KS AVG 26.9
Rank #116 / 143
5.3
Facility 5.3
KS AVG 6.1
Rank #56 / 143
194-
79
Facility 79
KS AVG 47
Rank #21 / 352
Ignite Kumed Jv LLC
$12.1MFiscal year ending 12/2023
Facility $12.1MFiscal year ending 12/2023
KS AVG $8.3M
Rank #26 / 139
$4.9MFiscal year ending 12/2023
Facility $4.9MFiscal year ending 12/2023
KS AVG $4.8M
Rank #45 / 139
40.2%Fiscal year ending 12/2023
Facility 40.2%Fiscal year ending 12/2023
KS AVG 57.8%
Rank #133 / 139
175544
The Healthcare Resort of Kansas City
NH
AL
SNF
Kansas City (Victory Hills)
70
Facility 70
KS AVG 69
Rank #83 / 223
94.3%
Facility 94.3%
KS AVG 77.3%
Rank #18 / 203
+22%
4.47
Facility 4.47
KS AVG 4.63
Rank #70 / 137
-36%-3%
$28.8k
Facility $28.8k
KS AVG $49.2k
Rank #107 / 143
45
Facility 45
KS AVG 26.9
Rank #122 / 143
9.0
Facility 9.0
KS AVG 6.1
Rank #126 / 143
366-
11
Facility 11
KS AVG 47
Rank #337 / 352
Ryan Leiker
$9.0MFiscal year ending 12/2023
Facility $9.0MFiscal year ending 12/2023
KS AVG $8.3M
Rank #42 / 139
$5.7MFiscal year ending 12/2023
Facility $5.7MFiscal year ending 12/2023
KS AVG $4.8M
Rank #42 / 139
62.9%Fiscal year ending 12/2023
Facility 62.9%Fiscal year ending 12/2023
KS AVG 57.8%
Rank #43 / 139
175548
Riverbend Post Acute Rehabilitation-
NH
AL
MC
SNF
Kansas City (Victory Hills)
131
Facility 131
KS AVG 69
Rank #15 / 223
89.9%
Facility 89.9%
KS AVG 77.3%
Rank #44 / 203
+16%
3.59
Facility 3.59
KS AVG 4.63
Rank #117 / 137
----7%-22%
$84.0k
Facility $84.0k
KS AVG $49.2k
Rank #131 / 143
33
Facility 33
KS AVG 26.9
Rank #101 / 143
5.5
Facility 5.5
KS AVG 6.1
Rank #61 / 143
1118-
57
Facility 57
KS AVG 47
Rank #119 / 352
Cory Schulte
$12.3MFiscal year ending 12/2023
Facility $12.3MFiscal year ending 12/2023
KS AVG $8.3M
Rank #23 / 139
$7.9MFiscal year ending 12/2023
Facility $7.9MFiscal year ending 12/2023
KS AVG $4.8M
Rank #17 / 139
64.3%Fiscal year ending 12/2023
Facility 64.3%Fiscal year ending 12/2023
KS AVG 57.8%
Rank #38 / 139
175298

Rank badges are statewide: each community is ranked against every KS community we track that reports that metric, not just the 3 analyzed for Kansas City.

Overview of Kansas City Transitional Care

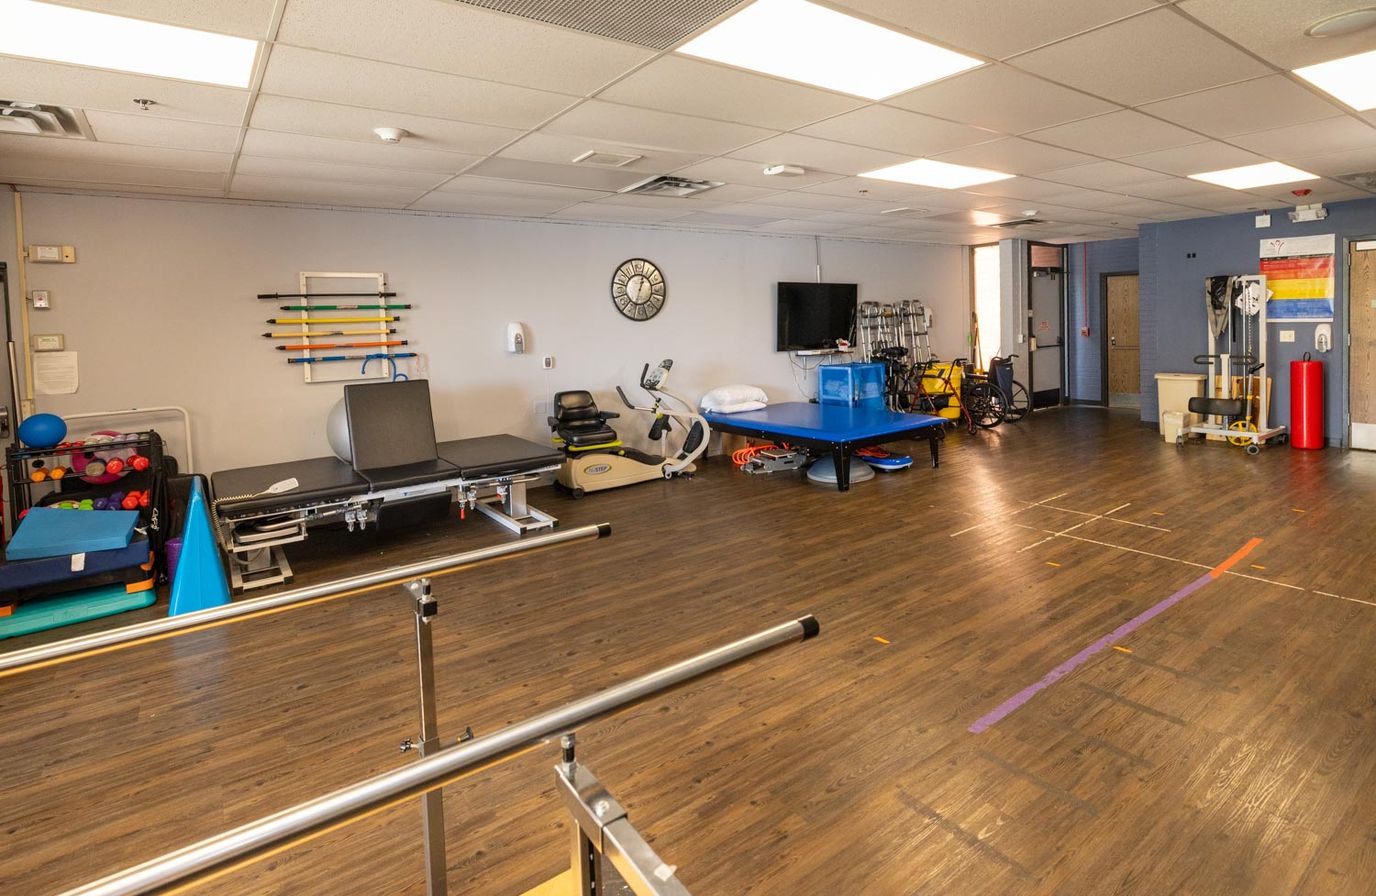
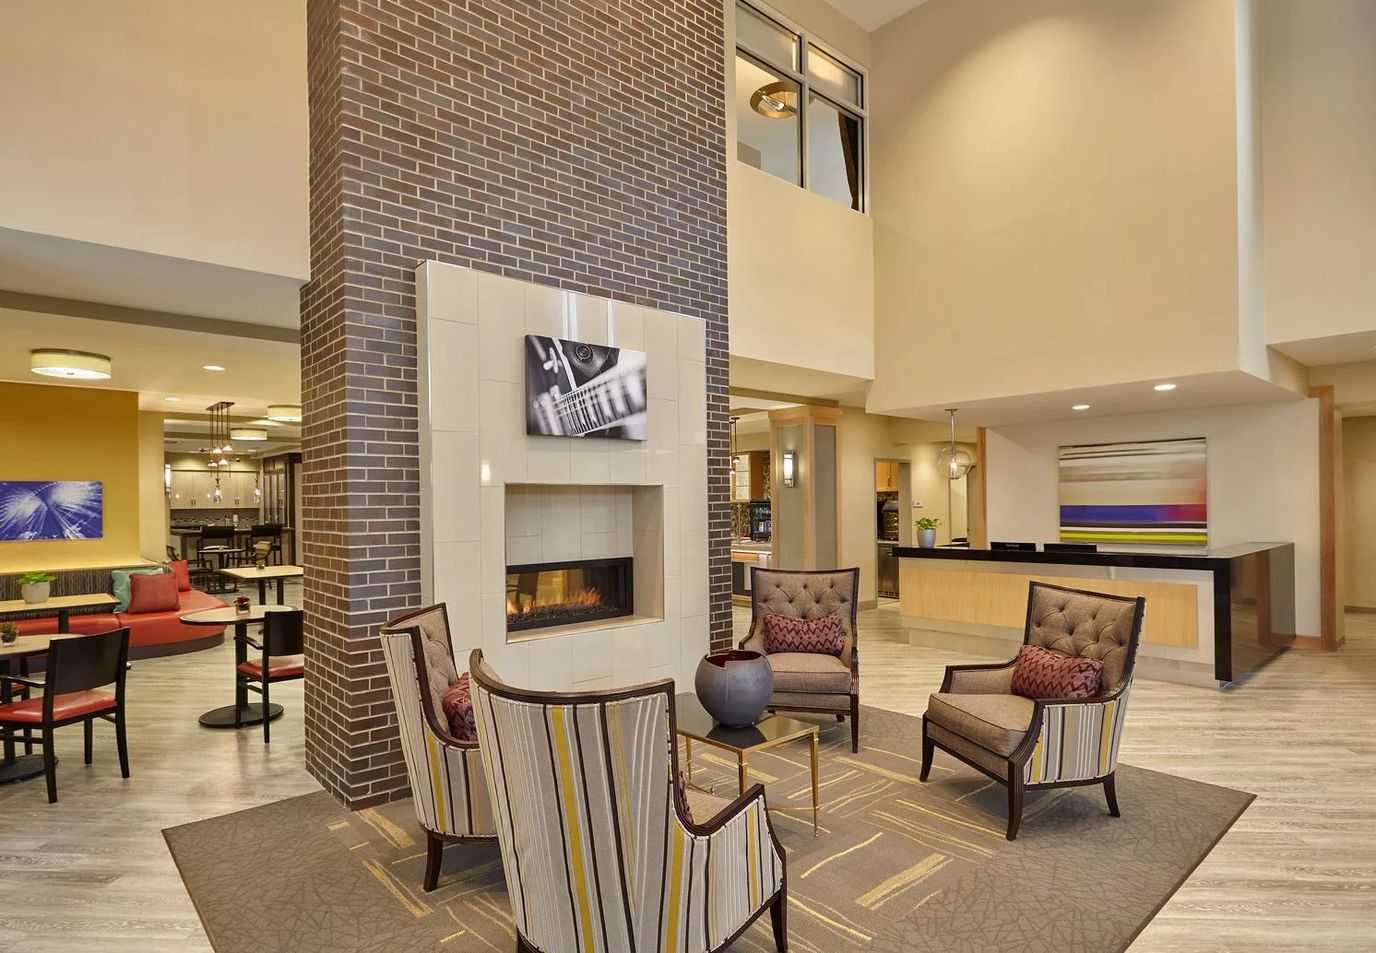
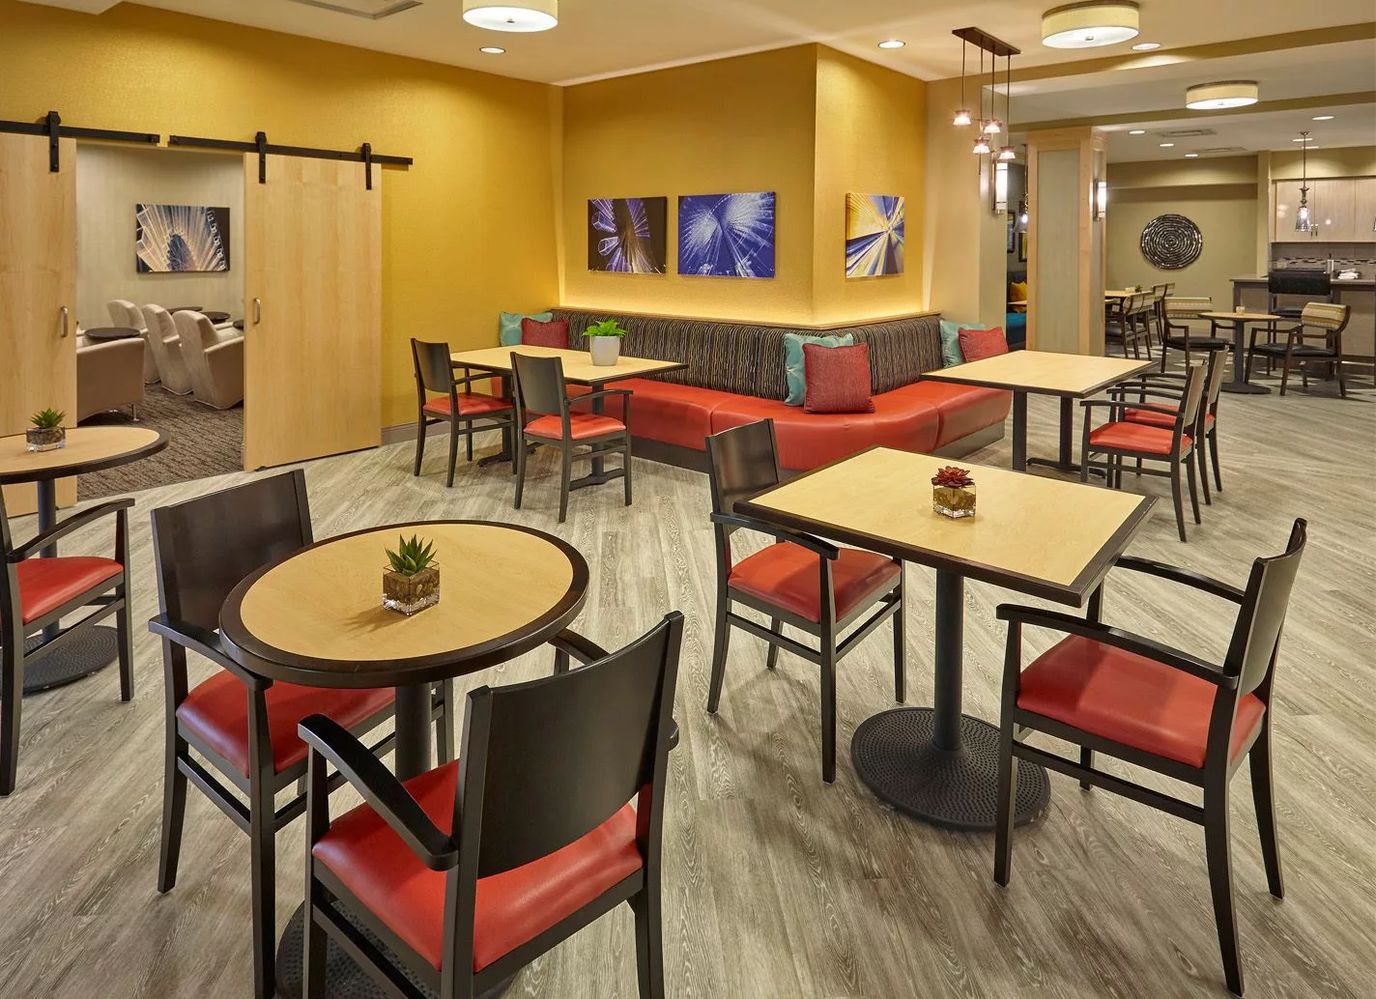
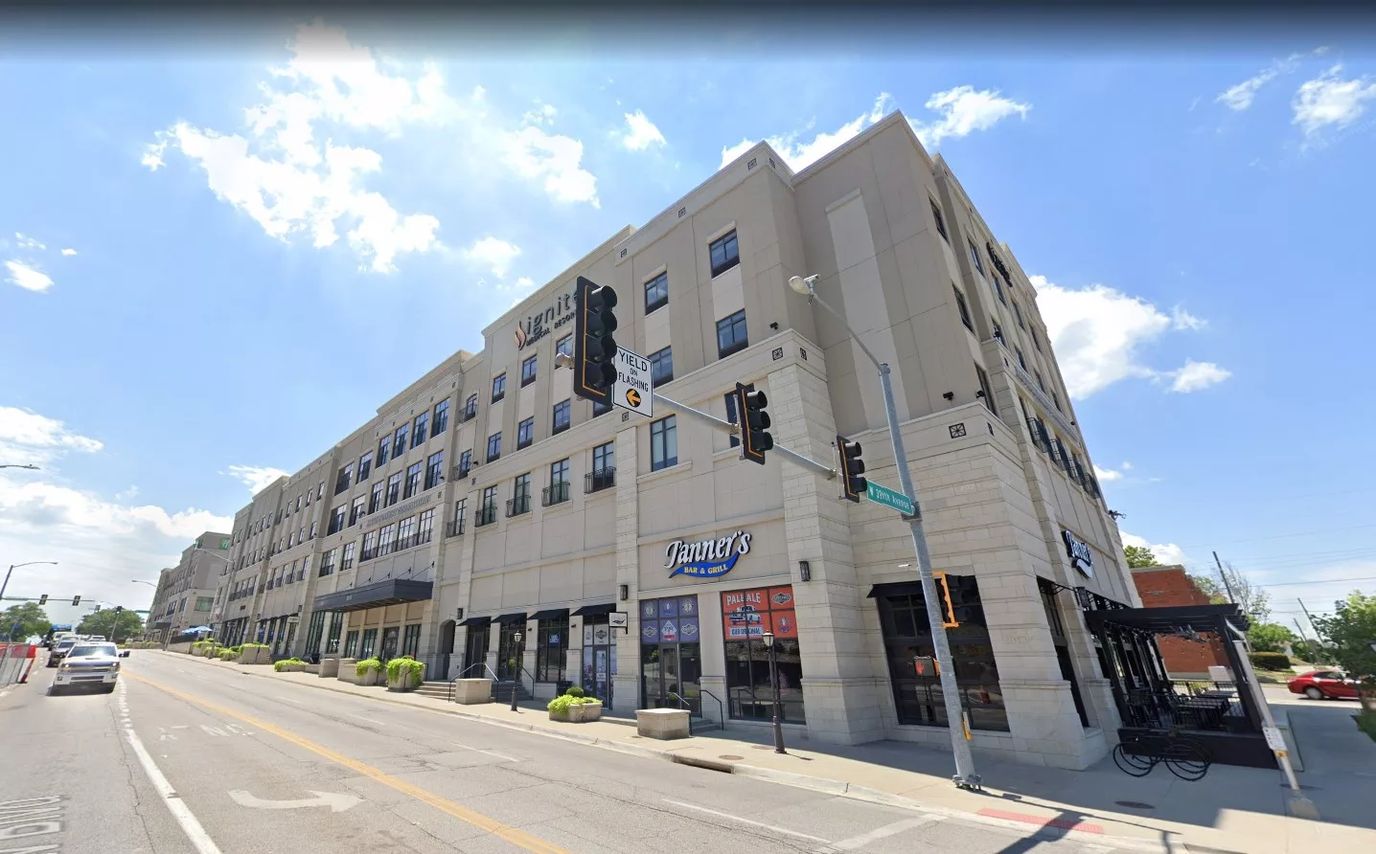
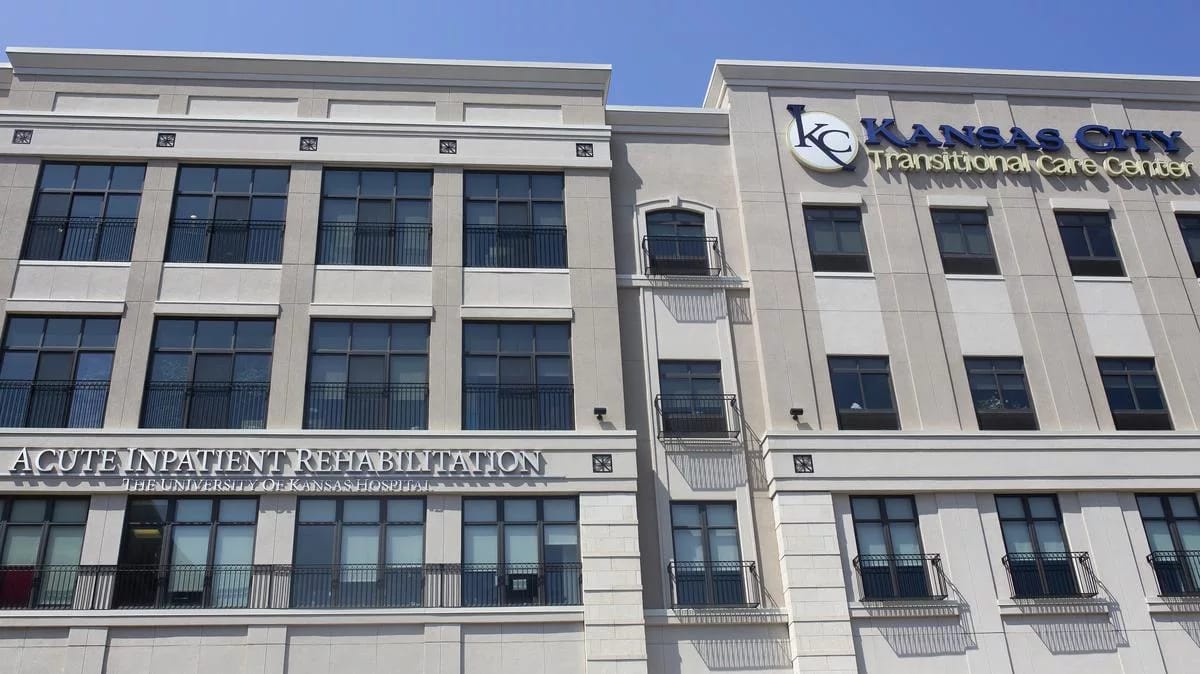
Located in the heart of Wyandotte County, Kansas City Transitional Care sets the standard for exceptional skilled nursing services. With an unwavering commitment to delivering top-notch care, this facility boasts a team of highly trained and experienced skilled nurses, therapists, and licensed care professionals. Renowned for its expertise and comprehensive approach, Kansas City Transitional Care excels in catering to a wide range of medical needs. 
From meticulous medication management to specialized oncology care, their dedicated staff ensures that every individual receives personalized attention and the highest level of support. With a focus on creating a nurturing and engaging environment, Kansas City Transitional Care goes above and beyond to empower residents on their path to wellness. Their compassionate approach and extensive knowledge enable them to provide holistic care that meets the unique needs of each resident. As a trusted destination for skilled nursing and transitional care, Kansas City Transitional Care embodies professionalism and a deep commitment to enhancing the lives of those they serve. 

Contact Kansas City Transitional Care

Overview of The Healthcare Resort of Kansas City

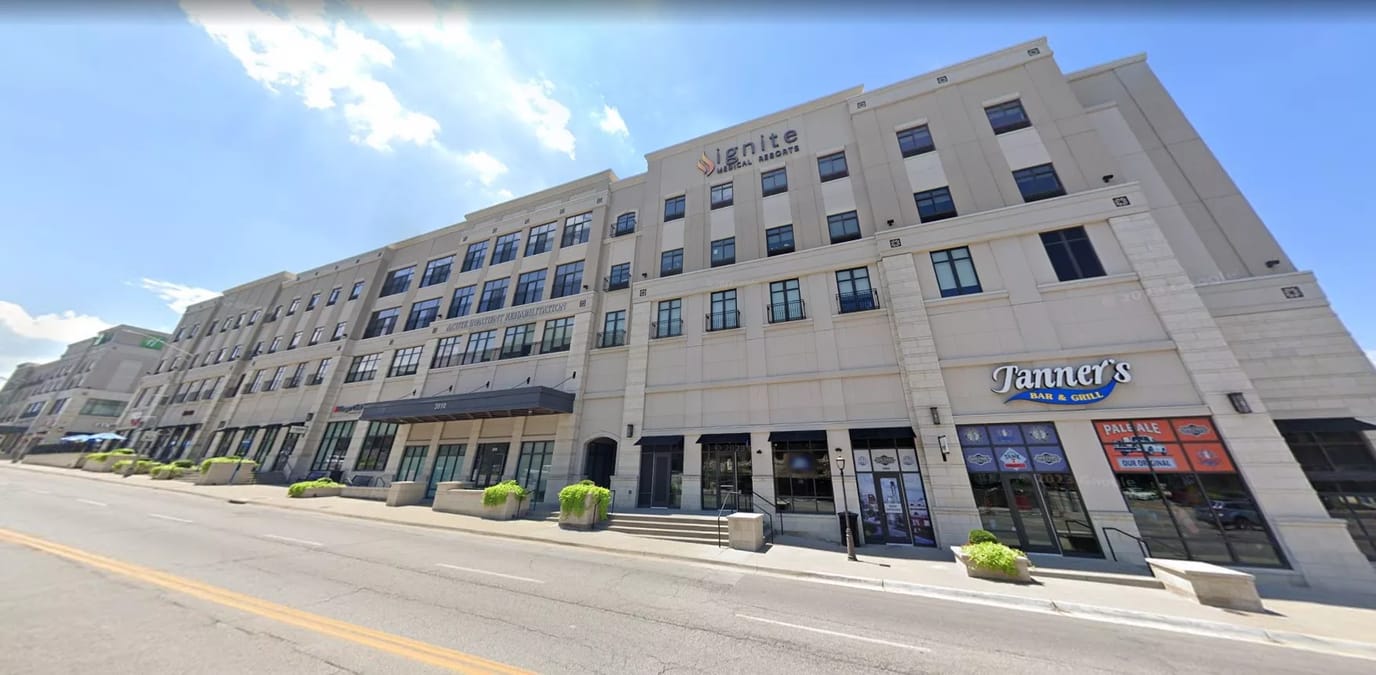
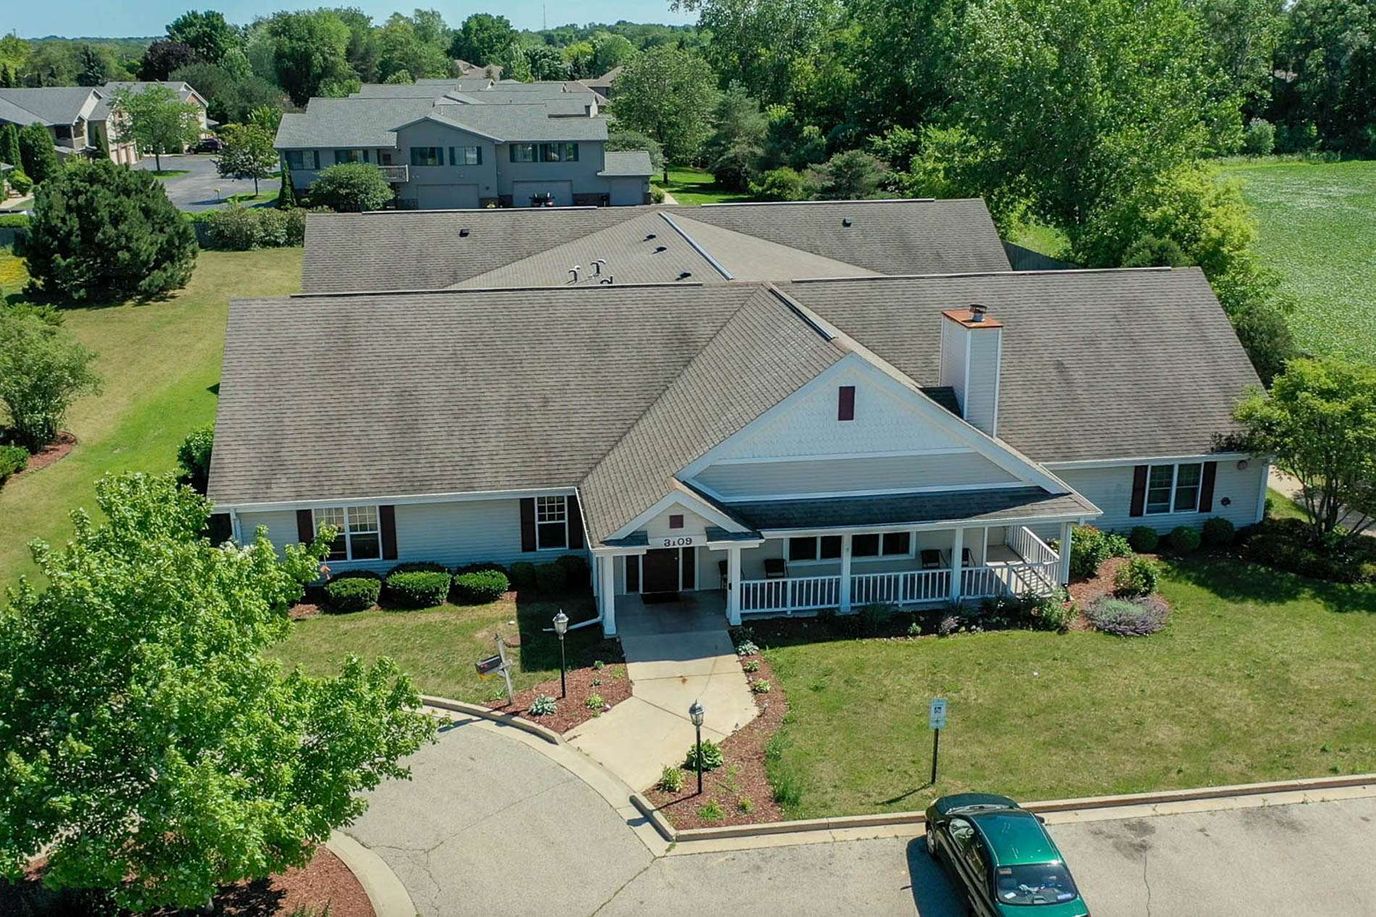
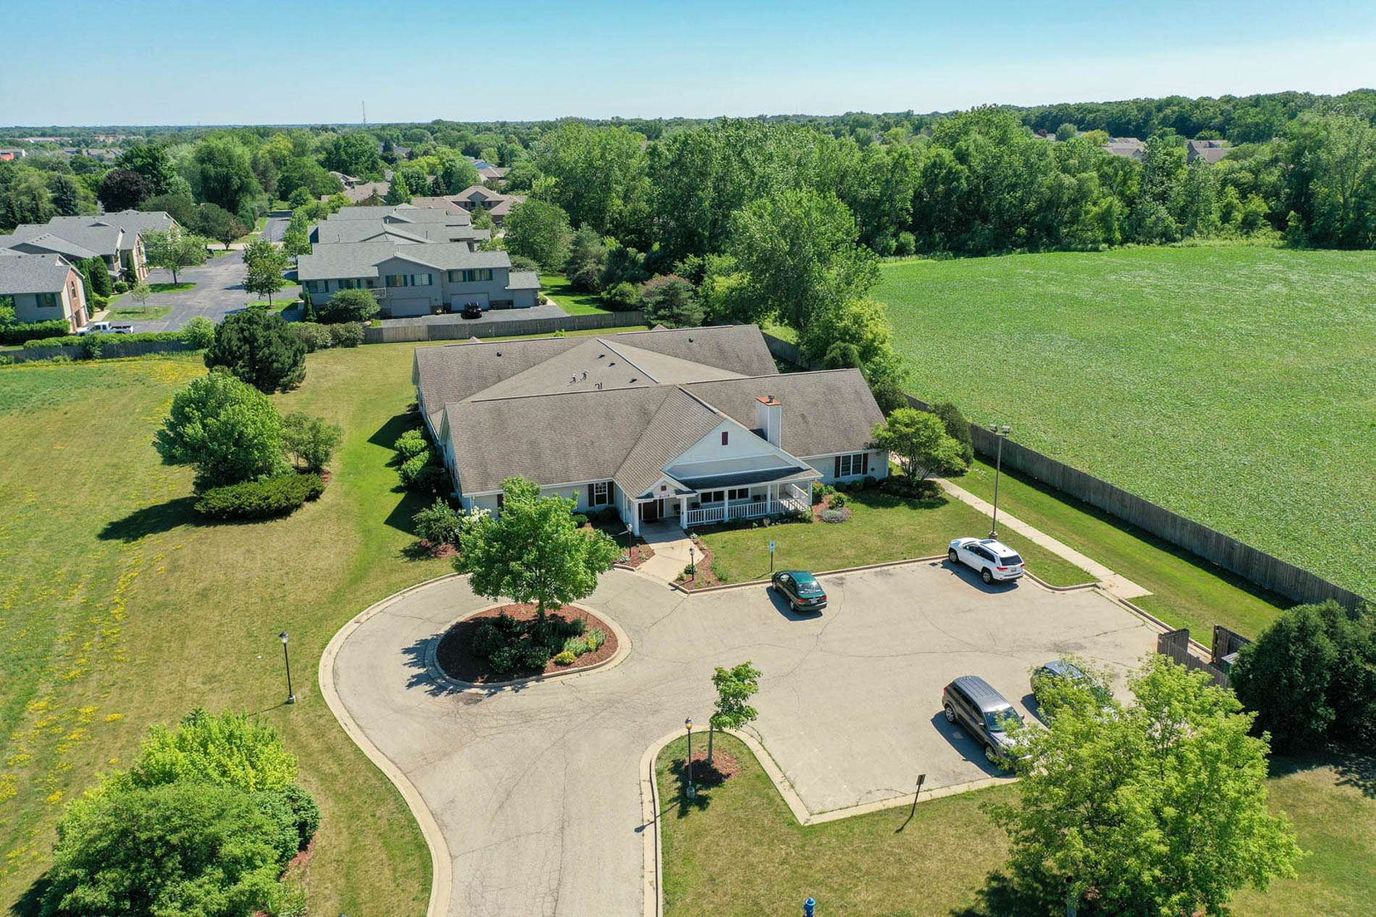
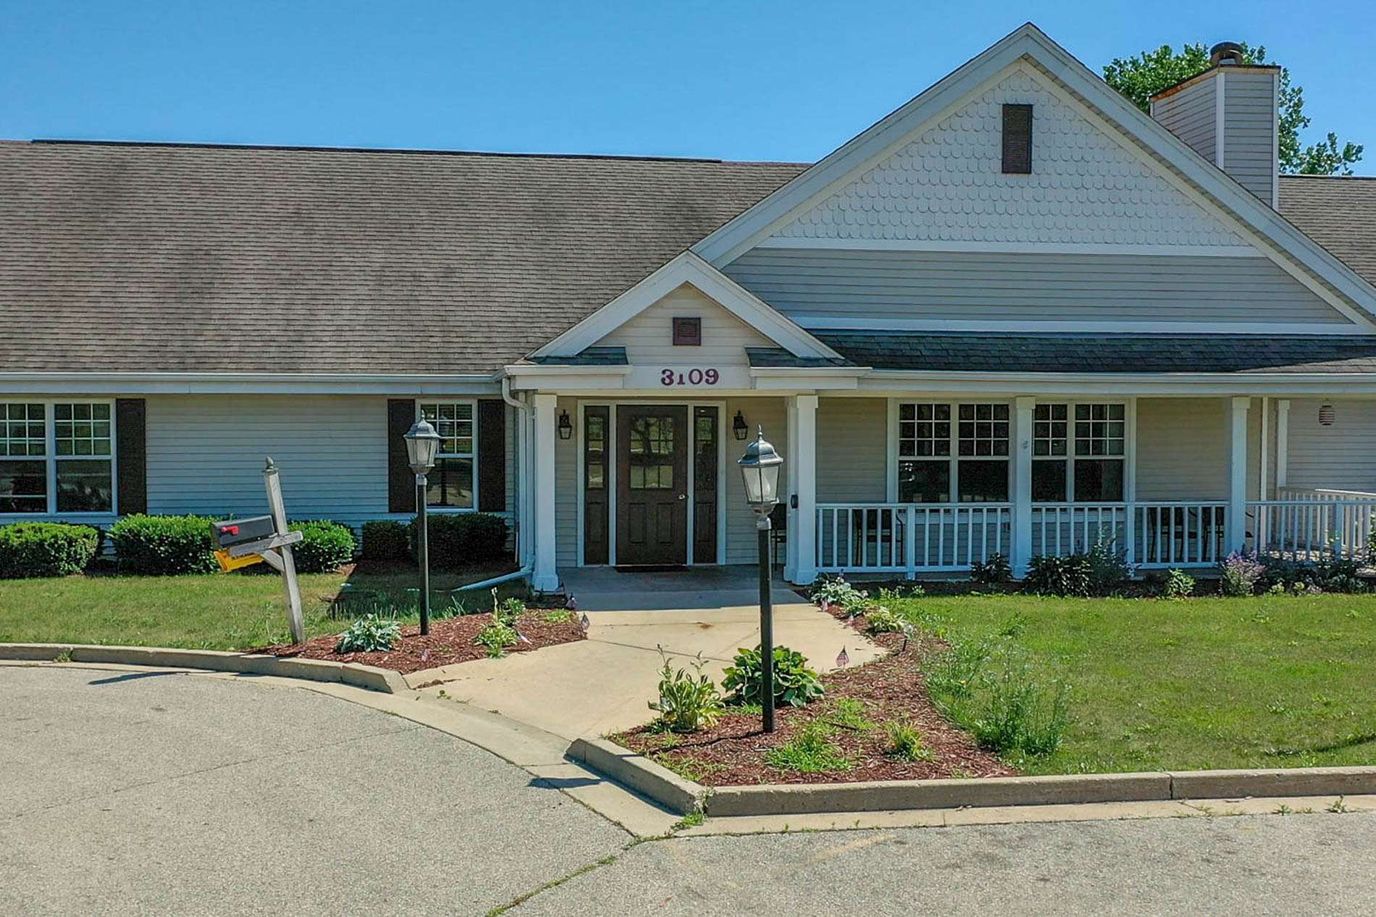
Situated at 8900 Parallel Parkway in Kansas City’s Victory Hills neighborhood, The Healthcare Resort of Kansas City operates 105 beds under private ownership by Ryan Leiker.

The facility launched in May 2015 as a dual nursing home and assisted living community accepting Medicare, Medicaid, and private-pay residents. Its 3-star overall CMS rating reflects mixed clinical performance. The current census is 66 residents at 62.9% occupancy, below the Kansas state average of 79.5%. The facility’s care model emphasizes short-stay rehabilitation, with an average length of stay of 58 days.

Five surveys since 2021 identified 54 deficiencies; 46% fewer than the typical Kansas nursing home. Yet the July 2024 routine inspection found 13 deficiencies spanning resident safety, medication management, and training compliance.

Notably, the facility received three serious citations, 233% above the Kansas state rate for this severity level. A March 2024 complaint investigation documented failure to prevent surgical amputation when inadequate diabetic foot wound care allowed progressive infection.

CMS imposed a $29,000 penalty in July 2024.

Total nursing coverage averages 5 hours 3 minutes per resident daily, 7% above Kansas state average. Nurse aide hours average 3 hours 18 minutes (22% above state), and on-site physical therapy runs 8 minutes per resident per day—triple the state average. The staff-to-resident ratio of 3.24:1 is 45% better than state norms.

However, payroll represents only 54.5% of revenue, placing the facility near the bottom third statewide on this metric.

The facility achieved 5-star performance on quality measures, 55.8% above Kansas averages. Long-stay residents show strong functional recovery, with 72.2% achieving expected self-care ability at discharge (35% above state average) and 63.8% successfully returning home or community (26% above average). Conversely, 17.6% of residents experienced significant unintended weight loss—246% worse than state average—and pressure ulcer rates in high-risk residents run 30% above state average.

The facility serves primarily short-stay Medicare rehabilitation and private-pay admissions requiring skilled nursing intervention during transitional care episodes.

Contact The Healthcare Resort of Kansas City

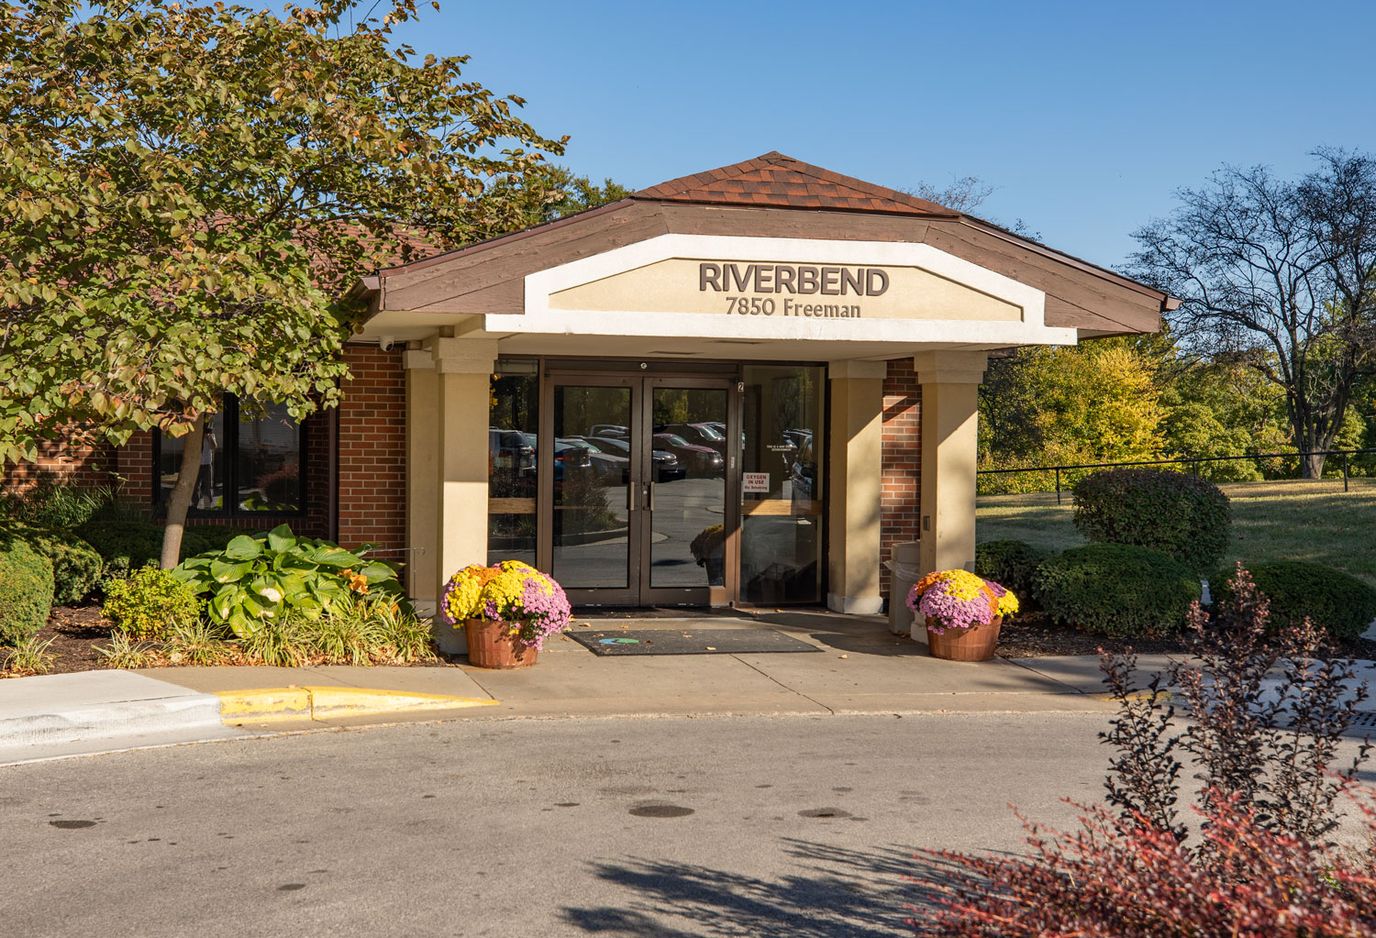
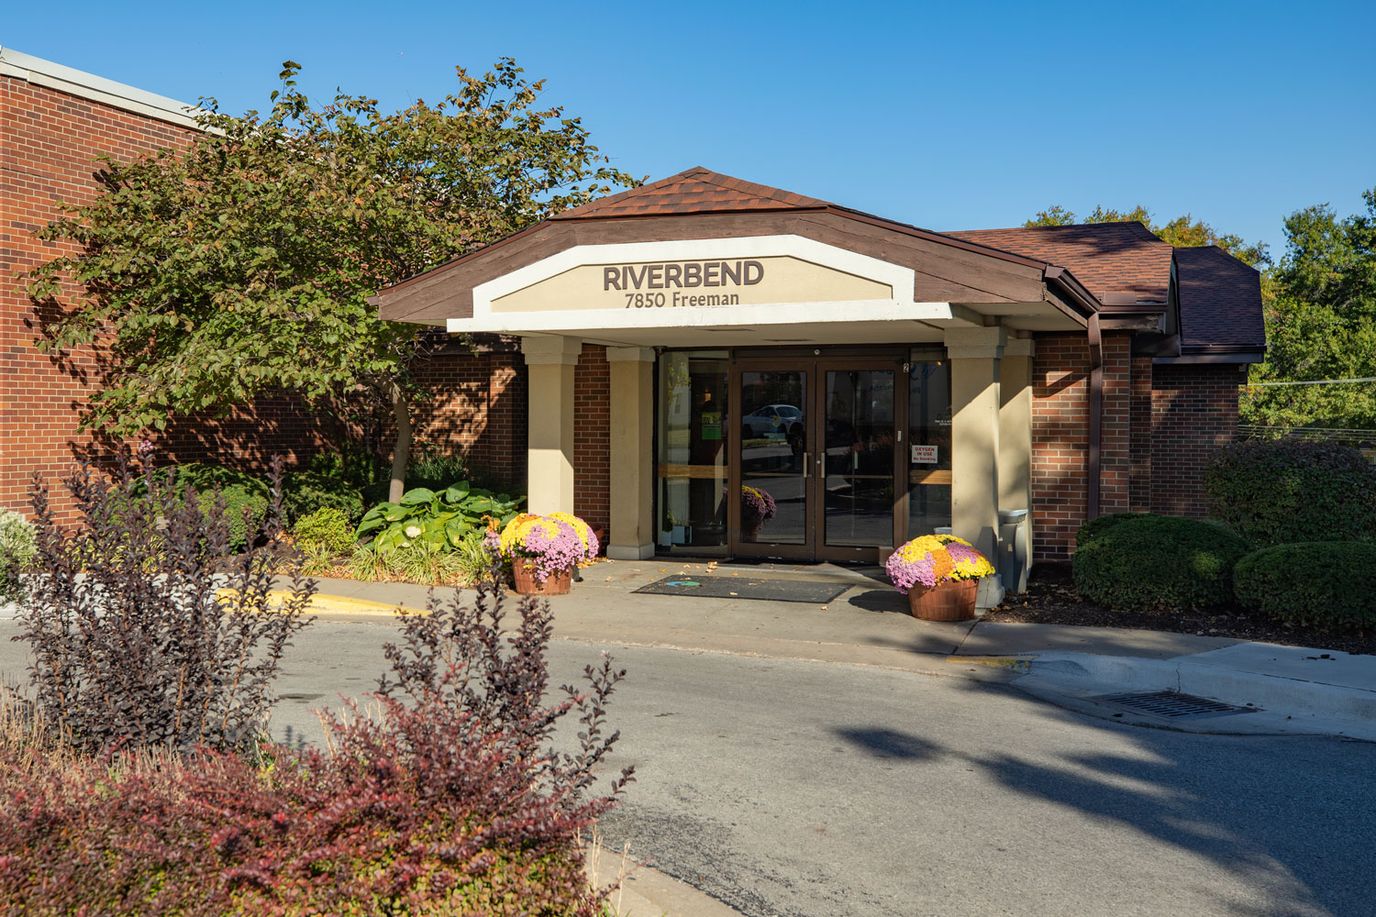
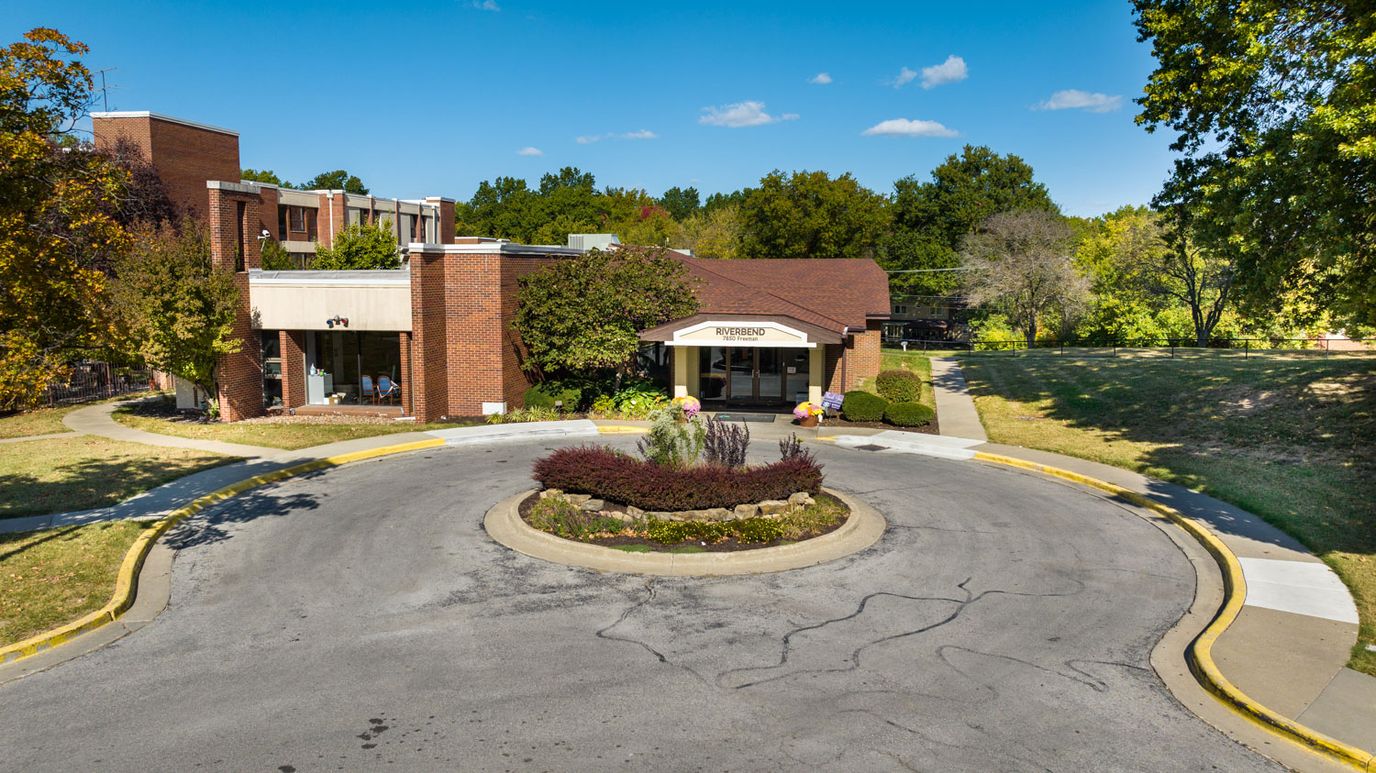
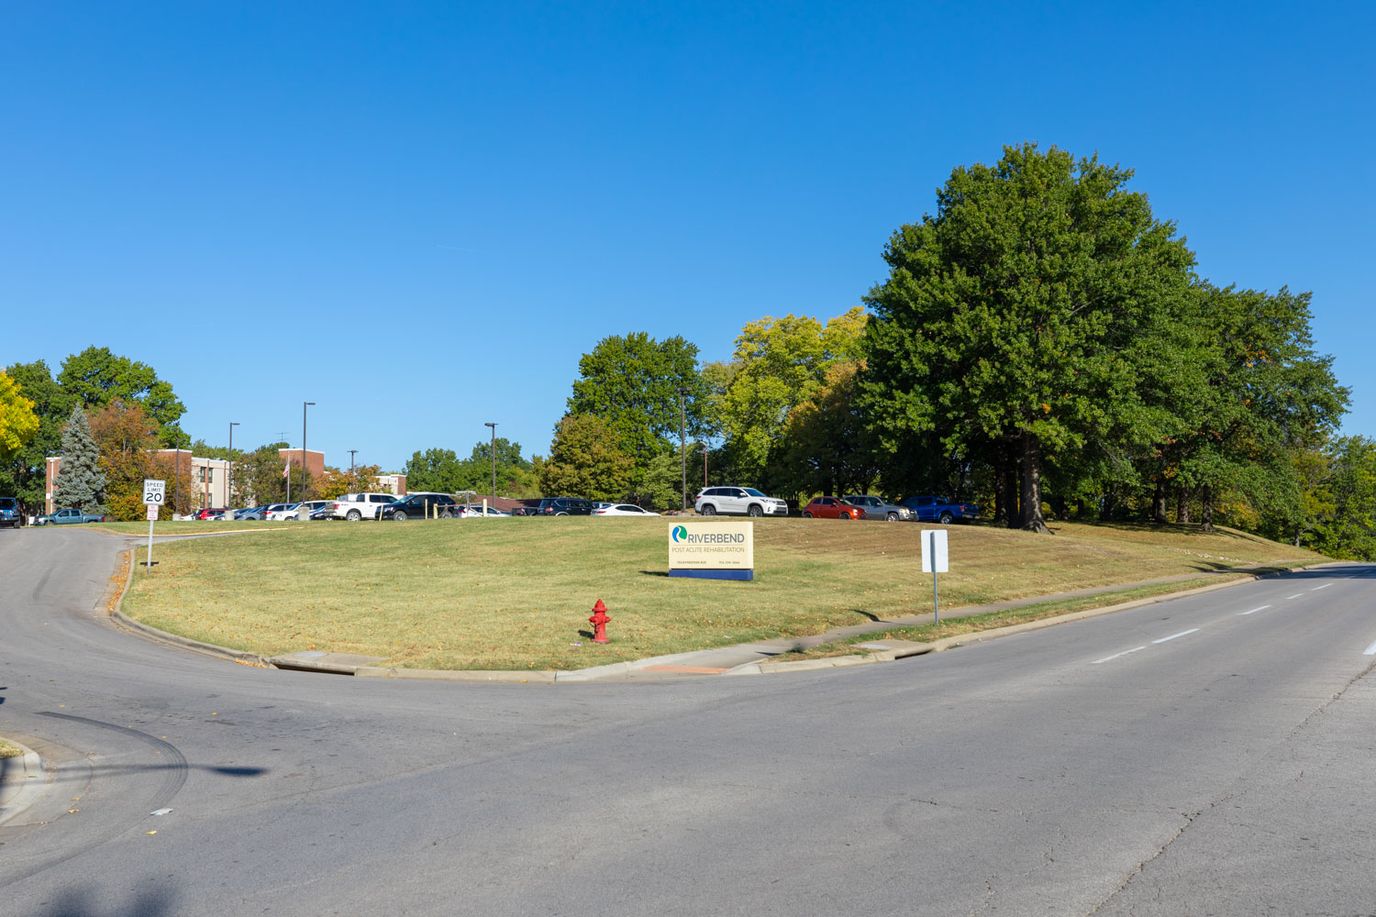
Overview of Riverbend Post Acute Rehabilitation

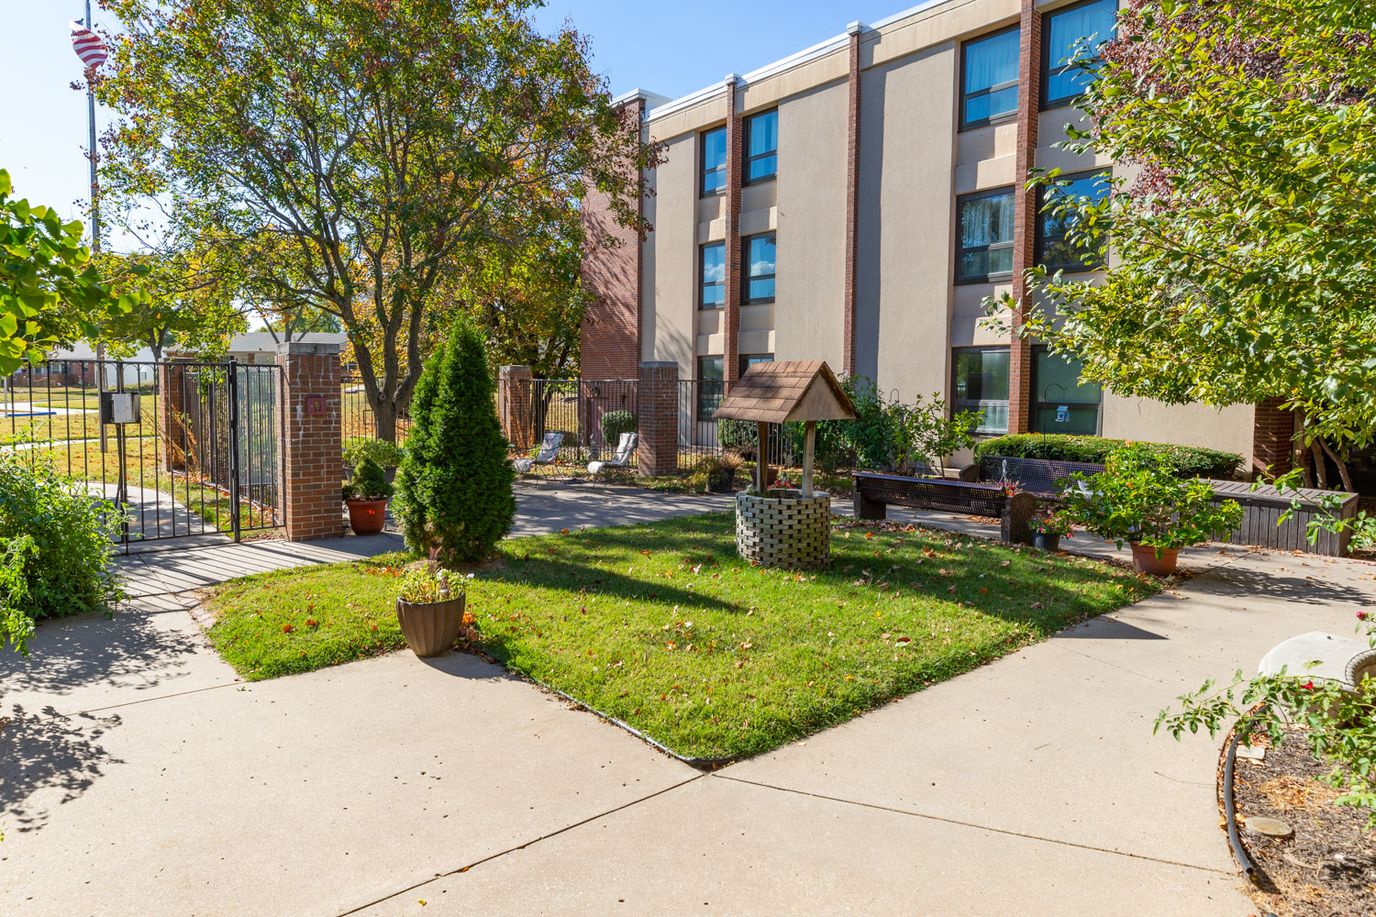
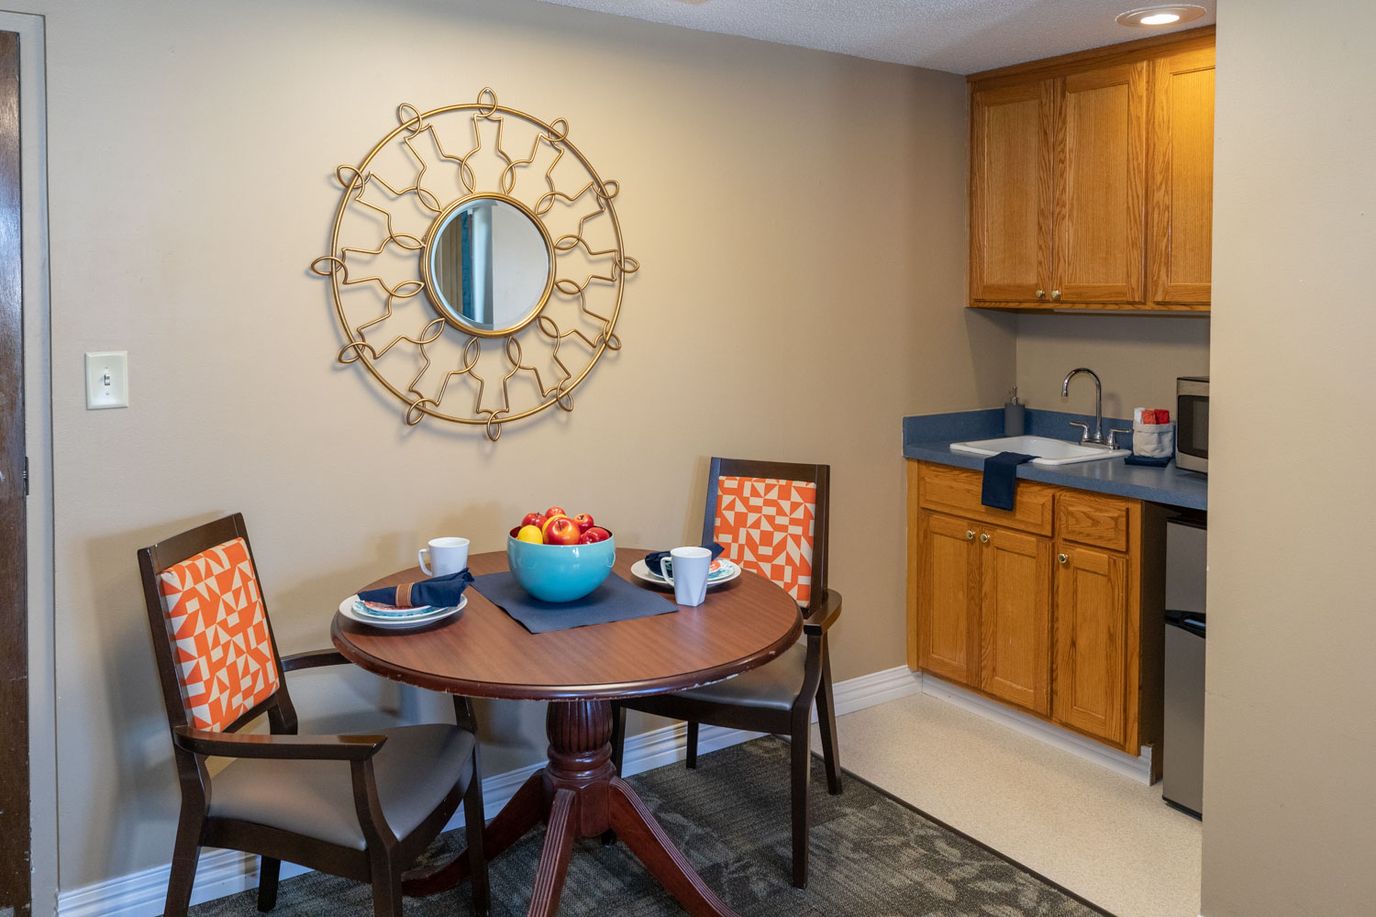
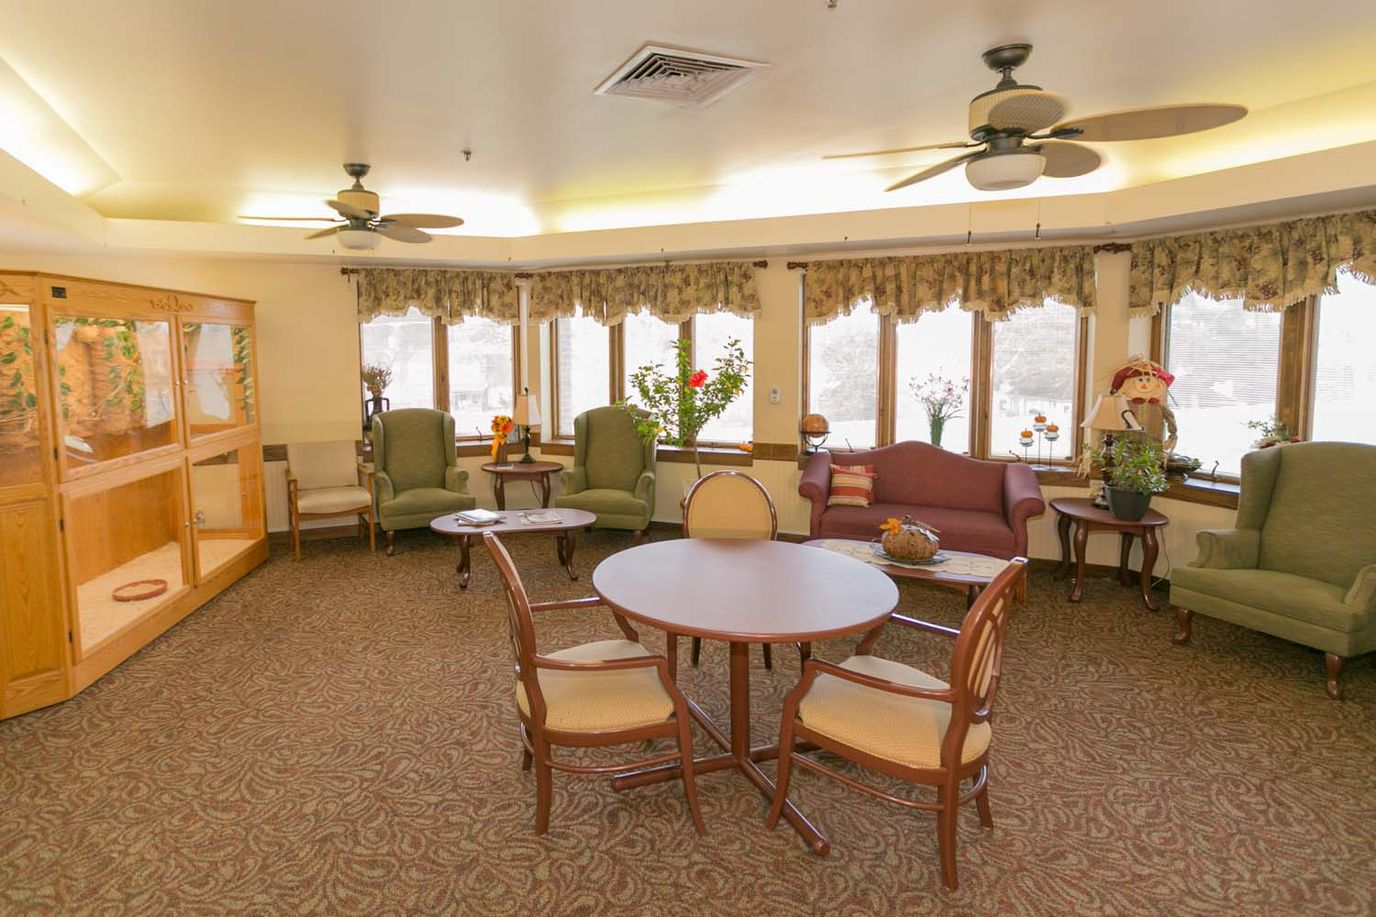
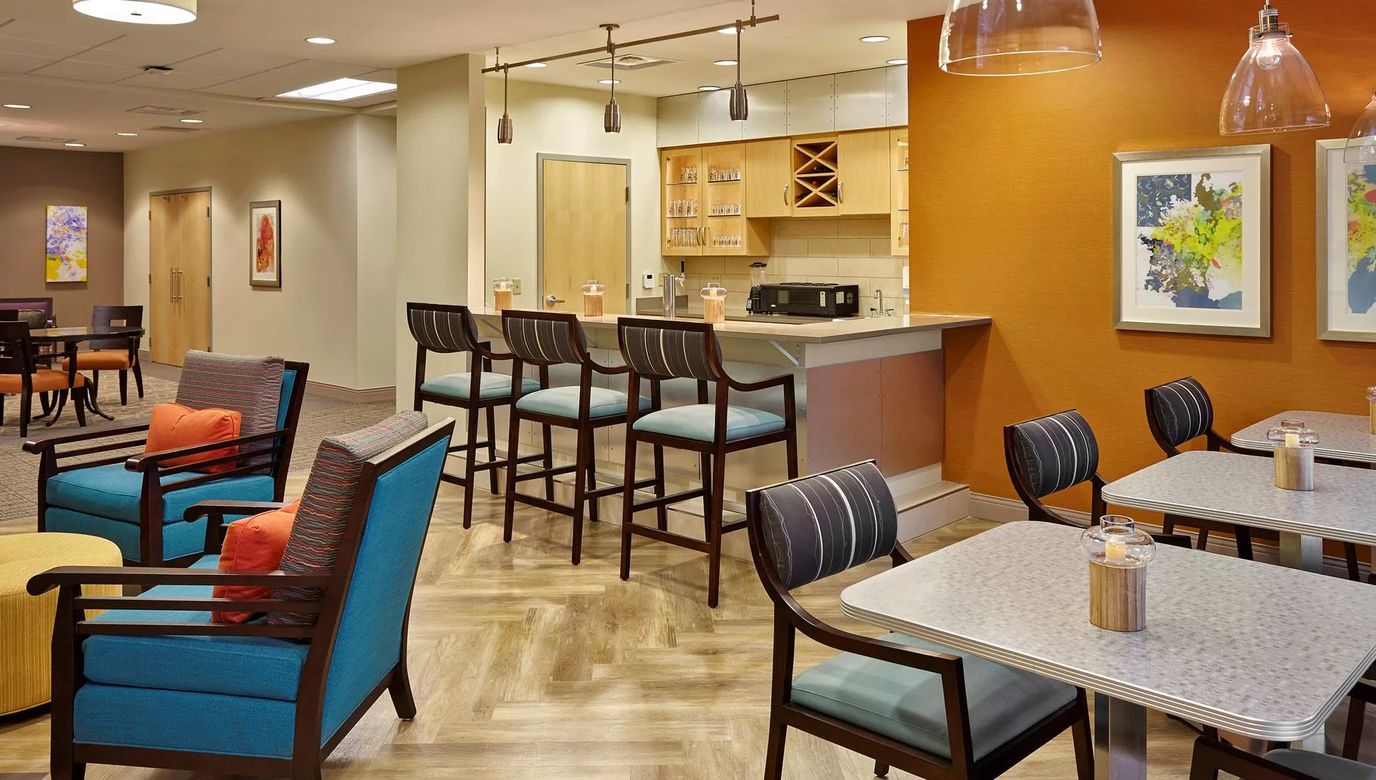
Riverbend Post Acute Rehabilitation, located in the thriving city of Kansas City, is renowned for its unparalleled commitment to delivering exceptional care and elevating residents’ well-being to new heights. With a team of highly skilled and devoted professionals at the helm, Riverbend is dedicated to ensuring the utmost level of service and personalized attention for each individual in their care.
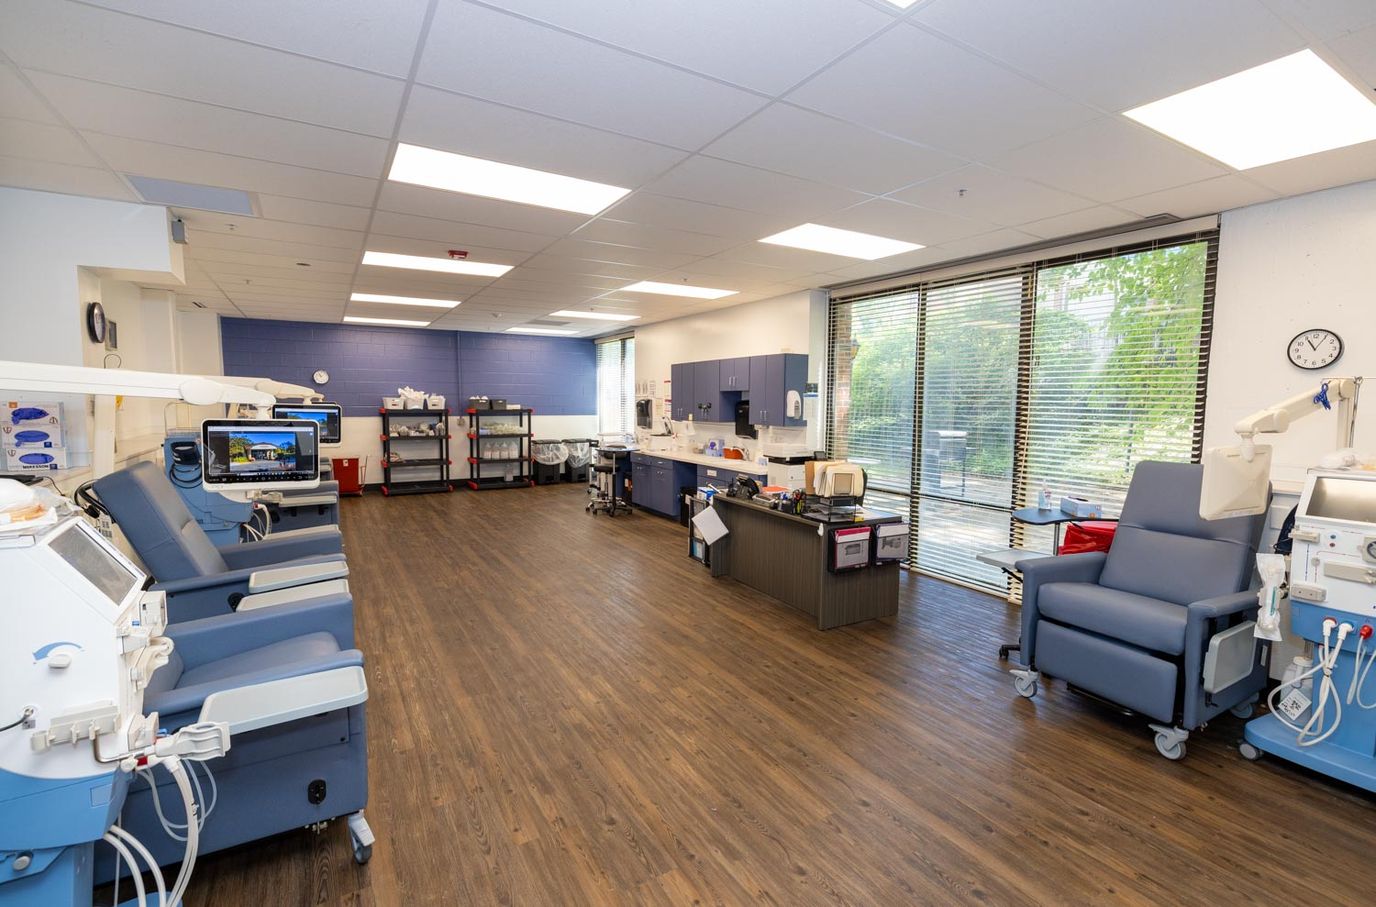
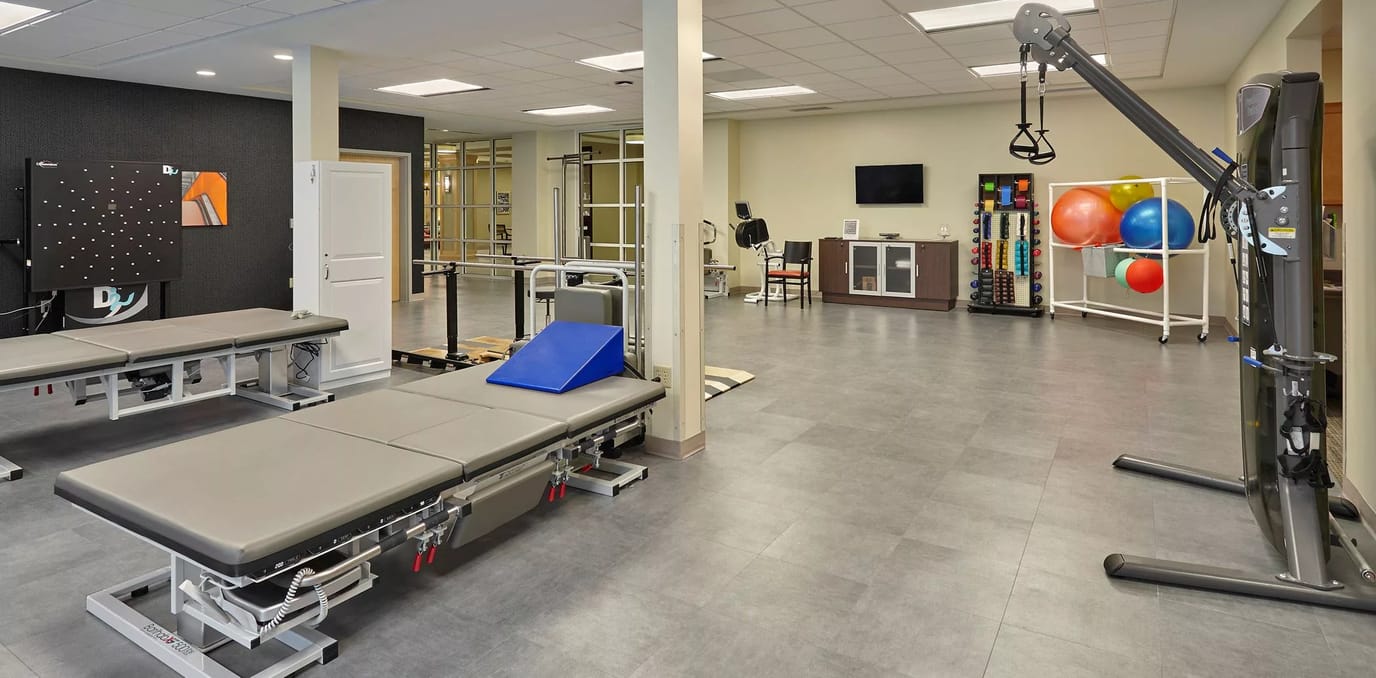
By offering an extensive array of in-house therapy and skilled nursing services, Riverbend empowers residents to embark on a journey of recovery and renewed vitality. Their state-of-the-art facilities serve as the backdrop for cutting-edge therapeutic interventions, while their innovative approaches are meticulously tailored to address the unique needs of every resident. The community itself has been thoughtfully designed to cultivate engagement and optimize the delivery of skilled nursing care. The in-house therapy program, staffed by a dedicated team of experienced professionals, provides comprehensive rehabilitation services without relying on external contractors or agencies. This approach guarantees seamless continuity of care and a holistic therapeutic experience.

Contact Riverbend Post Acute Rehabilitation

Ranking Methodology

How we rank these nursing homes

Every nursing home above is evaluated across five weighted categories using CMS data including Care Compare, Payroll-Based Journal, and Medicare Cost Reports.

  • CMS data
  • 5 weighted categories
  • Updated quarterly
Full methodology

Weighting overview

  • 35%
    Care Quality
  • 20%
    Staffing
  • 20%
    Regulatory
  • 20%
    Operational
  • 5%
    Environment
01

Care Quality 35%

The largest single share of every ranking. CMS star ratings and quality measures that reflect actual care delivered to residents.

  • Includes
  • Overall Rating
  • Health Inspection
  • QM Rating
  • Long-Stay QM
  • Short-Stay QM
02

Staffing Adequacy 20%

The strongest predictor of resident outcomes. Volume and stability of nursing care, drawn from CMS Payroll-Based Journal.

  • Includes
  • Nurse Hrs/Res/Day
  • RN vs State
  • Total Nurse Staff Hrs vs State
  • RN Turnover
03

Regulatory & Safety Record 20%

Inspection patterns that star ratings can mask. We weight per-inspection rates more heavily than raw counts.

  • Includes
  • Citations
  • Citations/Inspection
  • Severe Citations
  • Fines
  • Accreditations
04

Operational & Financial Stability 20%

Stable operations and sound finances are leading indicators of consistent care over time.

  • Includes
  • Occupancy vs State
  • Avg Length of Stay
  • Revenue
  • Payroll %
  • Years in Operation
  • Admin Tenure
05

Environment & Accessibility 5%

Context that matters to families but doesn't directly measure clinical care. Weighted lower for nursing homes than for assisted or independent living.

  • Includes
  • Walk Score
  • BBB Rating
No paid rankings Facilities cannot pay to influence placement.
How we're paid: If we help you find a home and you move in, that home may pay us a referral fee. This never affects where they rank or what you pay. Learn more
Submit a correction

Kansas City Nursing Home Facilities Overview

  • Avg payroll costs: $3,495,713.59 (Kansas avg: $2,997,742.47)
  • Avg home costs: $5,353,603.59 (Kansas avg: $3,854,715.62)
  • Avg occupancy: 84.49% (Kansas avg: 80.95%)
  • Avg bed count: 114 (Kansas avg: 70)
  • Avg home revenue: $8,177,560.09 (Kansas avg: $6,702,638.72)

Community-level financial and occupancy data

  • NORTHLAND REHABILITATION AND HEALTH: 82.03% occupancy, 120 beds, $14,685,666.00 home revenue, $4,112,839.00 payroll costs, $6,891,120.00 home costs.
  • NEW MARK CARE CENTER: 51.16% occupancy, 199 beds, $8,626,365.00 home revenue, $4,534,740.00 payroll costs, $6,583,405.00 home costs.
  • BISHOP SPENCER PLACE: 85.09% occupancy, 57 beds, $15,906,129.00 home revenue, $7,644,537.00 payroll costs, $12,092,649.00 home costs.
  • HIGHLAND REHAB & HEALTH CARE CENTER: 82.35% occupancy, 162 beds, $11,400,663.00 home revenue, $3,948,999.00 payroll costs, $6,792,678.00 home costs.
  • POLARIS HEALTH & WELLNESS OF BLUE RI: 86.19% occupancy, 160 beds, $8,668,026.00 home revenue, $4,479,777.00 payroll costs, $4,674,893.00 home costs.
  • SEASONS REHAB AND HEALTHCARE CENTER: 96.15% occupancy, 78 beds, $1,256,344.00 home revenue, $516,008.00 payroll costs, $663,326.00 home costs.
  • REDWOOD OF BLUE RIVER: 86.19% occupancy, 160 beds, $1,008,366.00 home revenue, $339,554.00 payroll costs, $486,335.00 home costs.
  • PARKVIEW HEALTHCARE: 86.17% occupancy, 120 beds, $1,497,536.00 home revenue, $599,585.00 payroll costs, $1,585,201.00 home costs.
  • BRIDGEWOOD HEALTH CARE CENTER: 97.65% occupancy, 166 beds, $11,227,021.00 home revenue, $3,815,100.00 payroll costs, $6,649,112.00 home costs.
View Chart Data Table
MetricKansas CityKansas
Avg payroll costs$3,495,713.59$2,997,742.47
Avg home costs$5,353,603.59$3,854,715.62
Avg occupancy84.49%80.95%
Avg bed count11470
Avg home revenue$8,177,560.09$6,702,638.72
CommunityOccupancyBedsHome RevenuePayroll CostsHome CostsMedicareMedicaidPrivate Pay
NORTHLAND REHABILITATION AND HEALTH82.03%120$14,685,666.00$4,112,839.00$6,891,120.0019.22%53.26%27.52%
NEW MARK CARE CENTER51.16%199$8,626,365.00$4,534,740.00$6,583,405.001.17%69.91%28.92%
BISHOP SPENCER PLACE85.09%57$15,906,129.00$7,644,537.00$12,092,649.0028.73%16.55%54.72%
HIGHLAND REHAB & HEALTH CARE CENTER82.35%162$11,400,663.00$3,948,999.00$6,792,678.001.48%88.44%10.08%
POLARIS HEALTH & WELLNESS OF BLUE RI86.19%160$8,668,026.00$4,479,777.00$4,674,893.005.00%80.89%14.11%
SEASONS REHAB AND HEALTHCARE CENTER96.15%78$1,256,344.00$516,008.00$663,326.009.36%76.18%14.46%
REDWOOD OF BLUE RIVER86.19%160$1,008,366.00$339,554.00$486,335.0011.23%66.76%22.01%
PARKVIEW HEALTHCARE86.17%120$1,497,536.00$599,585.00$1,585,201.003.31%86.70%9.99%
BRIDGEWOOD HEALTH CARE CENTER97.65%166$11,227,021.00$3,815,100.00$6,649,112.001.08%95.32%3.60%
Who we are

Your Senior Care Partner, Every Step of the Way

We help families find affordable senior communities and unlock same day discounts, Medicaid, and Medicare options tailored to your needs.

Contact us Today

Frequently Asked Questions about Nursing Homes in Kansas City, KS

What's the difference between assisted living and a nursing home in Kansas?

Assisted living in Kansas is a residential model focused on housing, hospitality, and help with daily activities. Nursing homes (skilled nursing facilities) provide 24/7 medical care from licensed nurses for residents with significant health needs, and are regulated more strictly under both state and federal CMS rules.

Does Kansas Medicaid cover nursing home care?

Yes — Kansas Medicaid covers nursing home care for residents who meet income, asset, and medical-need eligibility requirements. Most CMS-certified nursing homes accept Medicaid as a primary payer once long-term-care eligibility is established.

What is nursing home care?

Nursing homes (also called skilled nursing facilities) provide 24/7 medical care from licensed nurses, rehabilitation services, and long-term custodial care for residents with significant health or functional needs.

How many nursing homes are listed on this page?

This page features 3 nursing homes in Kansas City, KS. Use the filters and comparison tools above to compare ratings, amenities, and pricing.

How do I choose the right nursing home in Kansas City, KS?

Start by matching the level of care offered to the resident's current and anticipated needs, then compare licensing status, staff-to-resident ratios, recent inspection results, and pricing. Tour at least two or three communities in Kansas City, KS, talk to current residents and families, and confirm what is included in the base rate versus billed as add-on services.

What should I look for when visiting nursing homes in Kansas City, KS?

Pay attention to staff interactions with residents, cleanliness and odor, food quality at meal times, the activity calendar, and how questions about pricing and care plans are answered. Ask to see the most recent state inspection report, the move-out / level-of-care-change policy, and a sample monthly bill that lists every fee.