Kansas City Transitional Care
Nursing Home · Kansas City, KS
CMS overall rating Info The Overall CMS Rating is scored from 1 to 5 stars and combines results from health inspections, staffing levels, and quality measures. Health inspections carry the most weight. Staffing and quality scores can increase or decrease the final rating based on performance compared to state and national standards.

Kansas City Transitional Care

Nursing Home · Kansas City, KS
CMS overall rating Info The Overall CMS Rating is scored from 1 to 5 stars and combines results from health inspections, staffing levels, and quality measures. Health inspections carry the most weight. Staffing and quality scores can increase or decrease the final rating based on performance compared to state and national standards.
Calculator: See prices in your area
Kansas City Transitional Care accepts Medicare, Medicaid, and private pay.

Overview of Kansas City Transitional Care

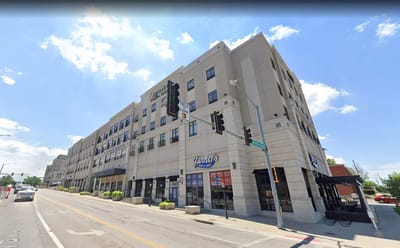
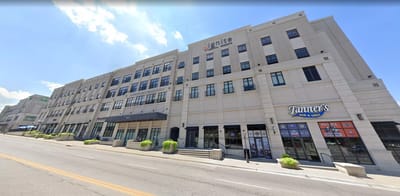
Located in the heart of Wyandotte County, Kansas City Transitional Care sets the standard for exceptional skilled nursing services. With an unwavering commitment to delivering top-notch care, this facility boasts a team of highly trained and experienced skilled nurses, therapists, and licensed care professionals. Renowned for its expertise and comprehensive approach, Kansas City Transitional Care excels in catering to a wide range of medical needs. 
From meticulous medication management to specialized oncology care, their dedicated staff ensures that every individual receives personalized attention and the highest level of support. With a focus on creating a nurturing and engaging environment, Kansas City Transitional Care goes above and beyond to empower residents on their path to wellness. Their compassionate approach and extensive knowledge enable them to provide holistic care that meets the unique needs of each resident. As a trusted destination for skilled nursing and transitional care, Kansas City Transitional Care embodies professionalism and a deep commitment to enhancing the lives of those they serve. 

(913) 901-8462

Quality ratings

Measured by Centers for Medicare & Medicaid Services (CMS)

Overall rating Info The Overall CMS Rating combines results from health inspections, staffing levels and quality measures. Health inspections carry the most weight. Staffing and quality scores can increase or decrease the final rating based on performance compared to state and national standards.
▼ 63.9% Below KS avg.
Health Inspection Info Based on the results of the facility's three most recent standard inspections and any complaint investigations. CMS reviews the number, scope, and severity of deficiencies, with more recent findings weighted more heavily.
▼ 24.8% Below KS avg.
Staffing Info Measures average nursing staff hours per resident per day, including Registered Nurses (RNs) and total nursing staff. Ratings are adjusted based on the level of care residents require and are compared to state and national benchmarks.
▼ 72.3% Below KS avg.
Quality Measures Info Based on clinical and physical health indicators reported to CMS, such as hospital readmissions, falls, pressure ulcers, and improvements in mobility. These measures reflect how well residents' health needs are being managed.
▲ 24.6% Above KS avg.

Staffing hours breakdown

Info Daily nursing hours per resident by staff type, reported to CMS. Higher is generally better — compare this facility to state and national averages to see where staffing stands.

Hours per resident per day — compared to Kansas state averages

Total nursing care / resident Info This home is ranked 126th out of 133 homes in Kansas.

Total adjusted nursing hours per resident per day, combining RN, LPN, and aide time. CMS adjusts this for case-mix so facilities can be fairly compared.
3h 5m per day
Rank #126 / 133Nurse hours — state benchmarkedThis home is ranked 126th out of 133 homes in Kansas.Shows adjusted nurse hours per resident per day benchmarked to the Kansas average, with a ranking across 133 Kansas SNFs. More hours mean more direct care. The national average is about 3.5 hrs; below 3.0 is a red flag.
This facility Kansas avg (4h 43m per day)
vs Kansas avg
-35%

4 of 6 metrics below state avg

Standout metric Physical Therapist is +100% above state avg
Staff typeHours / dayvs state avg
Registered Nurse (RN) Info RNs hold the highest nursing license and can assess residents, interpret test results, and direct care plans. More RN hours per day often signals stronger clinical oversight and faster response to health changes. 21m per day ▼ 51% State avg: 43m per day · National avg: 41m per day
LPN / LVN Info Licensed Practical Nurses (LPNs) or Licensed Vocational Nurses (LVNs) deliver routine hands-on care — medication administration, wound dressing, and monitoring vital signs. They work under RN supervision and make up a large share of daily bedside care. 1h 9m per day ▲ 72% State avg: 40m per day · National avg: 52m per day
Nurse Aide Info Certified Nurse Aides (CNAs) provide the most direct day-to-day assistance: bathing, dressing, feeding, and mobility. Nurse aide hours are typically the largest staffing category and directly affect residents' quality of life. 1h 50m per day ▼ 32% State avg: 2h 42m per day · National avg: 2h 21m per day
Total Nursing (Weekend) Info Combined nursing hours (RN + LPN + Nurse Aide) per resident per day on weekends. Staffing often drops on weekends — this figure reveals whether the facility maintains adequate coverage outside of weekday hours. 3h 1m per day ▼ 16% State avg: 3h 35m per day · National avg: 3h 26m per day
Physical Therapist Info Hours per resident per day provided by licensed Physical Therapists (PTs) or PT Assistants. PT services help residents recover mobility after injury or illness and are especially important for post-acute (short-stay) rehabilitation. 4m per day ▲ 100% State avg: 2m per day · National avg: 4m per day
RN (Weekend) Info Registered nurse hours specifically on weekends. Facilities sometimes reduce RN presence on Saturdays and Sundays — a low weekend RN figure compared to weekday hours can indicate reduced clinical oversight when most administrative staff are absent. 14m per day ▼ 52% State avg: 29m per day · National avg: 29m per day

Capacity and availability

This home is often near full

Occupancy higher than 95% suggests steady demand, but availability may be limited.

Higher occupancy than the Kansas average: 79.5%
Occupancy rate 97.9% Rank #30 / 137Occupancy rate — state benchmarkedThis home is ranked 30th out of 137 homes in Kansas.Shows this facility's occupancy rate versus the Kansas average, with its statewide rank out of 137. Higher occupancy signals strong local demand and financial stability.
Avg. Length of Stay 68 days
Occupancy rate
97.9% Rank #30 / 137Occupancy rate — state benchmarkedThis home is ranked 30th out of 137 homes in Kansas.Shows this facility's occupancy rate versus the Kansas average, with its statewide rank out of 137. Higher occupancy signals strong local demand and financial stability.
Avg. Length of Stay
68 days

Who this home usually serves

TYPE OF STAY

Primarily short stays

Residents typically stay for brief periods, with frequent admissions and discharges throughout the year.

Breakdown by payment type

Medicare

26% of new residents, usually for short-term rehab.

Typical stay 28 days

Private pay

73% of new residents, often for short stays.

Typical stay 19 days

Medicaid

1% of new residents, often for long-term daily care.

Typical stay 8 - 9 years

Finances and operations

Privately-owned community
Home revenue
$14.1M
Operating loss
-$830.6K
Privately-owned community
Home revenue
$14.1M Rank #21 / 134Revenue — state benchmarkedThis home is ranked 21st out of 134 homes in Kansas.Shows this facility's annual revenue compared to the Kansas SNF average. Higher revenue generally means more resources for staffing and capital — read alongside Payroll %.
Operating loss
-$830.6K
Payroll costs Info The portion of the home's budget spent on staff, including nurses, caregivers, and other employees who support care and operations. Rank #42 / 134Payroll — state benchmarkedThis home is ranked 42nd out of 134 homes in Kansas.Shows total annual staff payroll benchmarked to the Kansas average. Higher payroll investment relative to peers often signals better staffing and less reliance on cheaper contract labor.
$5.8M
40.8% of revenue Rank #127 / 134Payroll % — state benchmarkedThis home is ranked 127th out of 134 homes in Kansas.Shows payroll as a percentage of revenue versus the Kansas average. Well-run SNFs often land around 55–65%. Below 25% may signal understaffing or heavy agency use — read with Staffing ratings.
Other operating costs Info All remaining costs needed to run the home, such as food, utilities, building maintenance, supplies and administrative expenses.
$9.2M
Total costs $14.9M
Walk Score
Walk Score: 79 / 100 Rank #11 / 135Walk Score — state benchmarkedThis home is ranked 11th out of 135 homes in Kansas.Shows how walkable this facility's neighborhood is compared to the average Walk Score across Kansas SNFs. Higher scores benefit residents, families, and staff.
Very walkable. Most errands can be accomplished on foot, and many essentials are within a short walk.

Types of Care at Kansas City Transitional Care

Nursing Home

Contact Kansas City Transitional Care

Inspection History

In Kansas, the Department for Aging and Disability Services, Survey and Certification Commission performs the unannounced inspections required for facility licensing and federal certification.

Since 2021 · 5 years of data 44 deficiencies

Inspection Scorecard Info This scorecard compares key inspection, citation, and complaint metrics at this facility against the Kansas state average. Metrics rated ≥15% worse than average are highlighted in red; those ≥15% better are highlighted in green.

Since 2021 vs. Kansas state average
Overall vs. KS average 0 Worse No metrics in this bucket. 2 Better Metrics better than Kansas average:
• Total deficiencies (56% below)
• Deficiencies per year (56% below)
Latest Inspection March 19, 2025 Complaint Investigation

Deficiencies Info Deficiencies are formal regulatory issues recorded during state inspections.

MetricThis FacilityKS Averagevs. KS Avg
Total deficiencies Info Formal regulatory issues recorded by inspectors across all inspection types. 44100 This facility has 56% fewer total deficiencies than a typical Kansas nursing home (44 vs. KS avg 100).↓ 56% better
Deficiencies per year Info Average deficiencies per year since 2021. 8.820 This facility has 56% fewer deficiencies per year than a typical Kansas nursing home (8.8 vs. KS avg 20).↓ 56% better

Inspection Reports Summary Info An editor-reviewed summary of the themes and findings across this facility's recent inspection reports.

The most recent inspection on March 19, 2025, identified deficiencies related to delayed identification and prevention of a stage 3 pressure ulcer in a dependent resident. Earlier inspections showed a pattern of issues including resident safety lapses such as falls, incomplete care plans especially for dialysis, infection control shortcomings, medication management errors, and inadequate staff training. Complaint investigations substantiated failures in timely physician follow-up and nursing care competency, while routine surveys noted environmental and behavioral health concerns. Enforcement actions such as fines or license suspensions were not listed in the available reports. The facility’s inspection history reflects ongoing challenges with resident care and safety, with some corrective actions taken but no clear sustained improvement trend.

Read the full inspection reports for this facility, including detailed findings and corrective actions.

Show Inspection Reports

Health Inspection History

Inspections
Total health inspections 8

Kansas average 4.5


Last Health inspection on Mar 2025

Total health citations
42 Rank #110 / 135Health citations — state benchmarkedThis home is ranked 110th out of 135 homes in Kansas.Shows this facility's total health deficiency citations benchmarked to the Kansas state average, with a ranking across all 135 KS SNFs. Lower citation counts earn a better rank.

Kansas average 26.9

Citations per inspection
5.25 Rank #54 / 135Citations per inspection — state benchmarkedThis home is ranked 54th out of 135 homes in Kansas.Shows average deficiency citations per CMS inspection for this facility versus the Kansas mean across 135 SNFs with citation data. Lower is better.

Kansas average 6.07


Health citations are formal notices following inspections when they fail to comply with safety and care standards.

10 of 42 citations resulted from standard inspections; 9 of 42 resulted from complaint investigations; and 23 of 42 came from combined inspections (standard and complaint).

Breakdown of citation severity (last 5 years)
Critical Health citations More info
0
100% better than Kansas average

Kansas average: 0.9


Serious Health citations More info 1
11% worse than Kansas average

Kansas average: 0.9

0 critical citations More info Kansas average: 0.9

1 serious citation More info Kansas average: 0.9

41 moderate citations More info Kansas average: 24.6

0 minor citations More info Kansas average: 0.5
Citations history (last 5 years)
Quality of Care serious citation Info Issues related to how well residents receive appropriate treatment and support for their medical and daily care needs. Mar 19, 2025
Corrected

Quality of Care moderate citation Info Issues related to how well residents receive appropriate treatment and support for their medical and daily care needs. Dec 02, 2024
Corrected

Abuse/Neglect moderate citation Info Issues related to protecting resident's from harm, including abuse, neglect, or mistreatment. Aug 22, 2024
Corrected

Infection Control moderate citation Info Issues related to preventing and controlling infections, including hygiene practices and safety protocols. Aug 22, 2024
Corrected

Financial Assistance for
Nursing Home in Kansas

Kansas City Transitional Care is located in Kansas City, Kansas.
Here are the financial assistance programs available to residents in Kansas.

Get Financial aid guidance

Frail Elderly Waiver

Kansas Medicaid FE Waiver

Age 65+
General Kansas resident, Medicaid-eligible, nursing home- level care need.
Income Limits (2025) ~$2,829/month 300% FBR, individual
Asset Limits $2,000 (individual), $3,000 (couple).
KS

Requires care level assessment.

Benefits
Personal care (5-7 hours/day) Respite (240 hours/year) Adult day care (~$60/day) Home aides

Senior Care Act

Kansas SCA

Age 60+
General Kansas resident, at risk of nursing home.
Income Limits ~$1,800/month individual, varies
Asset Limits $2,000 individual
KS

Limited funding; waitlists common.

Benefits
In-home care (3-5 hours/week) Respite (up to 10 days/year) Homemaker services

Medicare Savings Program (MSP)

Kansas Medicare Savings Program

Age 65+ or disabled
General Kansas resident, Medicare Part A/B.
Income Limits (2025) ~$2,510/month (QMB), ~$3,380/month (SLMB), ~$3,598/month (QI)—individual.
Asset Limits $9,430 (individual), $14,130 (couple).
KS

Three tiers; no waitlist.

Benefits
Covers Part B premiums ($174.70/month) Deductibles ($240/year) Copays (~20%)

National Family Caregiver Support Program (NFCSP) Respite

Kansas NFCSP Respite Care

Age
General Caregivers of 60+ needing care or 55+ caregivers of others; Kansas resident; functional needs (2+ ADLs).
Income Limits (2025) Prioritizes ~$24,980/year (individual); no strict cap.
Asset Limits Not assessed; need-based.
KS

11 AAAs; prioritizes low-income, rural caregivers.

Benefits
Respite (4-6 hours/week or 5 days/year) Adult day care ($60/day) Caregiver training

VA Aid and Attendance (A&A) and Housebound Benefits

Kansas VA Aid and Attendance/Housebound

Age 65+ or disabled veteran/spouse
General Kansas resident, wartime service, need for ADL help (A&A) or homebound.
Income Limits (2025) Net income < ~$1,984/month (veteran with dependent, A&A); pension offsets income.
Asset Limits ~$155,356 net worth limit
KS

High veteran demand in rural/urban areas.

Benefits
Cash (~$1,433-$2,642/month veteran, ~$951-$1,318 spouse) for care costs (e.g., in-home, assisted living)

Places of interest near Kansas City Transitional Care

Address 4.4 miles from city center Info Estimated distance in miles from Kansas City's city center to Kansas City Transitional Care's address, calculated via Google Maps. — 0.12 miles to nearest hospital (The University of Kansas Hospital : Psychiatry Department KUMC)

Calculate Travel Distance to Kansas City Transitional Care

Add your location

Address

Staffing Data (Q2 2025)

This data corresponds to Q2 2025 and is based on CMS Payroll-Based Journal.

Total staff 155
Employees 153
Contractors 2
Staff to resident ratio 1.67:1
26% worse than Kansas average

Kansas average ratio: 2.27:1

Avg staff/day 41
Average shift 8.6 hours
12% better than Kansas average

Kansas average: 7.7 hours

Total staff hours (quarter) 32,154

Nursing staff breakdown

Registered Nurse

Manages medical care and health needs.

Total count 14
Average shift length Info Average shift length. Calculated as total hours divided by days worked and average staff per day. 9.5 hours

This role is partially covered by contractors.

Licensed Practical Nurse

Assists with medical care and medications.

Total count 37
Average shift length Info Average shift length. Calculated as total hours divided by days worked and average staff per day. 9.4 hours

No contractors work on this role.

Certified Nursing Assistant

Helps with daily care and mobility.

Total count 68
Average shift length Info Average shift length. Calculated as total hours divided by days worked and average staff per day. 8.9 hours

No contractors work on this role.

Contractor staffing

Total hours from contractors

1.3%

428 contractor hours this quarter

Registered Nurse: 2

Staff by category

Certified Nursing Assistant6806814,08591100%8.9
Licensed Practical Nurse370376,79491100%9.4
Registered Nurse122142,5928998%9.5
Medication Aide/Technician7071,8408593%10.2
RN Director of Nursing4041,4246571%8
Speech Language Pathologist5051,1766976%7.1
Dental Services Staff2028086470%8
Physical Therapy Assistant3035817481%5
Administrator1015206571%8
Other Dietary Services Staff1015126470%8
Clinical Nurse Specialist2024886167%8
Physical Therapy Aide1014596571%7.1
Respiratory Therapy Technician8084426976%4.8
Qualified Social Worker1012654954%5.4
Nurse Practitioner1011682123%8
68 Certified Nursing Assistant
% of Days 100%
37 Licensed Practical Nurse
% of Days 100%
14 Registered Nurse
% of Days 98%
7 Medication Aide/Technician
% of Days 93%
4 RN Director of Nursing
% of Days 71%
5 Speech Language Pathologist
% of Days 76%
2 Dental Services Staff
% of Days 70%
3 Physical Therapy Assistant
% of Days 81%
1 Administrator
% of Days 71%
1 Other Dietary Services Staff
% of Days 70%
2 Clinical Nurse Specialist
% of Days 67%
1 Physical Therapy Aide
% of Days 71%
8 Respiratory Therapy Technician
% of Days 76%
1 Qualified Social Worker
% of Days 54%
1 Nurse Practitioner
% of Days 23%

Facility Characteristics

Source: CMS Long-Term Care Facility Characteristics (Data as of Jan 2026)

Total residents 93
Medicare
29
31.2% of residents
Medicaid
64
68.8% of residents
Programs & Services
Residents Group

Residents meet regularly to discuss policies, care quality, and activities

Active Resident Council

Organized group of residents that meets regularly to discuss facility policies, quality of life, and activities.

Quality of care over time

These measures show how residents usually do over time at this home, based on health outcomes and preventive care.

High-risk clinical events score Info A composite score based on pressure ulcers, falls with injury, weight loss, walking ability decline, and activities of daily living decline. 9.7
8% better than Kansas average

Kansas average: 10.5

Functional decline score Info A composite score based on activities of daily living decline, walking ability decline, and incontinence. 22.5
9% worse than Kansas average

Kansas average: 20.7

Long-stay resident measures
Above average Kansas avg: 3.0 Info CMS star rating based on long-stay quality measure performance. 5 stars = significantly above average, 1 star = significantly below average.
Need for Help with Daily Activities Increased Info Percent of long-stay residents whose need for help with daily activities has increased 17.5%
8% better than Kansas average

Kansas average: 19.0%

Walking Ability Worsened Info Percent of long-stay residents whose ability to move independently worsened 19.4%
In line with Kansas average

Kansas average: 19.4%

Low Risk Residents with Bowel/Bladder Incontinence Info Percent of low risk long-stay residents who lose control of their bowels or bladder 30.6%
29% worse than Kansas average

Kansas average: 23.8%

Falls with Major Injury Info Percent of long-stay residents experiencing one or more falls with major injury 1.5%
65% better than Kansas average

Kansas average: 4.4%

High Risk Residents with Pressure Ulcers Info Percent of long-stay high risk residents with pressure ulcers 7.7%
66% worse than Kansas average

Kansas average: 4.6%

Urinary Tract Infection Info Percent of long-stay residents with a urinary tract infection 2.3%
25% better than Kansas average

Kansas average: 3.1%

Lost Too Much Weight Info Percent of long-stay residents who lose too much weight 2.3%
56% better than Kansas average

Kansas average: 5.1%

Depressive Symptoms Info Percent of long-stay residents who have depressive symptoms 15.1%
193% worse than Kansas average

Kansas average: 5.2%

Antipsychotic Use Info Percent of long-stay residents who received an antipsychotic medication 1.7%
90% better than Kansas average

Kansas average: 16.9%

Pneumococcal Vaccine Info Percent of long-stay residents assessed and appropriately given the pneumococcal vaccine 89.2%
In line with Kansas average

Kansas average: 91.9%

Influenza Vaccine Info Percent of long-stay residents assessed and appropriately given the seasonal influenza vaccine 91.0%
5% worse than Kansas average

Kansas average: 95.5%

Short-stay resident measures
Significantly above average Kansas avg: 2.6 Info CMS star rating based on short-stay quality measure performance. 5 stars = much above average, 1 star = much below average.
Pneumococcal Vaccine Info Percent of short-stay residents assessed and appropriately given the pneumococcal vaccine 65.7%
13% worse than Kansas average

Kansas average: 75.6%

Antipsychotic medication increase Info Percent of short-stay residents who newly received an antipsychotic medication 0.3%
85% better than Kansas average

Kansas average: 2.2%

Influenza Vaccine Info Percent of short-stay residents assessed and appropriately given the seasonal influenza vaccine 32.7%
56% worse than Kansas average

Kansas average: 73.5%

Re-hospitalized after SNF stay Info Percentage of short-stay residents who were re-hospitalized after their nursing home admission. 23.5%
In line with Kansas average

Kansas average: 23.0%

Emergency department visits Info Percentage of short-stay residents who had an outpatient emergency department visit. 5.1%
56% better than Kansas average

Kansas average: 11.7%

Falls with major injury Info Percentage of SNF residents who experience falls with major injury during their stay. 1.7%
118% worse than Kansas average

Kansas average: 0.8%

Ability to care for self at discharge Info Percentage of residents at or above expected ability to care for themselves at discharge. 77.1%
44% better than Kansas average

Kansas average: 53.7%

Successful return to home or community Info Rate of successful return to home or community from a skilled nursing facility. 61.3%
21% better than Kansas average

Kansas average: 50.6%

Penalties and fines

Federal penalties imposed by CMS for regulatory violations, including civil money penalties (fines) and denials of payment for new Medicare/Medicaid admissions.

Source: CMS Penalties Database (Data as of Jan 2026)

Total fines amount $15K
66% lower than Kansas average

Kansas average: $44K

Number of fines 1
59% fewer fines than Kansas average

Kansas average: 2.4

Payment Denials Info Serious action where Medicare and/or Medicaid temporarily stops payments for new residents until issues are fixed. 0
100% fewer payment denials than Kansas average

Kansas average: 0.3

Fines amount comparison
This facility $15K
Kansas average $44K

No penalties in the past 3 years

No civil money penalties or payment denials were reported in the last 3 years.

Compare Nursing Home around Kansas City

The information below is reported by the Kansas Department for Aging and Disability Services.

3 facilities compared · CMS & KS Dept. of Health data · Updated May 2026

Filter by care type
The Healthcare Resort of Kansas City
NH

Nursing Home Licensed facility providing 24/7 skilled nursing care for residents with complex, ongoing medical needs. Staffed by RNs, LPNs, and CNAs. Inspected and star-rated annually by CMS. Accepts Medicare (short-term rehab) and Medicaid (long-term care).

AL

Assisted Living A licensed, long-term care setting for seniors or individuals with disabilities who need help with daily activities — like bathing, dressing, and medication management — but not 24-hour skilled nursing. Offers housing, meals, and around-the-clock support while aiming to maximize resident independence.

Kansas City (Victory Hills)105 74.1% -7%5.05 -55%+9%1459.0359 11 Ryan Leiker$11.3M$5.0M43.9%175548
Kansas City Transitional Care
NH

Nursing Home Licensed facility providing 24/7 skilled nursing care for residents with complex, ongoing medical needs. Staffed by RNs, LPNs, and CNAs. Inspected and star-rated annually by CMS. Accepts Medicare (short-term rehab) and Medicaid (long-term care).

Kansas City (Rosedale)96 88.3% +11%3.08 -11%-34%1425.3190 79 Ignite Kumed Jv LLC$14.1M$4.3M30.6%175544
Riverbend Post Acute Rehabilitation -
NH

Nursing Home Licensed facility providing 24/7 skilled nursing care for residents with complex, ongoing medical needs. Staffed by RNs, LPNs, and CNAs. Inspected and star-rated annually by CMS. Accepts Medicare (short-term rehab) and Medicaid (long-term care).

Kansas City (Victory Hills)127 89.5% +13%3.83----18%-17%2335.51117 57 Cory Schulte$15.0M$6.9M45.9%175298

Guides for Better Senior Living

Care Cost Calculator: See Prices in Your Area

Nursing Home Data Explorer

Don’t Wait Too Long: 7 Red Flag Signs Your Parent Needs Assisted Living Now

The True Cost of Assisted Living in 2025 – And How Families Are Paying For It

Understanding Senior Living Costs: Pricing Models, Discounts & Financial Assistance

Frequently Asked Questions about Kansas City Transitional Care

What neighborhood is Kansas City Transitional Care in?

Kansas City Transitional Care is in the Rosedale neighborhood of Kansas City.

Is Kansas City Transitional Care in a walkable area?

Kansas City Transitional Care has a walk score of 79. Very walkable. Most errands can be accomplished on foot, and many essentials are within a short walk.

What is the phone number of Kansas City Transitional Care?

(913) 901-8462 will put you in contact with the team at Kansas City Transitional Care.

Is Kansas City Transitional Care Medicare or Medicaid certified?

Yes — Kansas City Transitional Care is a CMS-certified provider of Medicare and Medicaid.

Explore Open Rooms
1 Contact details
2 What type of senior care service are you looking for?
3 What budget do you have in mind for senior care?
4 How soon do you need to find care?
5 Additional details

Thank you for your interest!

Our team will be in touch shortly to help with next steps.