Best Senior Living in Silver Spring, MD

Why trust this guide? Our editorial team analyzed 55 senior living communities in Silver Spring, MD using MD Dept. of Health (OHCQ) data, inspection records, complaints, amenities, and facility-level details. How we rank senior living in MD
Reviewed by
Last updated
We analyzed These are the facilities in Silver Spring, MD our team has analyzed — not a count of every senior living provider in Silver Spring, MD.
55 homes
Other senior care options in Silver Spring:

Compare Senior Living around Silver Spring

Info below is compiled from the MD Dept. of Health (OHCQ), senior community websites & trusted data sources such as Walk Score & BBB.

Communities are listed from highest-ranked to lowest-ranked based on our methodology.

Care Types in This Table AL (Assisted Living): Housing with help for daily activities like bathing, dressing, and medication, without 24-hour skilled nursing. NH (Nursing Home): 24/7 skilled nursing care for residents with complex, ongoing medical needs. SNF (Skilled Nursing Facility): Round-the-clock nursing care, often for recovery after surgery, injury, or illness. MC (Memory Care): Secured, specialized care for people living with Alzheimer's or dementia. RC (Respite Care): Short-term temporary care that gives family caregivers a break. RESC (Residential Care): Personal care and daily-living support in a smaller, more intimate residential setting. IL (Independent Living): Community living with dining, activities, and transportation for active seniors who need little personal care. HOS (Hospice Care): Comfort-focused care for those with a terminal illness, prioritizing quality of life over treatment. PC (Palliative Care): Comfort-focused care for serious illness at any stage, including alongside curative treatment. CCRC (Continuing Care Retirement Community): A campus with multiple care levels so residents can age in place without moving.
City and state of the facility. Used for mapping and state-average comparisons.
Licensed bed capacity (maximum allowed). Not the same as how many beds are currently filled.
Indicates whether residents are allowed to have pets in the facility.
Third-party neighborhood walkability score (0–100). Convenience/context metric, not a healthcare quality measure.
Description of bed or unit types offered (e.g. assisted living, memory care), as reported in state or facility disclosures.
Number of years the company has been in operation.
Better Business Bureau grade for the operating company. Reflects complaint handling and business practices, not clinical care quality.
Percentage of residents reported as male in state demographics, shown as a whole-number percent.
Percentage of residents reported as female in state demographics, shown as a whole-number percent.
Share of residents reported as White in the state-published race/ethnicity breakdown for this facility, shown as a whole-number percent. Parsed from the same source as the profile demographics section.
Share of residents reported as African American or Black in the state breakdown, shown as a whole-number percent. Labels in the raw data are normalized to this bucket for compare.
Combined share of all race/ethnicity groups that are not classified as White or African American (e.g. Hispanic, Asian, multiracial, and other labeled categories), summed to a single whole-number percent.
Share of residents aged 65–74 in reported demographics, as a whole-number percentage of residents.
Share of residents aged 75–84 in reported demographics, as a whole-number percentage of residents.
Share of residents aged 85–94 in reported demographics, as a whole-number percentage of residents.
Share of residents aged 95 or older in reported demographics, as a whole-number percentage of residents.
Complete Care at Springbrook
IL
HOS
NH
PC
RC
SNF
Silver Spring
93
Facility 93
MD AVG 86
Rank #89 / 142
No
36
Facility 36
MD AVG 49
Rank #107 / 161
-
3
Facility 3
MD AVG 24
Rank #42 / 42
A+---------
Bel Pre Healthcare Center
IL
NH
Silver Spring
100
Facility 100
MD AVG 86
Rank #76 / 142
No
52
Facility 52
MD AVG 49
Rank #67 / 161
Private / Semi-Private Rooms
42
Facility 42
MD AVG 24
Rank #2 / 42
F---------
Bedford Court
IL
AL
HOS
MC
NH
RC
SNF
Silver Spring
76
Facility 76
MD AVG 86
Rank #40 / 74
Yes
66
Facility 66
MD AVG 49
Rank #48 / 169
Studio / 1 Bed / 2 Bed
34
Facility 34
MD AVG 24
Rank #9 / 45
-
15%

Male Residents — State Benchmarked 15% of residents are male, compared to the Maryland average of 31%. This facility caters to a majority female resident pool (85% female), consistent with the broader assisted living trend where women significantly outnumber men.

85%

Female Residents — State Benchmarked 85% of residents are female, compared to the Maryland average of 69%. Women comprise the large majority, consistent with national assisted living demographics where women live longer and enter care facilities at higher rates.

95%

White Residents — State Benchmarked 95% of residents are reported as White, compared to the Maryland average of 81%. A higher White share than is typical for assisted living in Maryland in this dataset — compare with peer facilities for local context.

3%

African American Residents — State Benchmarked 3% of residents are reported as African American or Black, compared to the Maryland average of 13%. A lower African American share than is typical in Maryland; local markets still vary widely.

2%

Other Ethnicity Residents — State Benchmarked 2% of residents fall into categories other than White or African American (combined), compared to the Maryland average of 6%. This column aggregates Hispanic, Asian, multiracial, and any other labeled groups that are not classified as White or African American. Reported subgroups in this total: Asian (2%).

2%

Residents Age 65–74 — State Benchmarked 2% of residents are 65–74, compared to the Maryland average of 13%. Fewer younger seniors suggests the resident population skews older, likely requiring higher acuity care and more hands-on support.

8%

Residents Age 75–84 — State Benchmarked 8% of residents are 75–84, compared to the Maryland average of 31%. Below the state norm — the resident mix may skew either younger or older than this typical middle bracket.

65%

Residents Age 85–94 — State Benchmarked 65% of residents are 85–94, compared to the Maryland average of 44%. A high concentration of very elderly residents signals a higher-acuity facility with experience caring for advanced age-related needs.

26%

Residents Age 95+ — State Benchmarked 26% of residents are 95 or older, compared to the Maryland average of 16%. A high proportion of the oldest-old suggests strong end-of-life care experience and very-high-acuity capabilities.

Riderwood Village
IL
AL
CCRC
MC
Silver Spring
275
Facility 275
MD AVG 86
Rank #2 / 74
Yes
33
Facility 33
MD AVG 49
Rank #118 / 169
-
23
Facility 23
MD AVG 24
Rank #25 / 45
-
29%

Male Residents — State Benchmarked 29% of residents are male, compared to the Maryland average of 31%. This facility caters to a majority female resident pool (71% female), consistent with the broader assisted living trend where women significantly outnumber men.

71%

Female Residents — State Benchmarked 71% of residents are female, compared to the Maryland average of 69%. Women comprise the large majority, consistent with national assisted living demographics where women live longer and enter care facilities at higher rates.

89%

White Residents — State Benchmarked 89% of residents are reported as White, compared to the Maryland average of 81%. Close to the average for this category among assisted living facilities in Maryland with reported race/ethnicity data.

7%

African American Residents — State Benchmarked 7% of residents are reported as African American or Black, compared to the Maryland average of 13%. In line with the Maryland average for African American residents among facilities reporting this breakdown.

4%

Other Ethnicity Residents — State Benchmarked 4% of residents fall into categories other than White or African American (combined), compared to the Maryland average of 6%. This column aggregates Hispanic, Asian, multiracial, and any other labeled groups that are not classified as White or African American. Reported subgroups in this total: Asian (3%), Hispanic (0%).

2%

Residents Age 65–74 — State Benchmarked 2% of residents are 65–74, compared to the Maryland average of 13%. Fewer younger seniors suggests the resident population skews older, likely requiring higher acuity care and more hands-on support.

23%

Residents Age 75–84 — State Benchmarked 23% of residents are 75–84, compared to the Maryland average of 31%. Below the state norm — the resident mix may skew either younger or older than this typical middle bracket.

52%

Residents Age 85–94 — State Benchmarked 52% of residents are 85–94, compared to the Maryland average of 44%. A high concentration of very elderly residents signals a higher-acuity facility with experience caring for advanced age-related needs.

23%

Residents Age 95+ — State Benchmarked 23% of residents are 95 or older, compared to the Maryland average of 16%. A high proportion of the oldest-old suggests strong end-of-life care experience and very-high-acuity capabilities.

Caring Companions Inc
IL
AL
HOS
RESC
RC
Silver Spring
14No 34 Semi-Private / 1 Bed Studio40A+
58%

Male Residents — State Benchmarked 58% of residents are male, compared to the Maryland average of 31%. An unusually high male share for assisted living, where most facilities skew heavily female.

42%

Female Residents — State Benchmarked 42% of residents are female, compared to the Maryland average of 69%. An unusually low female share — most assisted living facilities have 65–75% female residents.

75%

White Residents — State Benchmarked 75% of residents are reported as White, compared to the Maryland average of 81%. Close to the average for this category among assisted living facilities in Maryland with reported race/ethnicity data.

17%

African American Residents — State Benchmarked 17% of residents are reported as African American or Black, compared to the Maryland average of 13%. In line with the Maryland average for African American residents among facilities reporting this breakdown.

8%

Other Ethnicity Residents — State Benchmarked 8% of residents fall into categories other than White or African American (combined), compared to the Maryland average of 6%. This column aggregates Hispanic, Asian, multiracial, and any other labeled groups that are not classified as White or African American. Reported subgroups in this total: Asian (8%).

58%

Residents Age 65–74 — State Benchmarked 58% of residents are 65–74, compared to the Maryland average of 13%. A higher share of younger seniors often signals a more independent, active resident community with lower acuity care needs.

17%

Residents Age 75–84 — State Benchmarked 17% of residents are 75–84, compared to the Maryland average of 31%. Below the state norm — the resident mix may skew either younger or older than this typical middle bracket.

17%

Residents Age 85–94 — State Benchmarked 17% of residents are 85–94, compared to the Maryland average of 44%. The population here skews younger than the statewide norm, which may indicate a more active, lower-acuity community.

8%

Residents Age 95+ — State Benchmarked 8% of residents are 95 or older, compared to the Maryland average of 16%. Most residents here have not yet reached the oldest-old bracket, suggesting a younger overall community.

Sunrise of Chevy Chase
IL
AL
MC
Silver Spring (Rock Creek Gardens)
196No 71 Studio / 1 Bed / 2 Bed8-
58%

Male Residents — State Benchmarked 58% of residents are male, compared to the Maryland average of 31%. An unusually high male share for assisted living, where most facilities skew heavily female.

42%

Female Residents — State Benchmarked 42% of residents are female, compared to the Maryland average of 69%. An unusually low female share — most assisted living facilities have 65–75% female residents.

69%

White Residents — State Benchmarked 69% of residents are reported as White, compared to the Maryland average of 81%. A lower White share than the Maryland average — the community may draw a more diverse resident mix relative to other facilities in Maryland.

28%

African American Residents — State Benchmarked 28% of residents are reported as African American or Black, compared to the Maryland average of 13%. A higher African American share than the typical Maryland average — useful context when comparing cultural fit and community composition.

3%

Other Ethnicity Residents — State Benchmarked 3% of residents fall into categories other than White or African American (combined), compared to the Maryland average of 6%. This column aggregates Hispanic, Asian, multiracial, and any other labeled groups that are not classified as White or African American. Reported subgroups in this total: Hispanic (2%), Asian (1%).

12%

Residents Age 65–74 — State Benchmarked 12% of residents are 65–74, compared to the Maryland average of 13%. In line with the statewide profile for this youngest senior bracket in assisted living.

39%

Residents Age 75–84 — State Benchmarked 39% of residents are 75–84, compared to the Maryland average of 31%. A high concentration in this mid-range bracket, where residents typically need moderate support with daily activities.

42%

Residents Age 85–94 — State Benchmarked 42% of residents are 85–94, compared to the Maryland average of 44%. This is typically the most common age bracket in assisted living — this facility is in line with the statewide norm.

6%

Residents Age 95+ — State Benchmarked 6% of residents are 95 or older, compared to the Maryland average of 16%. Most residents here have not yet reached the oldest-old bracket, suggesting a younger overall community.

Sunrise of Silver Spring
IL
AL
HOS
MC
RC
Silver Spring
84Yes 40 Studio / 1 Bed / 2 Bed24-
31%

Male Residents — State Benchmarked 31% of residents are male, compared to the Maryland average of 31%. This facility caters to a majority female resident pool (69% female), consistent with the broader assisted living trend where women significantly outnumber men.

69%

Female Residents — State Benchmarked 69% of residents are female, compared to the Maryland average of 69%. Women comprise the large majority, consistent with national assisted living demographics where women live longer and enter care facilities at higher rates.

53%

White Residents — State Benchmarked 53% of residents are reported as White, compared to the Maryland average of 81%. A lower White share than the Maryland average — the community may draw a more diverse resident mix relative to other facilities in Maryland.

39%

African American Residents — State Benchmarked 39% of residents are reported as African American or Black, compared to the Maryland average of 13%. A higher African American share than the typical Maryland average — useful context when comparing cultural fit and community composition.

9%

Other Ethnicity Residents — State Benchmarked 9% of residents fall into categories other than White or African American (combined), compared to the Maryland average of 6%. This column aggregates Hispanic, Asian, multiracial, and any other labeled groups that are not classified as White or African American. Reported subgroups in this total: Asian (4%), Hawaiian/Pacific Islander (3%), Hispanic (1%).

4%

Residents Age 65–74 — State Benchmarked 4% of residents are 65–74, compared to the Maryland average of 13%. Fewer younger seniors suggests the resident population skews older, likely requiring higher acuity care and more hands-on support.

43%

Residents Age 75–84 — State Benchmarked 43% of residents are 75–84, compared to the Maryland average of 31%. A high concentration in this mid-range bracket, where residents typically need moderate support with daily activities.

37%

Residents Age 85–94 — State Benchmarked 37% of residents are 85–94, compared to the Maryland average of 44%. The population here skews younger than the statewide norm, which may indicate a more active, lower-acuity community.

14%

Residents Age 95+ — State Benchmarked 14% of residents are 95 or older, compared to the Maryland average of 16%. In line with the statewide profile for the oldest resident bracket.

Grace House
IL
AL
HOS
PC
Silver Spring
32No 25 Studio / 1 Bed19-
29%

Male Residents — State Benchmarked 29% of residents are male, compared to the Maryland average of 31%. This facility caters to a majority female resident pool (71% female), consistent with the broader assisted living trend where women significantly outnumber men.

71%

Female Residents — State Benchmarked 71% of residents are female, compared to the Maryland average of 69%. Women comprise the large majority, consistent with national assisted living demographics where women live longer and enter care facilities at higher rates.

74%

White Residents — State Benchmarked 74% of residents are reported as White, compared to the Maryland average of 81%. Close to the average for this category among assisted living facilities in Maryland with reported race/ethnicity data.

23%

African American Residents — State Benchmarked 23% of residents are reported as African American or Black, compared to the Maryland average of 13%. A higher African American share than the typical Maryland average — useful context when comparing cultural fit and community composition.

3%

Other Ethnicity Residents — State Benchmarked 3% of residents fall into categories other than White or African American (combined), compared to the Maryland average of 6%. This column aggregates Hispanic, Asian, multiracial, and any other labeled groups that are not classified as White or African American. Reported subgroups in this total: Hispanic (3%).

6%

Residents Age 65–74 — State Benchmarked 6% of residents are 65–74, compared to the Maryland average of 13%. Fewer younger seniors suggests the resident population skews older, likely requiring higher acuity care and more hands-on support.

26%

Residents Age 75–84 — State Benchmarked 26% of residents are 75–84, compared to the Maryland average of 31%. Below the state norm — the resident mix may skew either younger or older than this typical middle bracket.

32%

Residents Age 85–94 — State Benchmarked 32% of residents are 85–94, compared to the Maryland average of 44%. The population here skews younger than the statewide norm, which may indicate a more active, lower-acuity community.

35%

Residents Age 95+ — State Benchmarked 35% of residents are 95 or older, compared to the Maryland average of 16%. A high proportion of the oldest-old suggests strong end-of-life care experience and very-high-acuity capabilities.

Seaton Silver Spring
IL
AL
Silver Spring
55
Facility 55
MD AVG 86
Rank #48 / 74
Yes
33
Facility 33
MD AVG 49
Rank #118 / 169
1 Bed / 2 Bed
36
Facility 36
MD AVG 24
Rank #5 / 45
-
15%

Male Residents — State Benchmarked 15% of residents are male, compared to the Maryland average of 31%. This facility caters to a majority female resident pool (85% female), consistent with the broader assisted living trend where women significantly outnumber men.

85%

Female Residents — State Benchmarked 85% of residents are female, compared to the Maryland average of 69%. Women comprise the large majority, consistent with national assisted living demographics where women live longer and enter care facilities at higher rates.

79%

White Residents — State Benchmarked 79% of residents are reported as White, compared to the Maryland average of 81%. Close to the average for this category among assisted living facilities in Maryland with reported race/ethnicity data.

21%

African American Residents — State Benchmarked 21% of residents are reported as African American or Black, compared to the Maryland average of 13%. A higher African American share than the typical Maryland average — useful context when comparing cultural fit and community composition.

0%

Other Ethnicity Residents — State Benchmarked 0% of residents fall into categories other than White or African American (combined), compared to the Maryland average of 6%. This column aggregates Hispanic, Asian, multiracial, and any other labeled groups that are not classified as White or African American.

9%

Residents Age 65–74 — State Benchmarked 9% of residents are 65–74, compared to the Maryland average of 13%. Fewer younger seniors suggests the resident population skews older, likely requiring higher acuity care and more hands-on support.

21%

Residents Age 75–84 — State Benchmarked 21% of residents are 75–84, compared to the Maryland average of 31%. Below the state norm — the resident mix may skew either younger or older than this typical middle bracket.

38%

Residents Age 85–94 — State Benchmarked 38% of residents are 85–94, compared to the Maryland average of 44%. The population here skews younger than the statewide norm, which may indicate a more active, lower-acuity community.

32%

Residents Age 95+ — State Benchmarked 32% of residents are 95 or older, compared to the Maryland average of 16%. A high proportion of the oldest-old suggests strong end-of-life care experience and very-high-acuity capabilities.

APEX Luxurious Living
IL
AL
Silver Spring (Woodside Forest)
6No 68 Private / Semi-Private Rooms-----------

Rank badges are statewide and care-type specific: each independent living community is ranked against every other MD independent living community we track that reports that metric, not just the 55 analyzed for Silver Spring. See how we rank facilities

Rows per page:
View all Nearby Homes
12...6

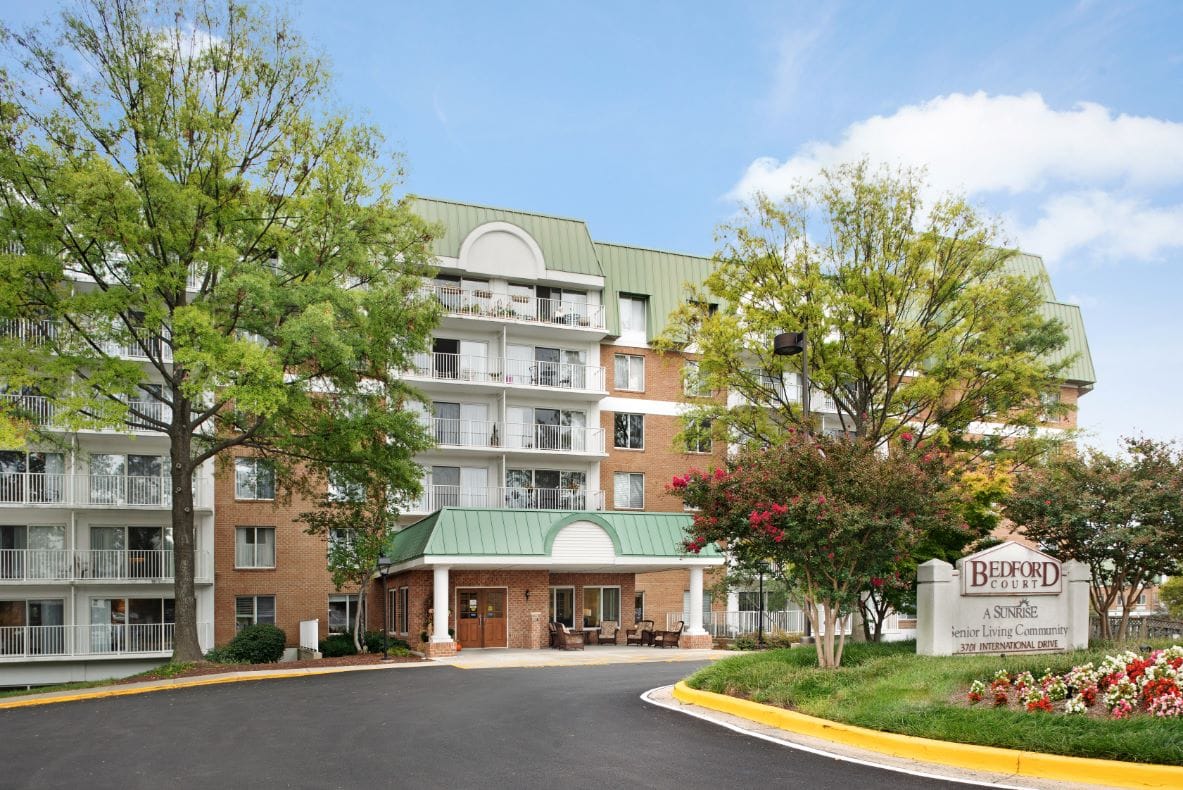
Bedford Court

3701 International Drive, Silver Spring, MD 20906
Overview of Bedford Court

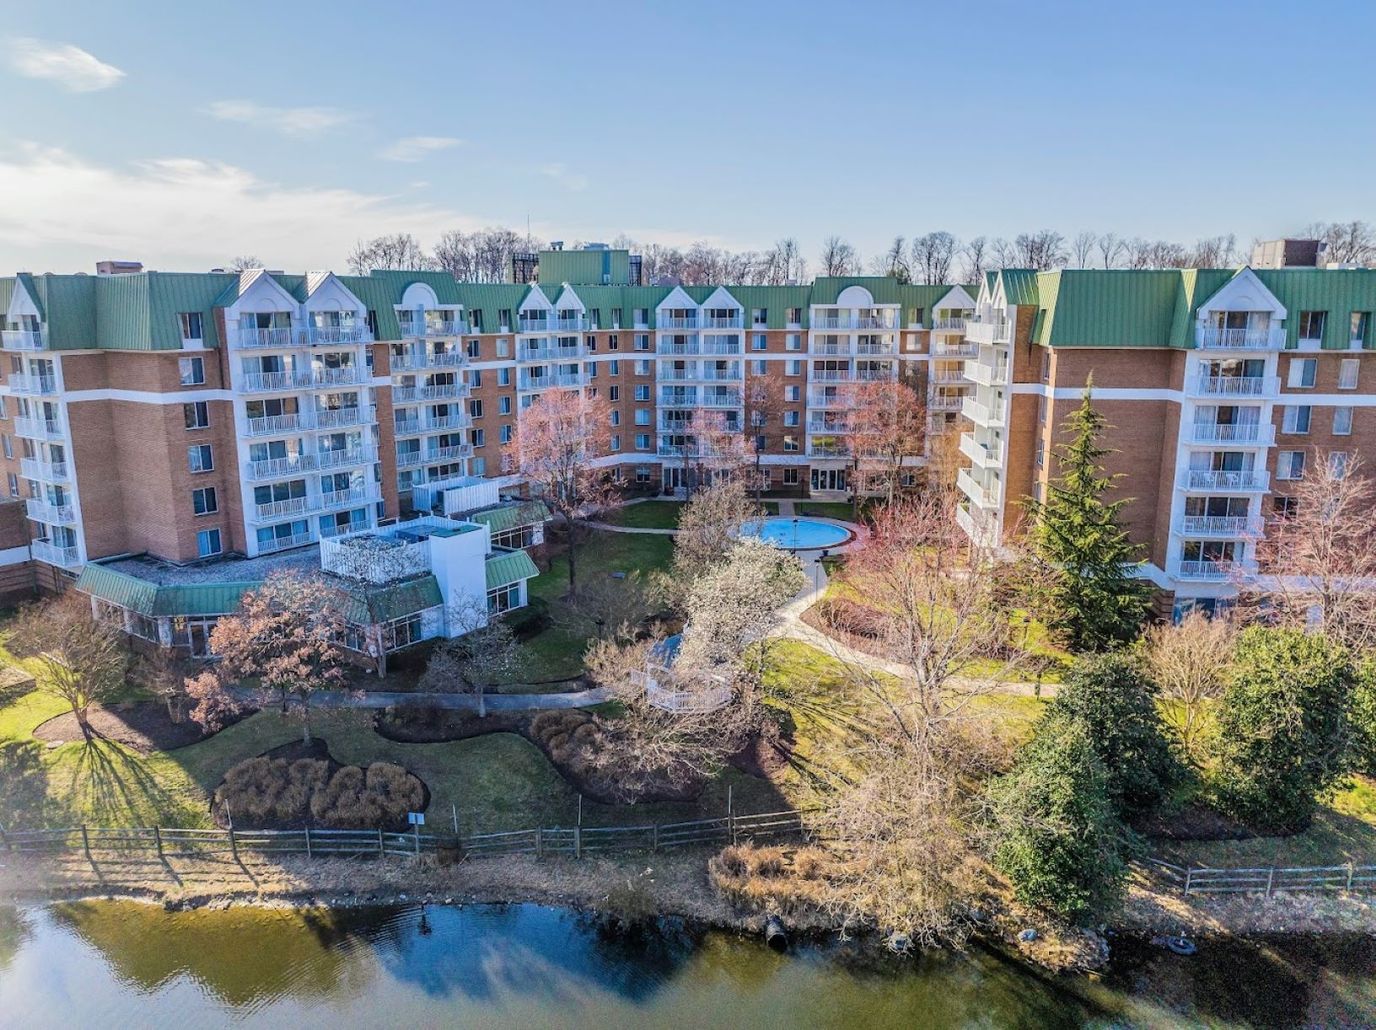
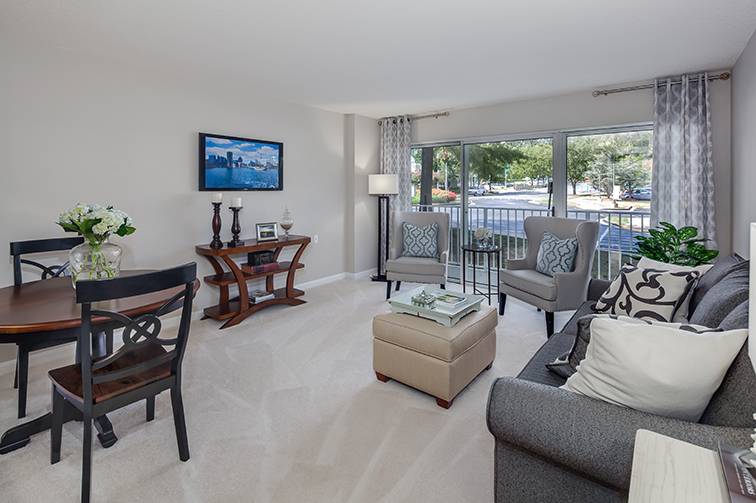
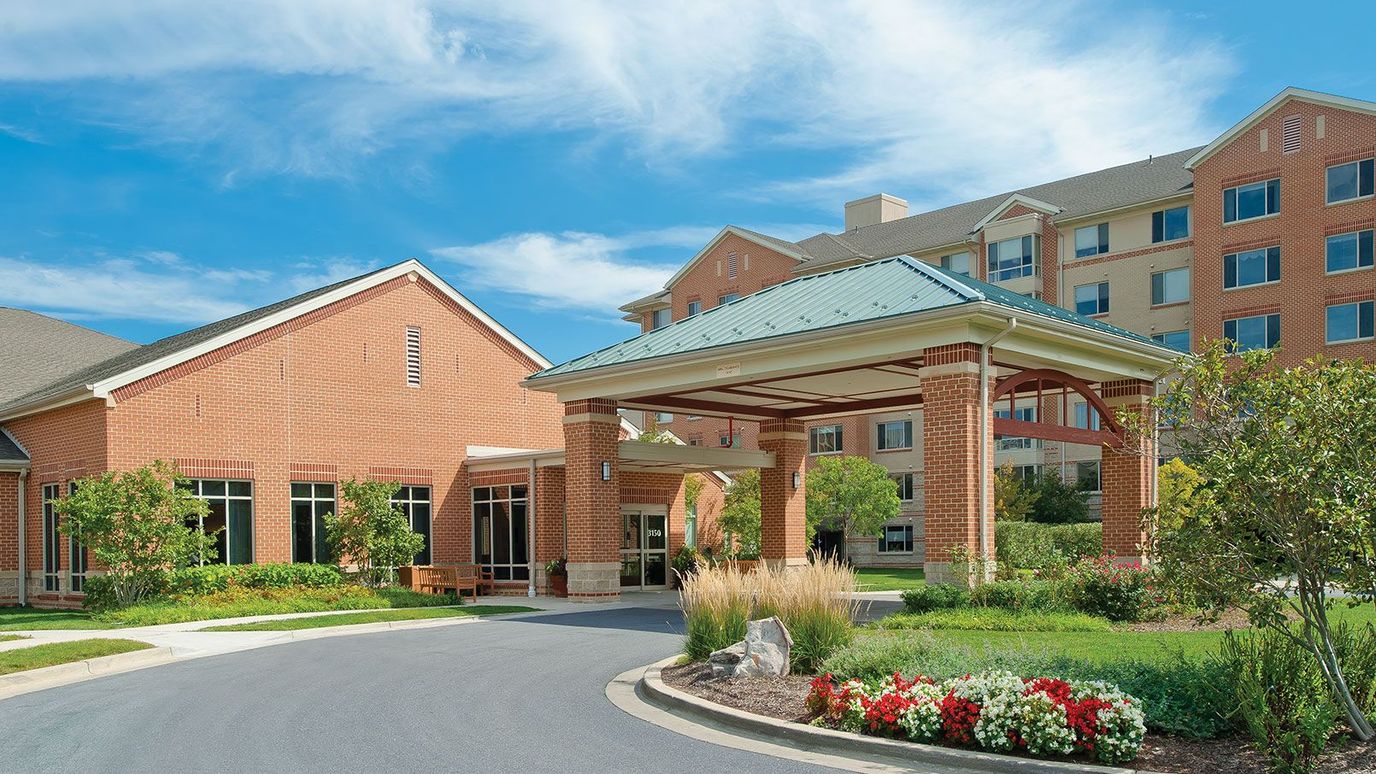
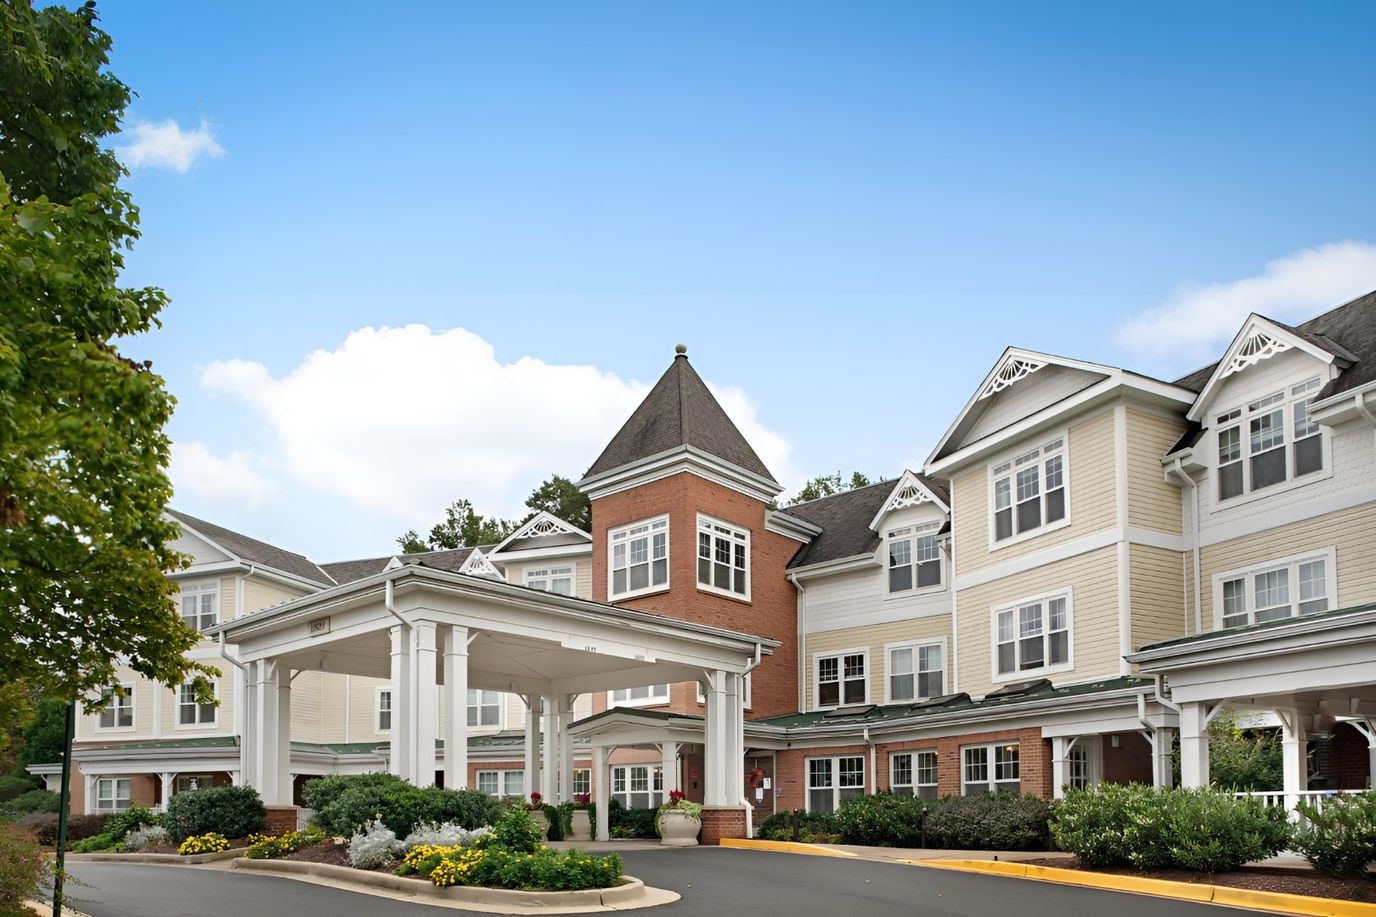
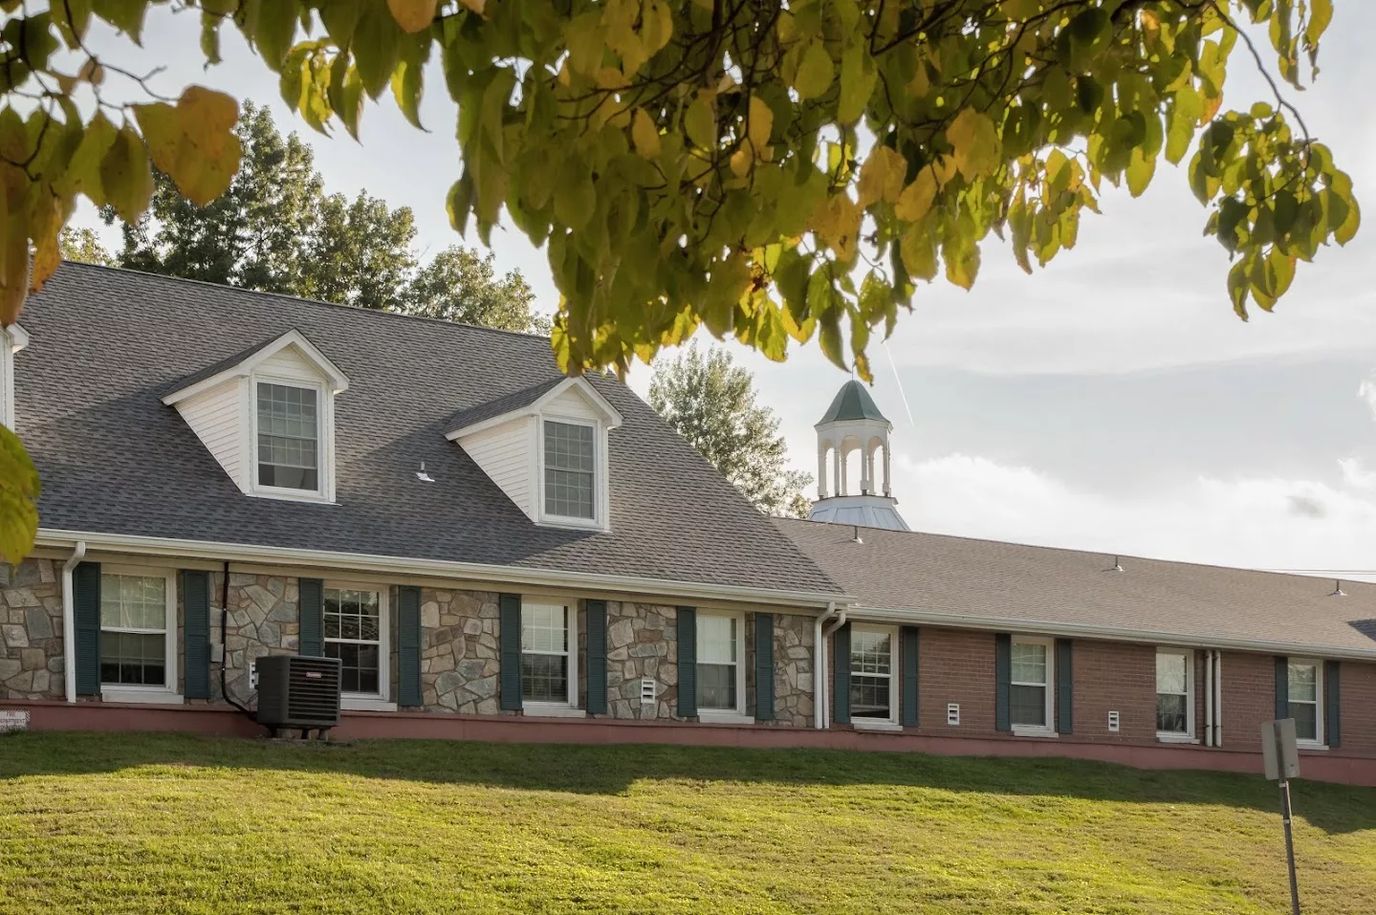
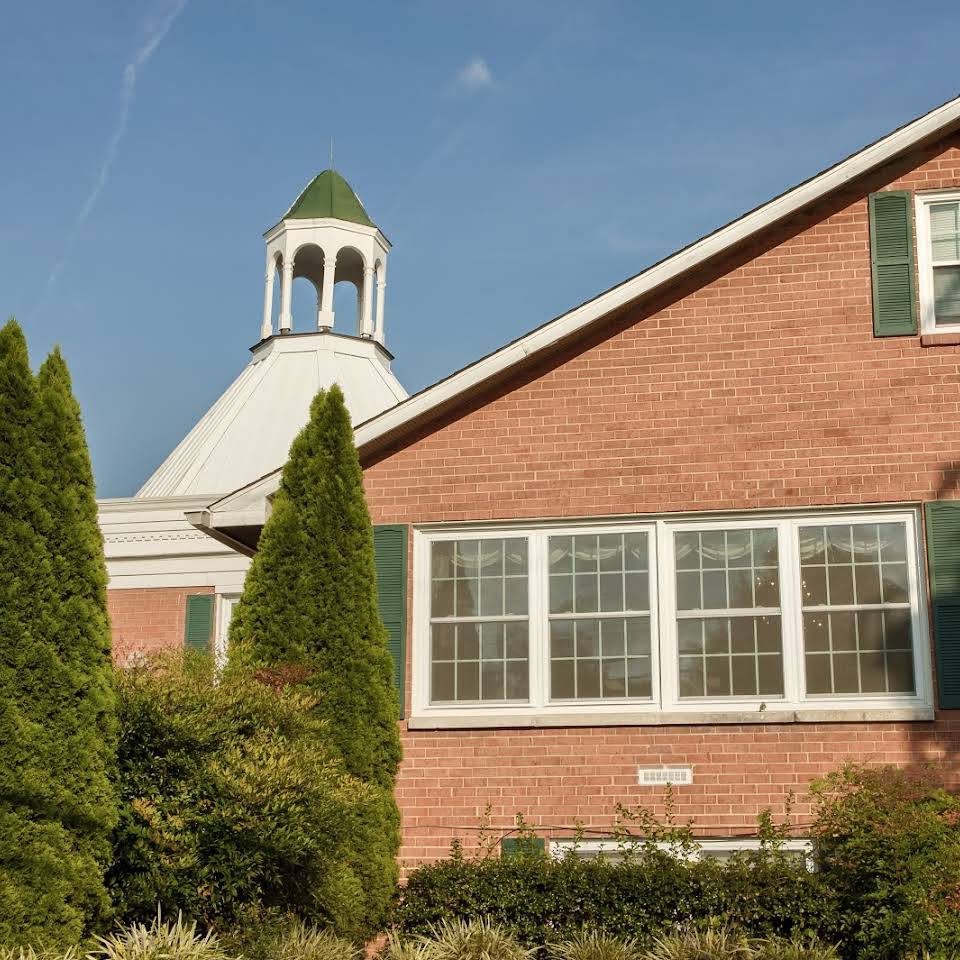
Live a vibrant retirement life with Bedford Court, a blissful senior living community in the serene and beautiful neighborhood of Silver Spring, MD, that strives to provide a welcoming environment filled with warmth and outgoing residents. Here, residents are offered with an active independent living and assisted living lifestyle, as well as skilled nursing and rehabilitation services for those who require assistance in their recovery process. The community provides an array of convenient services, including assistance with daily living activities, medication management, personal care support, and more.

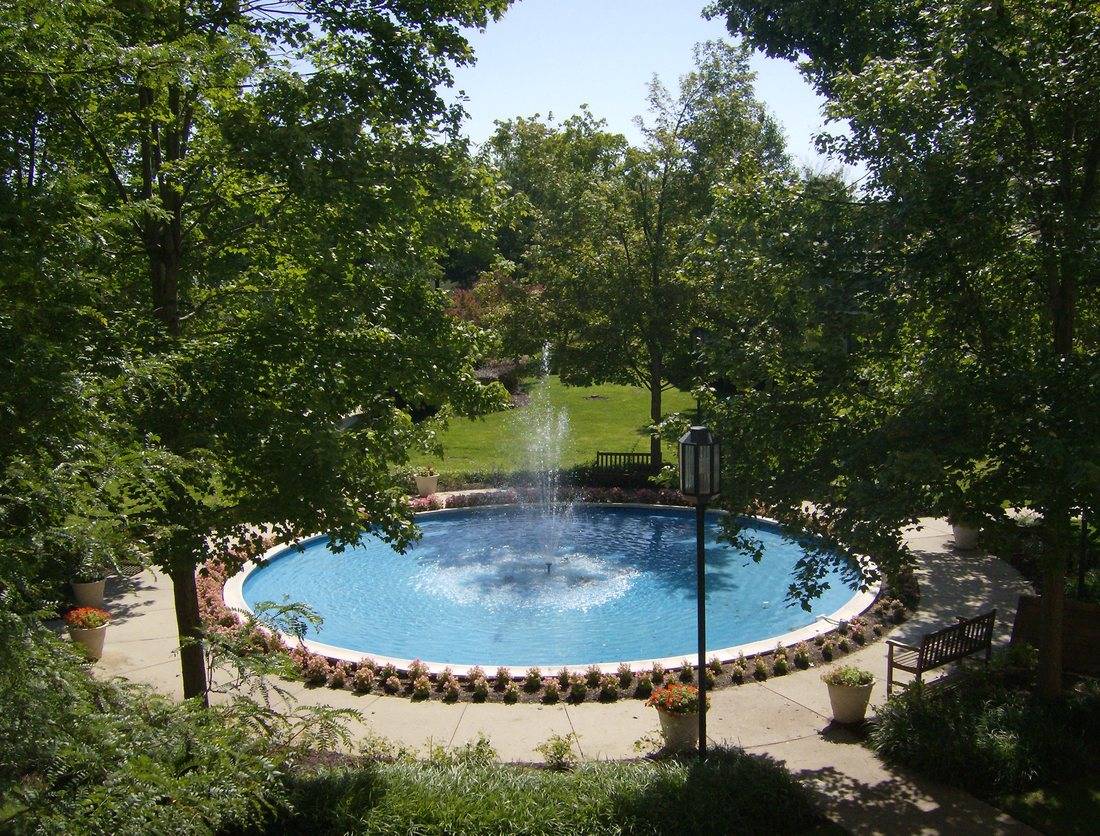
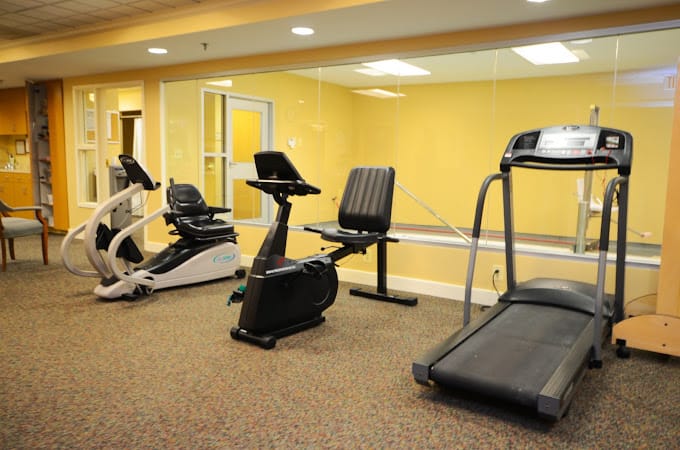
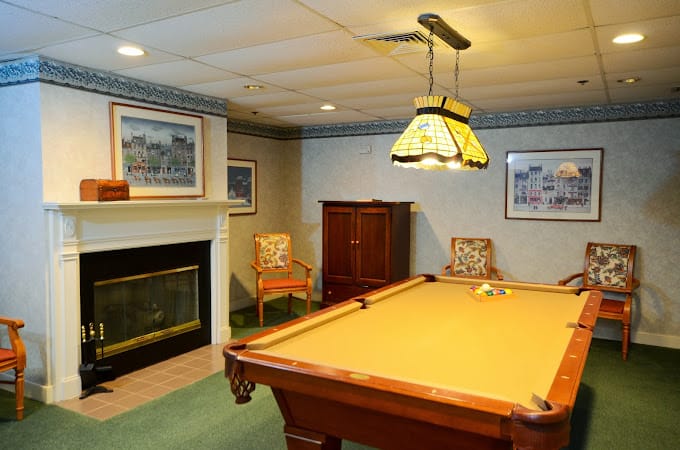
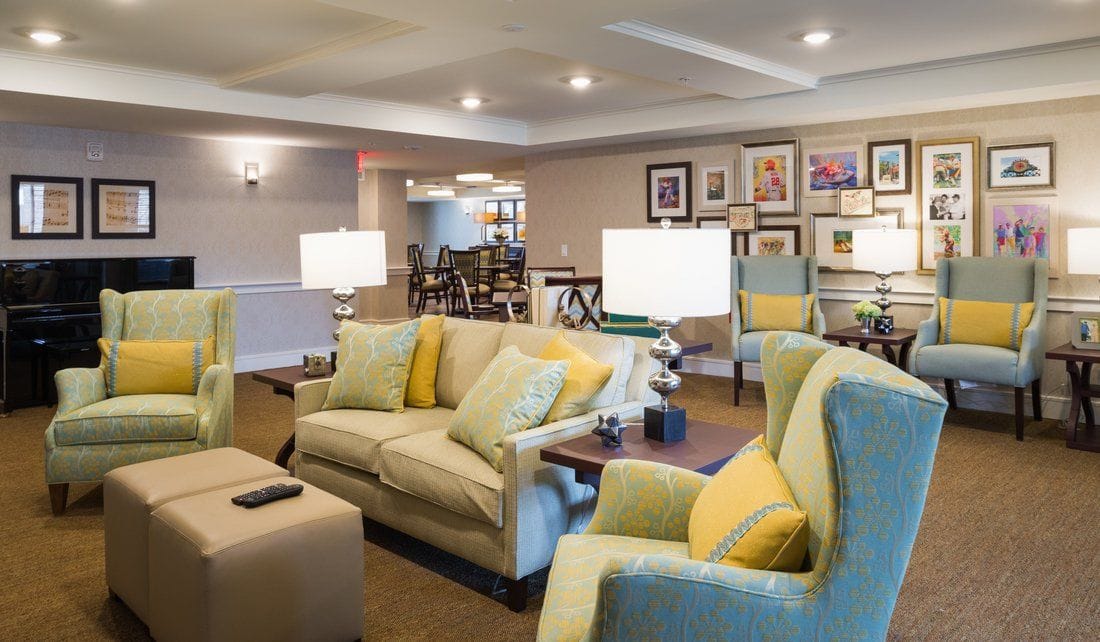
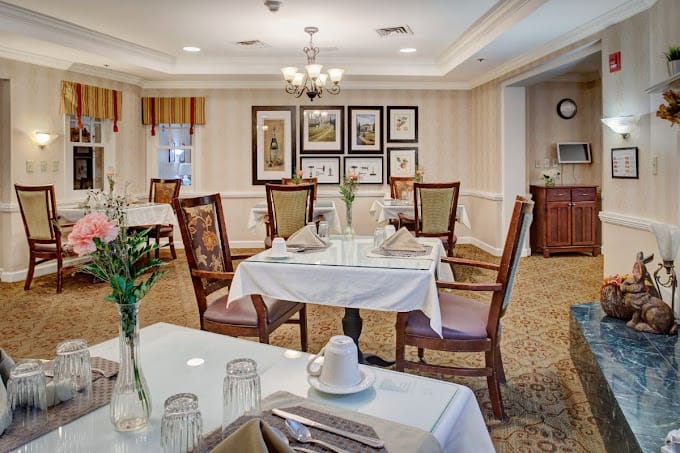
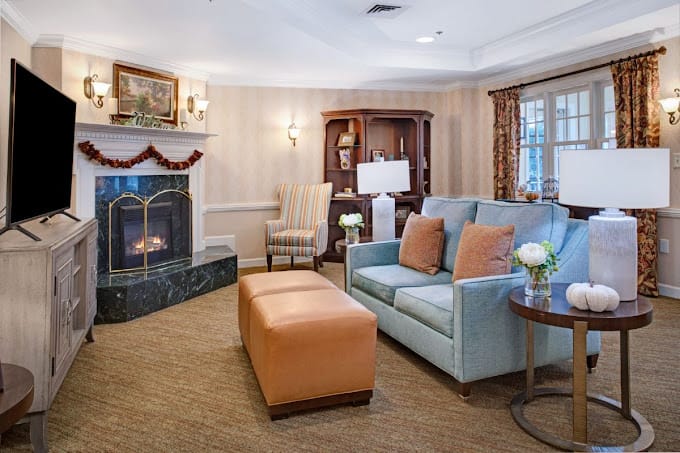
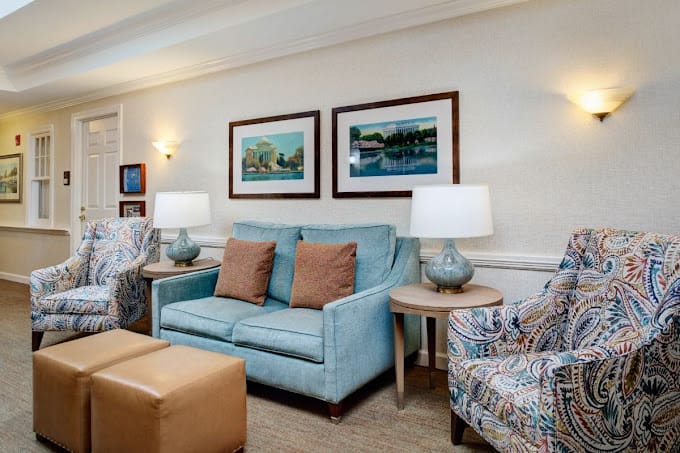
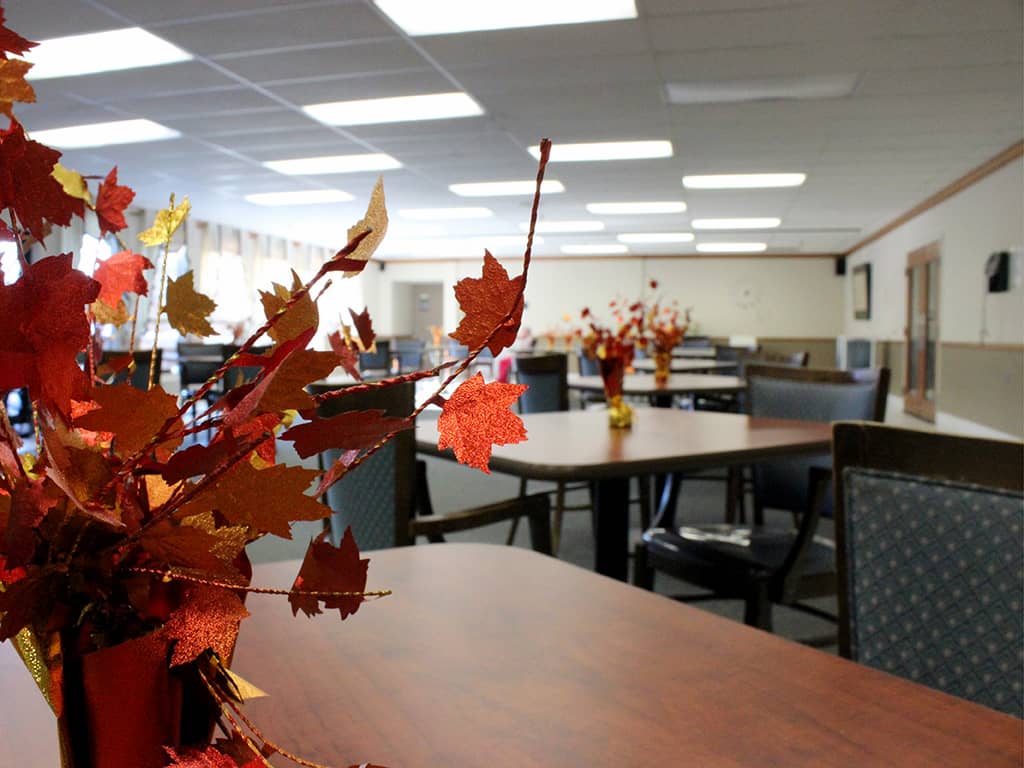
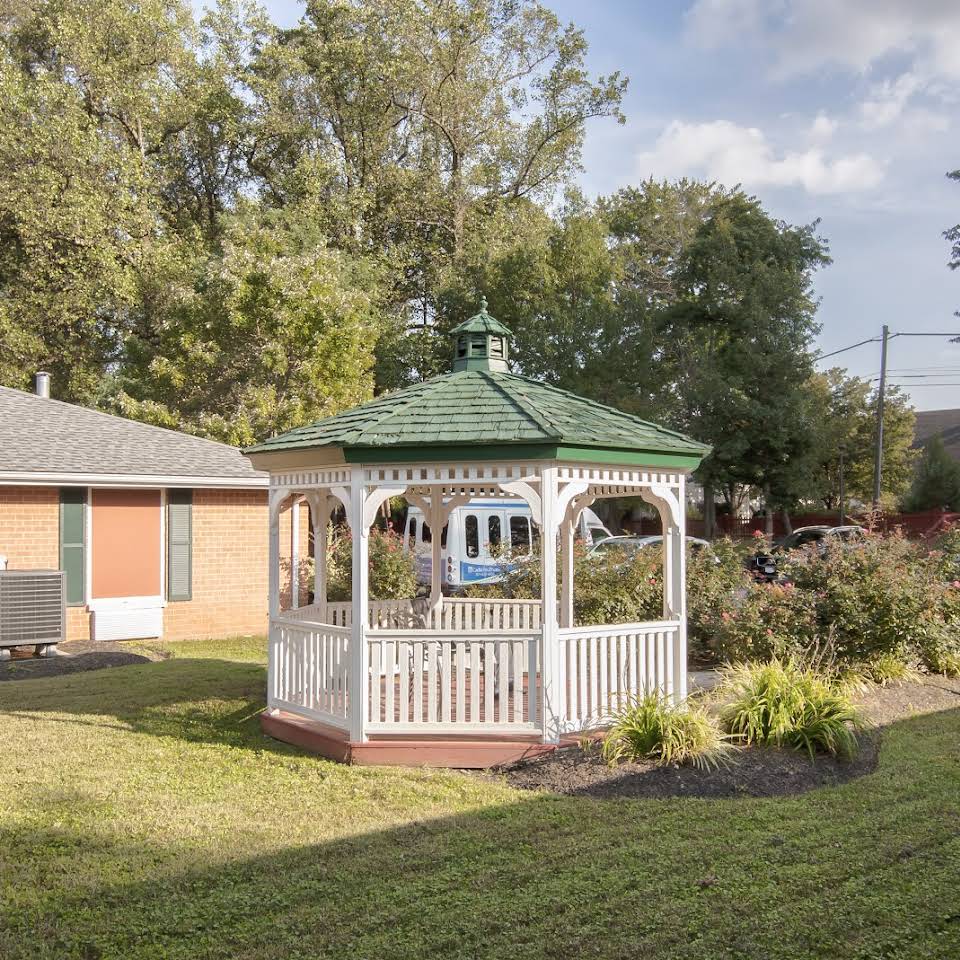
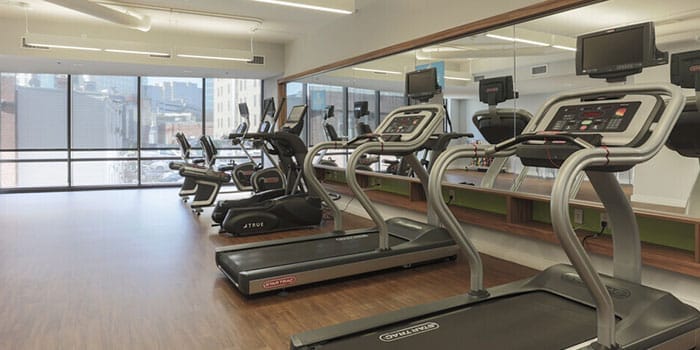
Various conveniences, such as housekeeping, maintenance and concierge services are offered for a maintenance-free living experience. Residents can prepare their own meals or enjoy the community’s restaurant-style dining experience with a great selection of delicately prepared meals served in an elegant dining area. A multitude of hotel-like amenities, such as fitness center, spa, gazebo, activity rooms, a bistro, salon, sun room, and beautiful outdoor spaces are offered to make residents’ living experience more enjoyable.

Contact Bedford Court

Overview of Caring Companions

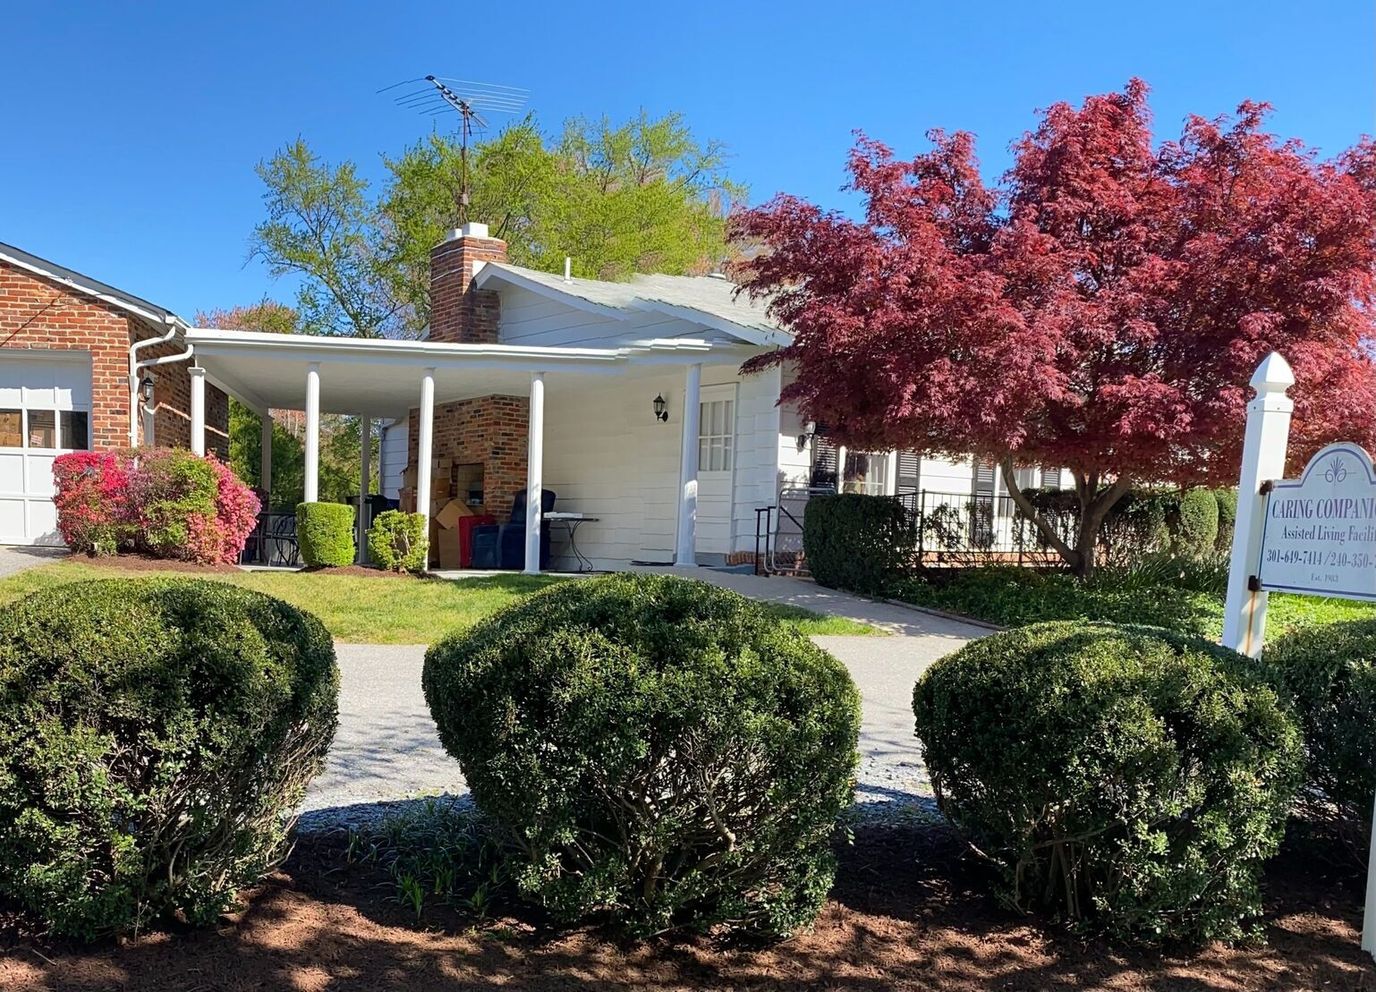
Conveniently located in the serene neighborhood of Silver Spring, MD, Caring Companions is a distinguished community that offers residential care. Here, residents receive the highest quality of care and assistance with a respectful and highly trained team attending to their needs around the clock. Respite care and hospice care are also available to meet residents’ ever-changing needs.

Enjoy every moment of your golden years with a jam-packed calendar of fun activities and stimulating programs tailored to your leisure and wellness. Three healthy and delicious meals are also served to ensure hassle-free dining that satisfies dietary needs and tastes. Medication management, podiatrist services, and incontinence care are available for residents’ convenience. The community is a good option for those seeking assistance and care in their later years with its scenic views and welcoming setting.

Contact Caring Companions Inc

Overview of Sunrise of Chevy Chase

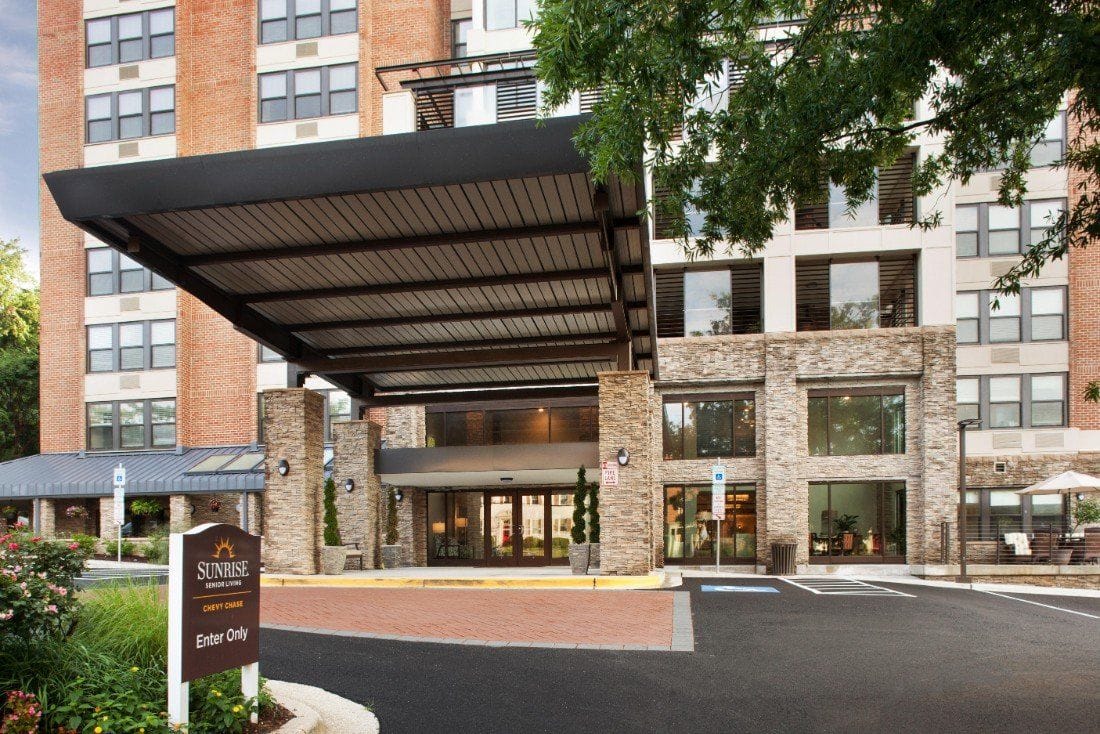
Sunrise of Chevy Chase, nestled in the scenic Silver Spring, Maryland, stands out as one of the premier assisted living places and offers exceptional memory care options for seniors. With a commitment to providing the highest level of care, this community creates a warm and inviting atmosphere where residents can thrive. The community is equipped with specialized programs and trained staff who understand the complexities of memory-related conditions. They create a safe and stimulating environment where residents can maintain their independence and enjoy a high quality of life.

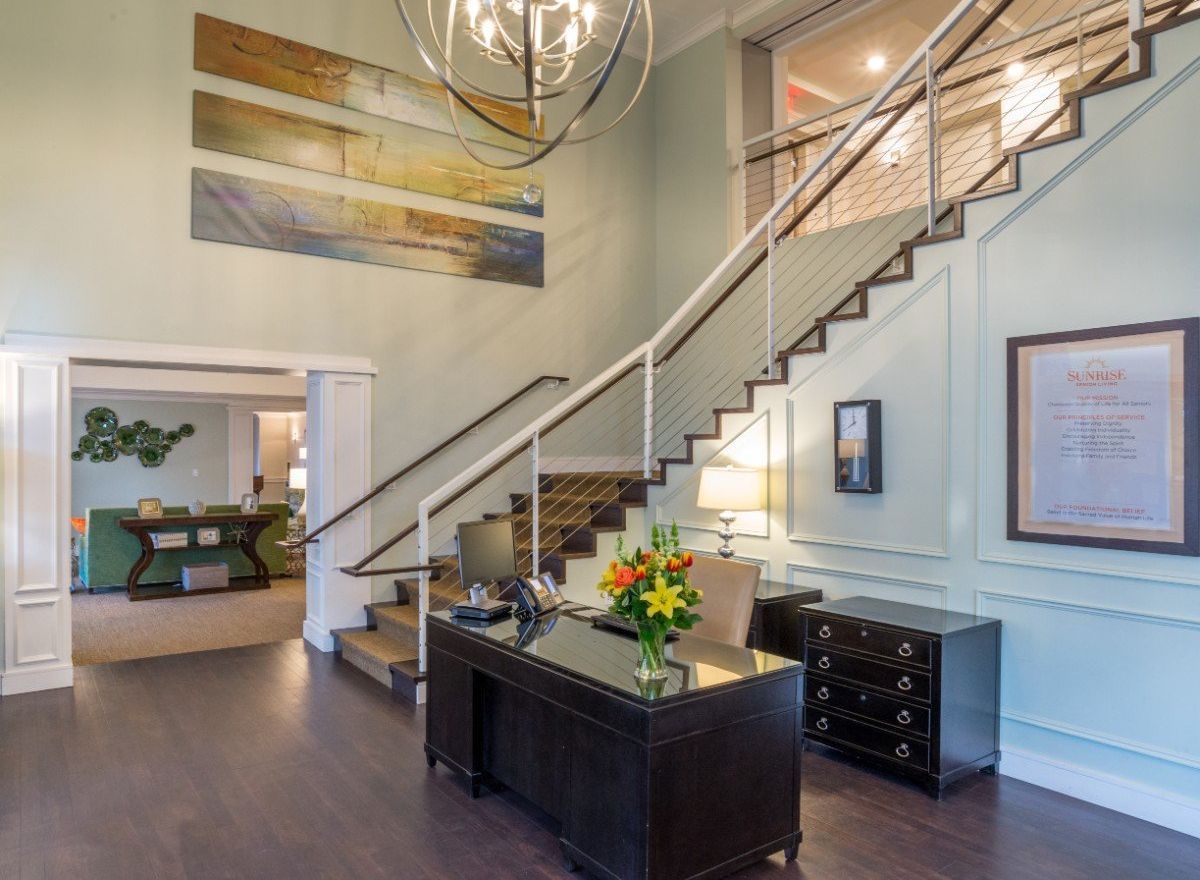
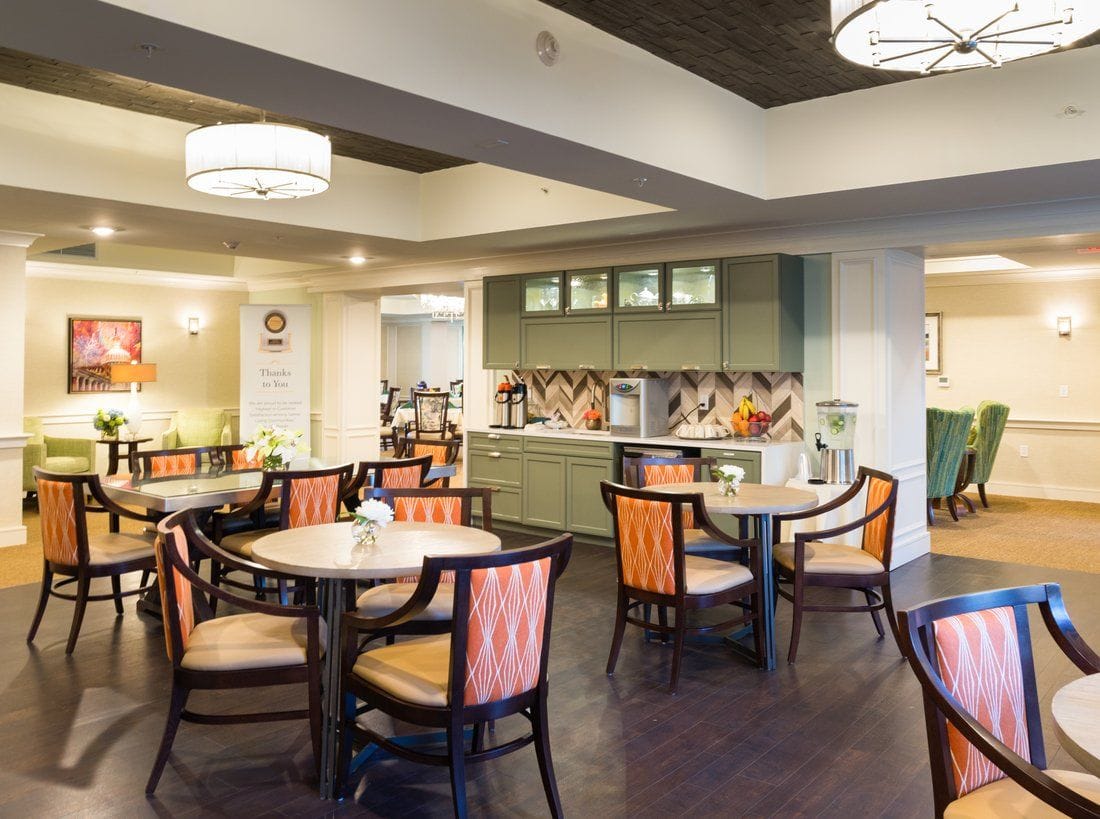
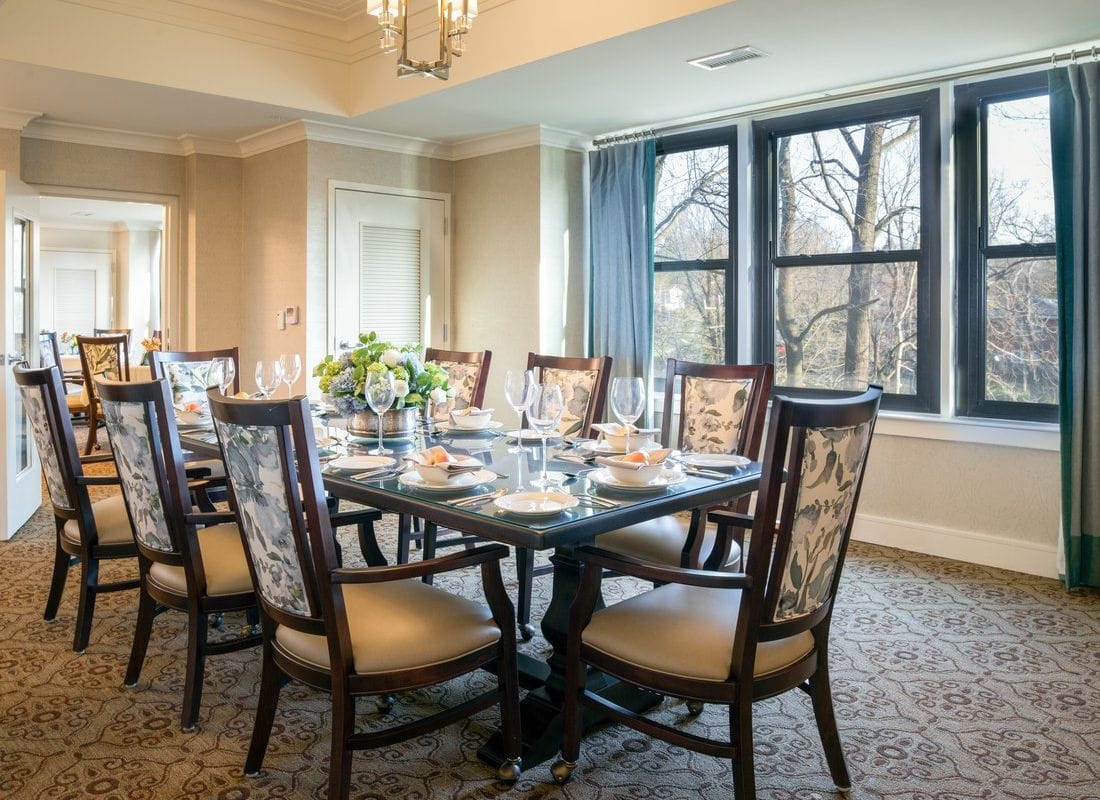
From beautiful common areas to thoughtfully designed living spaces, every aspect is carefully curated to enhance comfort and well-being. The vibrant social calendar is filled with enriching events and opportunities for socialization, fostering a sense of belonging and connection among residents. When it comes to dining, Sunrise of Chevy Chase prides itself on offering delicious and nutritious meals. The culinary team prepares a variety of flavorful dishes using fresh, locally sourced ingredients.

Contact Sunrise of Chevy Chase

Sunrise of Silver Spring

11621 New Hampshire Ave, Silver Spring, MD 20904
Overview of Sunrise of Silver Spring

With a prime Silver Spring location, Sunrise of Silver Spring will help you take advantage of the vibrant local area as well as enjoy your time in beautiful living spaces alongside good friends and neighbors. Sunrise of Silver Spring is one of the biggest senior care communities in Maryland. Just recently, they’ve been recognized as Best Assisted Living as part of U.S. News & World Report’s Best Senior Living ratings for 2023–2024. With a typical room rate that starts at $4,955/month, this community offers expert senior care at a reasonable price. 

Between its beautifully landscaped grounds, spacious suites, and compassionate caregivers, Sunrise of Silver Spring is an ideal choice for those looking for comfort and compassionate care. What’s even more interesting is that their talented team will work with you to create an individualized plan, aligned with your personal needs and preferences. You can spend your days relaxing with a good book and friends, gardening, joining the many on-site activities, or participating in the frequent off-site excursions.

Contact Sunrise of Silver Spring

Overview of Seaton Silver Spring

Nestled in a serene location just outside Washington, D.C. and Baltimore, Aspenwood Senior Living Community in Silver Spring, MD, offers a stress-free retreat where seniors can truly relax and unwind. In the company of friends who have become like family, residents at Aspenwood Senior Living experience a genuine sense of belonging. The community comes alive with laughter and shared memories as residents gather for delightful cookouts, engaging in heartfelt conversations, while the convenient shuttle service allows residents to embark on enriching outings, such as exploring the Smithsonian Museum.

At Aspenwood Senior Living, the community understands the significance of pets in residents’ lives. The charmingly designed living spaces are thoughtfully pet-friendly, ensuring that cherished companions are always welcome. The all-inclusive pricing simplifies the financial aspect by bundling various expenses into one convenient monthly payment. With personalized care and exceptional services at the forefront, seniors can fully embrace a fulfilling lifestyle, unburdened by the complexities of managing multiple bills. Aspenwood Senior Living is committed to providing a warm and engaging environment where seniors can create cherished moments and make the most of their golden years. 

Contact Seaton Silver Spring

Riderwood Village

3140 Gracefield Rd, Silver Spring, MD 20904
Overview of Riderwood Village

Riderwood Village in Silver Spring, Maryland, offers assisted living, a Continuing Care Retirement Community, independent living, and memory care. Assisted living includes help with daily tasks, while independent living provides private living with community services and no daily care. Memory care offers a secured setting with supervision for someone at risk of wandering, and the range of care levels can support a resident whose needs grow over time without leaving the community.

Riderwood Village has 275 beds and may be a good fit for someone who wants access to multiple care levels on one campus. A Walk Score of 33 places the area in a car dependent setting, so most errands require a car or a ride. Pets are allowed, so residents may bring a pet to live with them.

Contact Riderwood Village

Grace House

3214 Norbeck Rd, Silver Spring, MD 20906
Overview of Grace House

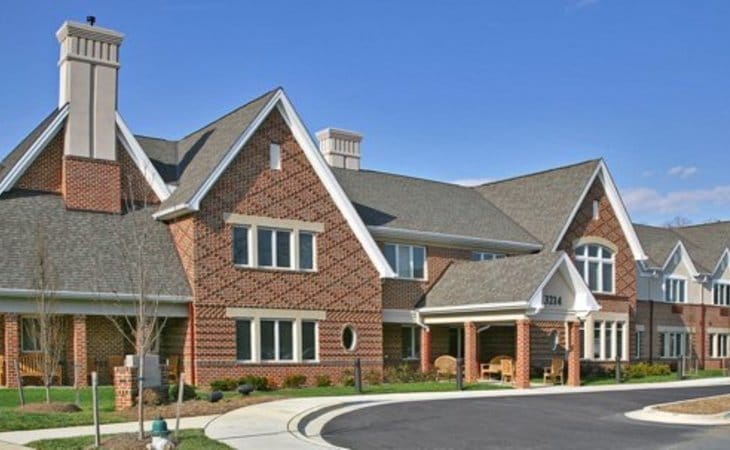
Spend your golden years enjoying everything life has to offer at Grace House, a vibrant senior living community in Montgomery County, Silver Spring, MD, offering excellent assisted living services. The community invites residents to conveniently designed accommodations in variations of studio and one-bedroom apartments that residents can freely personalize to suit their tastes and needs. Proving its commitment to delivering high-quality services that empowers seniors to live full lives, the community has been recognized as a Best Assisted living Community by the U.S. News and World Report.

The community also gives residents access to a wide range of specialty healthcare services provided by local healthcare partners for more extensive care. These include access to rehabilitation, diagnostic services, Primary Care Physician / Nurse Practitioners visits, geriatric psychiatry, hospice care, and podiatry visits. Residents are completely free from the hassles of homeownership with deliciously prepared meals, housekeeping, laundry, and maintenance services provided by the community. Amenities include cozy community rooms, a salon, library, and WiFi access throughout the community or long-distance communications with families and friends.

Contact Grace House

Overview of Bel Pre Healthcare Center

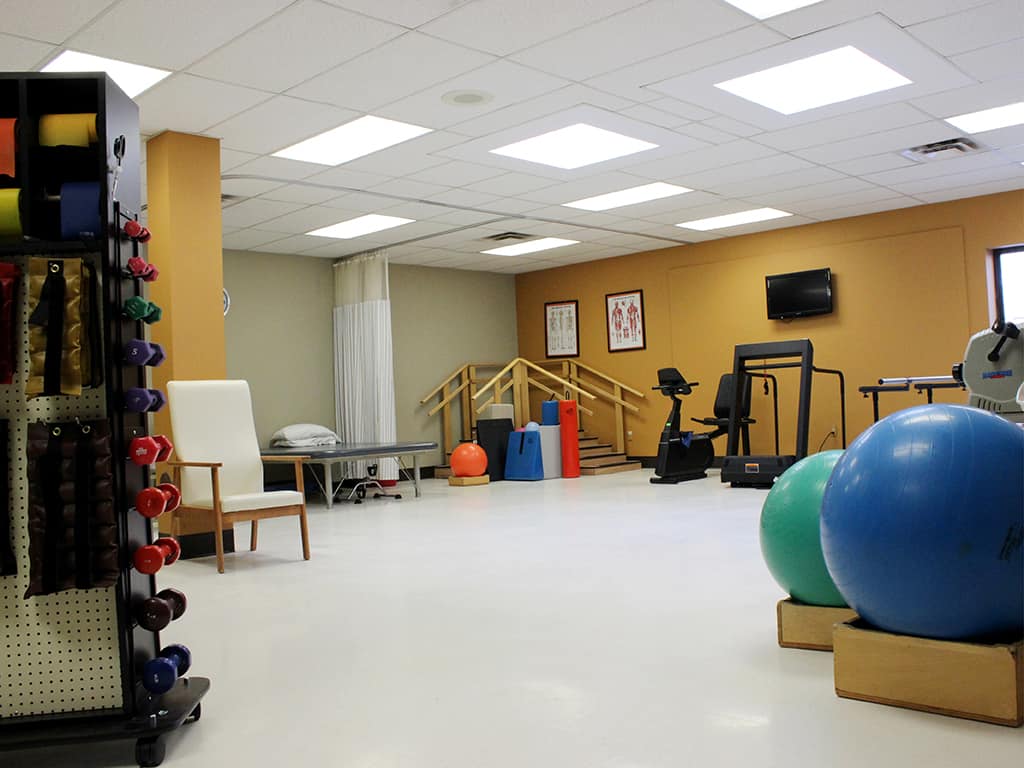
Peacefully set in the tree-lined neighborhood of Silver Spring, MD, Bel Pre Healthcare Center is an outstanding community that offers skilled nursing. Here, residents receive different levels of care, depending on their unique needs. With a kind and highly trained team available around the clock, residents are guaranteed to live their golden years without worries.

Featuring a well-thought-out calendar of fun activities and engaging programs, residents have plenty of things to do for recreation and wellness. Therapy services including occupational and physical therapy, short-term rehabilitation, and long-term care are available to enhance residents’ living conditions. Delightful and healthy meals are served for residents’ nutritional needs and preferences. The community is great for those who need supplementary care to live comfortably in their later years.

Contact Bel Pre Healthcare Center

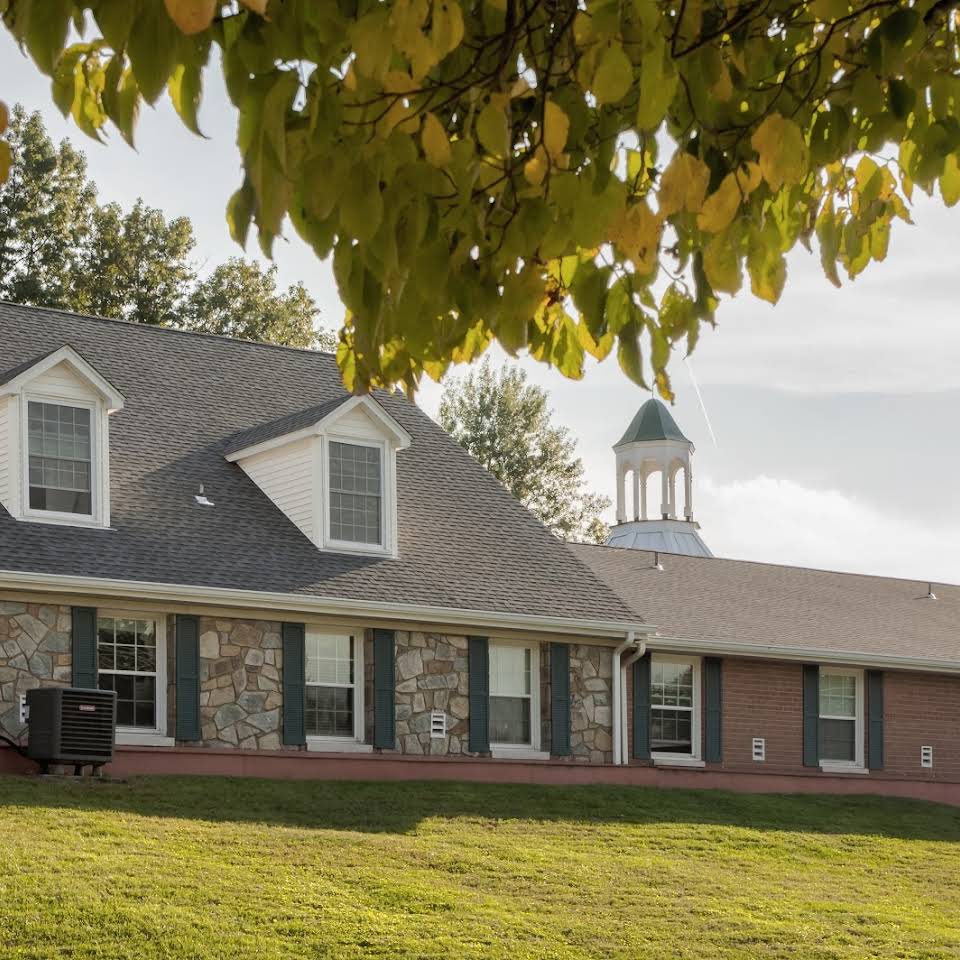
Overview of Complete Care at Springbrook

As its name suggests, Complete Care provides a complete list of comprehensive care that enhances the quality of life for its seniors. The nursing home practices the golden standard of exemplary living– a high-end level of medical attention. It’s been one of the most trusted skilled nursing communities in the city because it has the most comfortable and secure environment and lifestyle for the residents. Complete Care at Springbrook strives to improve the lives of its residents by touching their lives and leading them to an extraordinary experience of senior care. 

Complete Care specializes in orthopedic rehabilitation, sub-acute rehabilitation, in-house dialysis, long-term care, and in-house dialysis. 

Contact Complete Care at Springbrook

Overview of Apex Luxurious Living

Ideally set near highways and Sligo Creek Stream Valley Park in Flora Ct, Silver Spring, MD,  Apex Luxurious Living is an esteemed community that provides assisted living. Featuring cozy and luxurious accommodations, residents will surely have the time of their lives, accompanied by a variety of care services from a compassionate and well-trained team available around the clock. Medication assistance, mobility assistance and continence maintenance are also offered to ensure residents comfort and wellness.

Join a variety of activities and programs tailored to your interests and needs to remain socially engaged and live actively. The community also coordinates with trusted medical providers for residents’ medical needs; transportation coordination is also available for residents to conveniently travel for their medical appointments and errands. Meal preparation, laundry, and other household chores are handled by the community for a hassle-free dining. Experience the best of your later years in luxury with the community’s top-tier services and high-quality amenities.

Contact APEX Luxurious Living

Weighting overview

  • 35%
    Resident Experience
  • 25%
    Regulatory
  • 15%
    Visual Media
  • 10%
    Website
  • 10%
    Stability
  • 5%
    Environment
01

Resident & Family Experience 35%

The single largest share of every ranking. Aggregated review sentiment and volume from major platforms — the closest signal to real resident experience.

  • Includes
  • Review Sentiment
  • Review Volume
02

Regulatory & Safety Record 25%

State inspection records, citations, and complaint visits. We weight per-inspection rates more heavily than raw counts.

  • Includes
  • State Inspections
  • Citations/Inspection
  • % Inspections w/ Citations
  • Complaint Visits
  • Accreditations
  • BBB Rating
03

Visual Media & Transparency 15%

Communities that publish high-quality visuals give families a real preview. No photos or tours = a negative transparency signal.

  • Includes
  • Video Tours
  • Virtual Walkthroughs
  • Photo Quantity
  • Photo Quality
04

Website & Operator Transparency 10%

Site quality and whether the operator publishes basic accountability information — staff names, contact details, ownership.

  • Includes
  • Website Content
  • Mobile Usability
  • Staff Info Available
  • Owner Info Available
05

Community Stability 10%

Operational signals indicating whether a community is well-run and meeting demand.

  • Includes
  • Occupancy Rate
  • Bed Options
06

Environment & Pricing 5%

Walkability and pricing transparency. Walk Score is weighted higher for Independent Living than for Memory Care, where most residents do not leave unaccompanied.

  • Includes
  • Walk Score
  • Pricing Transparency
No paid rankings Communities cannot pay to influence placement.
How we're paid: If we help you find a community and you move in, that community may pay us a referral fee. This never affects where they rank or what you pay. Learn more
Submit a correction

Senior Living in Silver Spring at a glance

Avg Walk Score: 34/ 100The average Walk Score across facilities in Silver Spring, MD. A third-party neighborhood walkability score (0–100) measuring convenience and context, not healthcare quality. Individual facilities can vary widely from this average.
National Average: 50/ 100
Avg No. of Beds: 32The average licensed bed capacity across facilities in Silver Spring, MD. Individual facilities can vary widely from this average.
National Average: 90
Who we are

Your Senior Care Partner, Every Step of the Way

We help families find affordable senior communities and unlock same day discounts, Medicaid, and Medicare options tailored to your needs.

Contact us Today

Frequently Asked Questions about Senior Living in Silver Spring, MD

What is senior living?

Senior living is an umbrella term covering independent living, assisted living, memory care, and nursing homes — communities and services designed for adults aged 55 or older.

How many senior living communities are listed on this page?

This page features 55 senior living communities in Silver Spring, MD. Use the filters and comparison tools above to compare ratings, amenities, and pricing.

How do I choose the right senior living community in Silver Spring, MD?

Start by matching the level of care offered to the resident's current and anticipated needs, then compare licensing status, staff-to-resident ratios, recent inspection results, and pricing. Tour at least two or three communities in Silver Spring, MD, talk to current residents and families, and confirm what is included in the base rate versus billed as add-on services.

What should I look for when visiting senior living communities in Silver Spring, MD?

Pay attention to staff interactions with residents, cleanliness and odor, food quality at meal times, the activity calendar, and how questions about pricing and care plans are answered. Ask to see the most recent state inspection report, the move-out / level-of-care-change policy, and a sample monthly bill that lists every fee.