Accel at College Station
Nursing Home · College Station, TX
CMS overall rating Info The Overall CMS Rating is scored from 1 to 5 stars and combines results from health inspections, staffing levels, and quality measures. Health inspections carry the most weight. Staffing and quality scores can increase or decrease the final rating based on performance compared to state and national standards.

Accel at College Station

Nursing Home · College Station, TX
CMS overall rating Info The Overall CMS Rating is scored from 1 to 5 stars and combines results from health inspections, staffing levels, and quality measures. Health inspections carry the most weight. Staffing and quality scores can increase or decrease the final rating based on performance compared to state and national standards.
Calculator: See prices in your area
Accel at College Station accepts Medicare, Medicaid, and private pay.

Overview of Accel at College Station

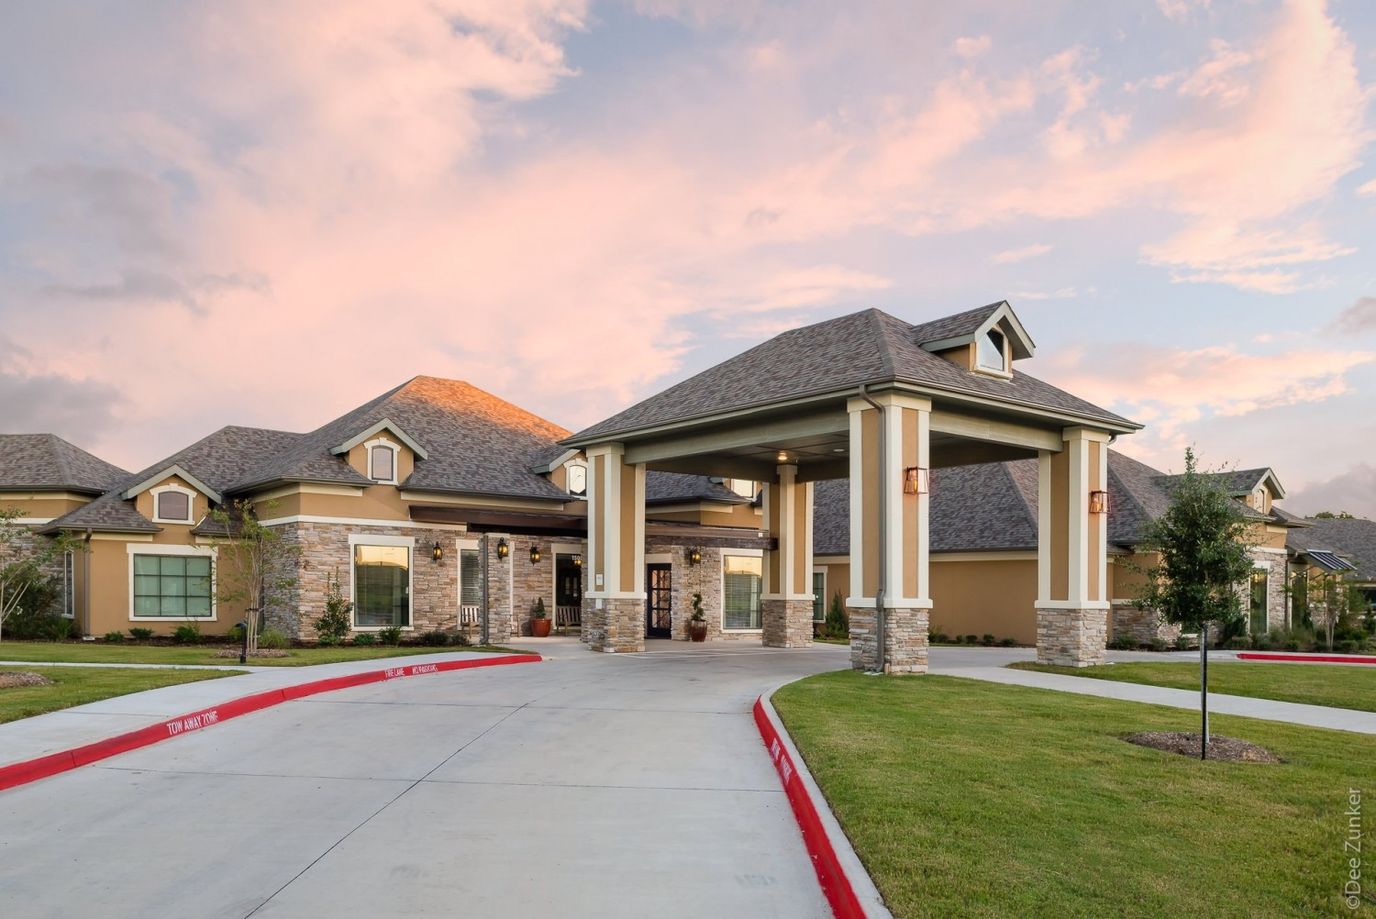
Accel at College Station is a nursing home in College Station, TX, offering a wide range of care options, including long-term care, skilled nursing, rehabilitation, and pulmonary care. Here, older adults are treated like family, especially with a compassionate and nurturing atmosphere. With 24-hour care, medication management, and therapy services, residents do not have to worry about their needs and live comfortably in retirement. Through individualized care plans, the community strives to help residents recover with ease.

Recreational activities, light exercises, and social events also promote social engagement and an active lifestyle. With a spacious dining area, cozy communal spaces, and thoughtfully furnished rooms, residents can relax and interact with the community. A stress-free retirement is also guaranteed, as it is peacefully nestled in the residential area of College Station. This nursing home continuously provides exceptional standards of care, making it one of the best options for senior living in Texas.

(979) 272-1000

Quality ratings

Measured by Centers for Medicare & Medicaid Services (CMS)

Overall rating Info The Overall CMS Rating combines results from health inspections, staffing levels and quality measures. Health inspections carry the most weight. Staffing and quality scores can increase or decrease the final rating based on performance compared to state and national standards.
▼ 28.4% Below TX avg.
Health Inspection Info Based on the results of the facility's three most recent standard inspections and any complaint investigations. CMS reviews the number, scope, and severity of deficiencies, with more recent findings weighted more heavily.
▼ 63.8% Below TX avg.
Staffing Info Measures average nursing staff hours per resident per day, including Registered Nurses (RNs) and total nursing staff. Ratings are adjusted based on the level of care residents require and are compared to state and national benchmarks.
▼ 52.9% Below TX avg.
Quality Measures Info Based on clinical and physical health indicators reported to CMS, such as hospital readmissions, falls, pressure ulcers, and improvements in mobility. These measures reflect how well residents' health needs are being managed.
▲ 33.2% Above TX avg.

Staffing hours breakdown

Info Daily nursing hours per resident by staff type, reported to CMS. Higher is generally better — compare this facility to state and national averages to see where staffing stands.

Hours per resident per day — compared to Texas state averages

Total nursing care / resident Info This home is ranked 109th out of 240 homes in Texas.

Total adjusted nursing hours per resident per day, combining RN, LPN, and aide time. CMS adjusts this for case-mix so facilities can be fairly compared.
3h 37m per day
Rank #109 / 240Nurse hours — state benchmarkedThis home is ranked 109th out of 240 homes in Texas.Shows adjusted nurse hours per resident per day benchmarked to the Texas average, with a ranking across 240 Texas SNFs. More hours mean more direct care. The national average is about 3.5 hrs; below 3.0 is a red flag.
This facility Texas avg (3h 38m per day)
vs Texas avg
+0%

5 of 6 metrics below state avg

Staff type Hours / day vs state avg
Registered Nurse (RN) Info RNs hold the highest nursing license and can assess residents, interpret test results, and direct care plans. More RN hours per day often signals stronger clinical oversight and faster response to health changes. 17m per day ▼ 35% State avg: 26m per day · National avg: 41m per day
LPN / LVN Info Licensed Practical Nurses (LPNs) or Licensed Vocational Nurses (LVNs) deliver routine hands-on care — medication administration, wound dressing, and monitoring vital signs. They work under RN supervision and make up a large share of daily bedside care. 47m per day ▼ 18% State avg: 57m per day · National avg: 52m per day
Nurse Aide Info Certified Nurse Aides (CNAs) provide the most direct day-to-day assistance: bathing, dressing, feeding, and mobility. Nurse aide hours are typically the largest staffing category and directly affect residents' quality of life. 1h 39m per day ▼ 18% State avg: 2h 1m per day · National avg: 2h 21m per day
Total Nursing (Weekend) Info Combined nursing hours (RN + LPN + Nurse Aide) per resident per day on weekends. Staffing often drops on weekends — this figure reveals whether the facility maintains adequate coverage outside of weekday hours. 2h 59m per day ■ Avg State avg: 2h 59m per day · National avg: 3h 26m per day
Physical Therapist Info Hours per resident per day provided by licensed Physical Therapists (PTs) or PT Assistants. PT services help residents recover mobility after injury or illness and are especially important for post-acute (short-stay) rehabilitation. 1m per day ▼ 75% State avg: 4m per day · National avg: 4m per day
RN (Weekend) Info Registered nurse hours specifically on weekends. Facilities sometimes reduce RN presence on Saturdays and Sundays — a low weekend RN figure compared to weekday hours can indicate reduced clinical oversight when most administrative staff are absent. 16m per day ▼ 24% State avg: 21m per day · National avg: 29m per day

Capacity and availability

This home usually has availability

Occupancy lower than 85% suggests more openings may be available.

Higher occupancy than the Texas average: 63.5%
Occupancy rate 78.8% Rank #72 / 252Occupancy rate — state benchmarkedThis home is ranked 72nd out of 252 homes in Texas.Shows this facility's occupancy rate versus the Texas average, with its statewide rank out of 252. Higher occupancy signals strong local demand and financial stability.
Avg. Length of Stay 62 days
Occupancy rate
78.8% Rank #72 / 252Occupancy rate — state benchmarkedThis home is ranked 72nd out of 252 homes in Texas.Shows this facility's occupancy rate versus the Texas average, with its statewide rank out of 252. Higher occupancy signals strong local demand and financial stability.
Avg. Length of Stay
62 days

Who this home usually serves

TYPE OF STAY

Primarily short stays

Residents typically stay for brief periods, with frequent admissions and discharges throughout the year.

Breakdown by payment type

Medicare

24% of new residents, usually for short-term rehab.

Typical stay 21 days

Private pay

69% of new residents, often for short stays.

Typical stay 1 - 2 months

Medicaid

7% of new residents, often for long-term daily care.

Typical stay 1 years

Finances and operations

Governmental community
Operated by state authorities.
Home revenue
$13.4M
Operating deficit
-$1.1M
Governmental community Operated by state authorities.
Home revenue
$13.4M Rank #60 / 252Revenue — state benchmarkedThis home is ranked 60th out of 252 homes in Texas.Shows this facility's annual revenue compared to the Texas SNF average. Higher revenue generally means more resources for staffing and capital — read alongside Payroll %.
Operating deficit
-$1.1M
Payroll costs Info The portion of the home's budget spent on staff, including nurses, caregivers, and other employees who support care and operations. Rank #181 / 252Payroll — state benchmarkedThis home is ranked 181st out of 252 homes in Texas.Shows total annual staff payroll benchmarked to the Texas average. Higher payroll investment relative to peers often signals better staffing and less reliance on cheaper contract labor.
$5.0M
37.6% of revenue Rank #224 / 230Payroll % — state benchmarkedThis home is ranked 224th out of 230 homes in Texas.Shows payroll as a percentage of revenue versus the Texas average. Well-run SNFs often land around 55–65%. Below 25% may signal understaffing or heavy agency use — read with Staffing ratings.
Other operating costs Info All remaining costs needed to run the home, such as food, utilities, building maintenance, supplies and administrative expenses.
$9.5M
Total costs $14.5M
Walk Score
Walk Score: 23 / 100
Car-dependent. Most errands require a car, with limited nearby walkable options.

What does this home offer?

Housing options icon

Housing Options: Private / Shared Rooms

Building type icon
Building type icon

Building Type: Single-story

Dining services icon

Dining Services

Housekeeping icon
Housekeeping icon

Housekeeping Services

Social and recreational activities icon

Social and Recreational Activities

On-site medical care and health services icon

On-site Medical Care and Health Services

Rehabilitative support icon

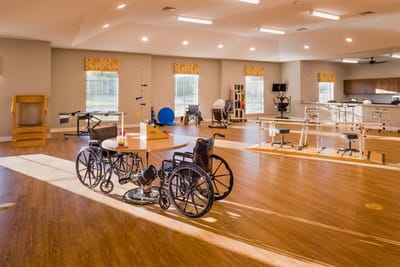
Rehabilitative Support

Types of Care at Accel at College Station

Nursing Home

Contact Accel at College Station

Health Inspection History

Inspections
Total health inspections 17

Texas average 7.4


Last Health inspection on Sep 2025

Total health citations
48 Rank #223 / 243Health citations — state benchmarkedThis home is ranked 223rd out of 243 homes in Texas.Shows this facility's total health deficiency citations benchmarked to the Texas state average, with a ranking across all 243 TX SNFs. Lower citation counts earn a better rank.

Texas average 25.9

Citations per inspection
2.82 Rank #83 / 243Citations per inspection — state benchmarkedThis home is ranked 83rd out of 243 homes in Texas.Shows average deficiency citations per CMS inspection for this facility versus the Texas mean across 243 SNFs with citation data. Lower is better.

Texas average 3.67


Health citations are formal notices following inspections when they fail to comply with safety and care standards.

21 of 48 citations resulted from standard inspections; 25 of 48 resulted from complaint investigations; and 2 of 48 came from combined inspections (standard and complaint).

Breakdown of citation severity (last 4 years)
Critical Health citations More info
11
450% worse than Texas average

Texas average: 2


Serious Health citations More info 0
100% better than Texas average

Texas average: 0.4

11 critical citations More info Texas average: 2

0 serious citations More info Texas average: 0.4

37 moderate citations More info Texas average: 23

0 minor citations More info Texas average: 0.4
Citations history (last 4 years)
Resident Rights moderate citation Info Issues related to resident's rights, including dignity, privacy, and the ability to make decisions about their care. Sep 04, 2025
Corrected

Infection Control moderate citation Info Issues related to preventing and controlling infections, including hygiene practices and safety protocols. May 21, 2025
Corrected

Nutrition moderate citation Info Issues related to food quality, meal service, and resident's nutritional needs. May 21, 2025
Corrected

Pharmacy moderate citation Info Issues related to medication management, including how drugs are stored, administered, and monitored. May 21, 2025
Corrected

Financial Assistance for
Nursing Home in Texas

Accel at College Station is located in College Station, Texas.
Here are the financial assistance programs available to residents in Texas.

Get Financial aid guidance

Community Care for the Aged and Disabled (CCAD)

TX Medicaid CCAD

Age 65+ or disabled
General Texas resident, Medicaid-eligible, care need (not always nursing home level).
Income Limits (2025) ~$2,829/month 300% FBR, individual
Asset Limits $2,000 (individual), $3,000 (couple).
TX

Large state; rural access challenges.

Benefits
Personal care (5-7 hours/day) Respite (240 hours/year) Adult day care (~$60/day) Home aides

Texas Community Care Services

TX CCS

Age 60+
General Texas resident, at risk of decline.
Income Limits ~$2,000/month individual, varies
Asset Limits $5,000 individual
TX

Limited funding; high demand in urban areas.

Benefits
In-home care (3-5 hours/week) Respite (up to 10 days/year) Transportation (~5 trips/month)

Area Agency on Aging (AAA) Services

Texas AAA Services

Age 60+
General TX resident; no income/asset limits.
Income Limits (2025) None; donations encouraged.
Asset Limits Not assessed.
TX

28 AAAs; includes Meals on Wheels in some areas.

Benefits
Meals (~$5-$7/meal) Transportation Homemaker services (~4 hours/week) Respite (~5 days/year) Legal aid

Medicare Savings Program (MSP)

Texas Medicare Savings Program

Age 65+ or disabled
General TX resident, Medicare Part A/B.
Income Limits (2025) ~$2,510/month (QMB), ~$3,380/month (SLMB), ~$3,598/month (QI)—individual.
Asset Limits $9,430 (individual), $14,130 (couple).
TX

Includes Extra Help for Part D; no waitlist.

Benefits
Covers Part B premiums ($174.70/month) Deductibles ($240/year) Copays (~20%)

Family Caregiver Support Program (FCSP)

Texas Family Caregiver Support Program

Age
General Caregivers of 60+ needing care or 55+ caregivers of others; TX resident; 2+ ADLs.
Income Limits (2025) No strict cap; prioritizes low-income ~$24,980/year
Asset Limits Not assessed.
TX

High rural demand; includes grandparent caregivers.

Benefits
Respite (4-6 hours/week or 5 days/year) Adult day care ($60/day) Training Supplies (~$500/year)

VA Aid and Attendance (A&A) and Housebound Benefits

Texas VA Aid and Attendance/Housebound

Age 65+ or disabled veteran/spouse
General TX resident, wartime service, ADL help (A&A) or homebound.
Income Limits (2025) Net income < ~$1,984/month (veteran with dependent, A&A); pension offsets income.
Asset Limits ~$155,356 net worth
TX

High veteran population; supports rural/urban needs.

Benefits
Cash (~$1,433-$2,642/month veteran, ~$951-$1,318 spouse) for care costs

Property Tax Exemption for Seniors

Texas Senior Property Tax Exemption

Age 65+
General TX resident, homeowner (homestead).
Income Limits (2025) None; tax-based eligibility.
Asset Limits Not assessed.
TX

$25,000+ exemption; optional freeze in some counties; saves ~$500-$1,000/year.

Benefits
Tax exemption or freeze (~$500-$1,000/year savings)

Senior Farmers’ Market Nutrition Program (SFMNP)

Texas SFMNP

Age 60+
General TX resident, low-income.
Income Limits (2025) ~$2,322/month 185% FPL
Asset Limits Not assessed.
TX

Vouchers (~$50/season); serves ~20,000 via 28 AAAs.

Benefits
Vouchers (~$50/season) for produce at farmers’ markets

Places of interest near Accel at College Station

Address 4.3 miles from city center Info Estimated distance in miles from College Station's city center to Accel at College Station's address, calculated via Google Maps.

Calculate Travel Distance to Accel at College Station

Add your location

Address

Staffing Data (Q2 2025)

This data corresponds to Q2 2025 and is based on CMS Payroll-Based Journal.

Total staff 111
Employees 93
Contractors 18
Staff to resident ratio 1.44:1
0% compared with Texas average

Texas average ratio: 1.51:1

Avg staff/day 35
Average shift 8.3 hours
0% compared with Texas average

Texas average: 8.1 hours

Total staff hours (quarter) 26,466

Nursing staff breakdown

Registered Nurse

Manages medical care and health needs.

Total count 13
Average shift length Info Average shift length. Calculated as total hours divided by days worked and average staff per day. 8.9 hours

No contractors work on this role.

Licensed Practical Nurse

Assists with medical care and medications.

Total count 24
Average shift length Info Average shift length. Calculated as total hours divided by days worked and average staff per day. 8.7 hours

No contractors work on this role.

Certified Nursing Assistant

Helps with daily care and mobility.

Total count 46
Average shift length Info Average shift length. Calculated as total hours divided by days worked and average staff per day. 8.6 hours

No contractors work on this role.

Contractor staffing

Total hours from contractors

9.4%

2,489 contractor hours this quarter

Physical Therapy Assistant: 4 Speech Language Pathologist: 3 Occupational Therapy Aide: 3 Qualified Social Worker: 2 Physical Therapy Aide: 2 Medical Director: 2 Respiratory Therapy Technician: 2

Staff by category

Certified Nursing Assistant 46 0 46 11,772 91 100% 8.6
Licensed Practical Nurse 24 0 24 6,852 91 100% 8.7
Registered Nurse 13 0 13 2,451 89 98% 8.9
Medication Aide/Technician 6 0 6 1,833 91 100% 10
Speech Language Pathologist 0 3 3 932 66 73% 7
Physical Therapy Assistant 0 4 4 645 78 86% 6.4
Dietitian 1 0 1 522 67 74% 7.8
Administrator 2 0 2 480 64 70% 7.5
Qualified Social Worker 0 2 2 420 68 75% 6.1
Physical Therapy Aide 0 2 2 322 50 55% 6.3
Occupational Therapy Aide 0 3 3 97 18 20% 5.1
Mental Health Service Worker 1 0 1 68 9 10% 7.5
Medical Director 0 2 2 60 12 13% 2.5
Respiratory Therapy Technician 0 2 2 15 5 5% 3
46 Certified Nursing Assistant
% of Days 100%
24 Licensed Practical Nurse
% of Days 100%
13 Registered Nurse
% of Days 98%
6 Medication Aide/Technician
% of Days 100%
3 Speech Language Pathologist
% of Days 73%
4 Physical Therapy Assistant
% of Days 86%
1 Dietitian
% of Days 74%
2 Administrator
% of Days 70%
2 Qualified Social Worker
% of Days 75%
2 Physical Therapy Aide
% of Days 55%
3 Occupational Therapy Aide
% of Days 20%
1 Mental Health Service Worker
% of Days 10%
2 Medical Director
% of Days 13%
2 Respiratory Therapy Technician
% of Days 5%

Facility Characteristics

Source: CMS Long-Term Care Facility Characteristics (Data as of Jan 2026)

Total residents 77
Medicare
24
31.2% of residents
Medicaid
34
44.2% of residents
Private pay or other
19
24.7% of residents
Programs & Services
Residents Group

Residents meet regularly to discuss policies, care quality, and activities

Family Member Group

Family members meet regularly to discuss policies, care quality, and activities

Active Family Council

Organized group of family members that meets regularly to discuss facility policies, resident care, and activities.

Active Resident Council

Organized group of residents that meets regularly to discuss facility policies, quality of life, and activities.

Quality of care over time

These measures show how residents usually do over time at this home, based on health outcomes and preventive care.

High-risk clinical events score Info A composite score based on pressure ulcers, falls with injury, weight loss, walking ability decline, and activities of daily living decline. 4.1
52% better than Texas average

Texas average: 8.6

Functional decline score Info A composite score based on activities of daily living decline, walking ability decline, and incontinence. 6.0
62% better than Texas average

Texas average: 16.0

Long-stay resident measures
Significantly above average Info CMS star rating based on long-stay quality measure performance. 5 stars = significantly above average, 1 star = significantly below average.
Need for Help with Daily Activities Increased Info Percent of long-stay residents whose need for help with daily activities has increased 3.3%
80% better than Texas average

Texas average: 16.2%

Walking Ability Worsened Info Percent of long-stay residents whose ability to move independently worsened 9.5%
41% better than Texas average

Texas average: 16.2%

Low Risk Residents with Bowel/Bladder Incontinence Info Percent of low risk long-stay residents who lose control of their bowels or bladder 5.3%
66% better than Texas average

Texas average: 15.7%

Falls with Major Injury Info Percent of long-stay residents experiencing one or more falls with major injury 3.1%
In line with Texas average

Texas average: 3.2%

High Risk Residents with Pressure Ulcers Info Percent of long-stay high risk residents with pressure ulcers 4.7%
5% worse than Texas average

Texas average: 4.4%

Urinary Tract Infection Info Percent of long-stay residents with a urinary tract infection 0.0%
100% better than Texas average

Texas average: 0.8%

Lost Too Much Weight Info Percent of long-stay residents who lose too much weight 0.0%
100% better than Texas average

Texas average: 3.5%

Depressive Symptoms Info Percent of long-stay residents who have depressive symptoms 0.0%
100% better than Texas average

Texas average: 2.9%

Antipsychotic Use Info Percent of long-stay residents who received an antipsychotic medication 5.9%
26% better than Texas average

Texas average: 7.9%

Pneumococcal Vaccine Info Percent of long-stay residents assessed and appropriately given the pneumococcal vaccine 100.0%
In line with Texas average

Texas average: 97.3%

Influenza Vaccine Info Percent of long-stay residents assessed and appropriately given the seasonal influenza vaccine 98.6%
In line with Texas average

Texas average: 97.9%

Short-stay resident measures
Above average Info CMS star rating based on short-stay quality measure performance. 5 stars = much above average, 1 star = much below average.
Pneumococcal Vaccine Info Percent of short-stay residents assessed and appropriately given the pneumococcal vaccine 100.0%
11% better than Texas average

Texas average: 90.4%

Antipsychotic medication increase Info Percent of short-stay residents who newly received an antipsychotic medication 1.1%
27% better than Texas average

Texas average: 1.4%

Influenza Vaccine Info Percent of short-stay residents assessed and appropriately given the seasonal influenza vaccine 97.9%
11% better than Texas average

Texas average: 88.0%

Re-hospitalized after SNF stay Info Percentage of short-stay residents who were re-hospitalized after their nursing home admission. 18.3%
29% better than Texas average

Texas average: 25.9%

Emergency department visits Info Percentage of short-stay residents who had an outpatient emergency department visit. 9.1%
24% better than Texas average

Texas average: 12.0%

Falls with major injury Info Percentage of SNF residents who experience falls with major injury during their stay. 2.0%
160% worse than Texas average

Texas average: 0.8%

Ability to care for self at discharge Info Percentage of residents at or above expected ability to care for themselves at discharge. 56.4%
5% better than Texas average

Texas average: 53.7%

Successful return to home or community Info Rate of successful return to home or community from a skilled nursing facility. 60.5%
20% better than Texas average

Texas average: 50.6%

Penalties and fines

Federal penalties imposed by CMS for regulatory violations, including civil money penalties (fines) and denials of payment for new Medicare/Medicaid admissions.

Source: CMS Penalties Database (Data as of Jan 2026)

Total fines amount $160K
99% higher than Texas average

Texas average: $80K

Number of fines 5
101% more fines than Texas average

Texas average: 2.5

Payment Denials Info Serious action where Medicare and/or Medicaid temporarily stops payments for new residents until issues are fixed. 3
1261% more payment denials than Texas average

Texas average: 0.2

Fines amount comparison
This facility $160K
Texas average $80K
Penalty History

Penalties are imposed by CMS for violations of federal nursing home regulations.

6 penalties in the past 3 years

Multiple penalties were reported in the last 3 years.

Civil Money Penalty Info Fines imposed for noncompliance, which can be assessed per day or per instance of violation. Mar 19, 2025
$21K
Payment Denial Info Serious action where Medicare and/or Medicaid temporarily stops payments for new residents until issues are fixed. Mar 19, 2025
7 days
Civil Money Penalty Info Fines imposed for noncompliance, which can be assessed per day or per instance of violation. Nov 10, 2023
$36K
Payment Denial Info Serious action where Medicare and/or Medicaid temporarily stops payments for new residents until issues are fixed. Nov 10, 2023
5 days

Last updated: Jan 2026

Compare Nursing Home around College Station

The information below is reported by the Texas Health and Human Services Commission.

2 facilities compared · CMS & TX Dept. of Health data · Updated May 2026

Filter by care type
Fortress Nursing and Rehabilitation
NH

Nursing Home Licensed facility providing 24/7 skilled nursing care for residents with complex, ongoing medical needs. Staffed by RNs, LPNs, and CNAs. Inspected and star-rated annually by CMS. Accepts Medicare (short-term rehab) and Medicaid (long-term care).

RC

Respite Care Short-term temporary care — days to weeks — to give family caregivers a break. Full care provided during the stay. Often used after hospitalization or to trial a facility before a permanent placement decision.

College Station (Southwood Forest) 120 57.0% -10% 3.58 +11% -1% 2 31 2.6 9 60 32 - $7.0M $3.5M 49.6% 455589
Accel at College Station
NH

Nursing Home Licensed facility providing 24/7 skilled nursing care for residents with complex, ongoing medical needs. Staffed by RNs, LPNs, and CNAs. Inspected and star-rated annually by CMS. Accepts Medicare (short-term rehab) and Medicaid (long-term care).

College Station (Medical Avenue) 116 78.8% +24% 3.62 +56% 0% 5 48 2.8 11 73 23 Hmg Park Manor Of College Station LLC $13.4M $3.3M 24.2% 676437

Guides for Better Senior Living

Care Cost Calculator: See Prices in Your Area

Nursing Home Data Explorer

Don’t Wait Too Long: 7 Red Flag Signs Your Parent Needs Assisted Living Now

The True Cost of Assisted Living in 2025 – And How Families Are Paying For It

Understanding Senior Living Costs: Pricing Models, Discounts & Financial Assistance

Frequently Asked Questions about Accel at College Station

What neighborhood is Accel at College Station in?

Accel at College Station is in the Medical Avenue neighborhood.

Is Accel at College Station in a walkable area?

Accel at College Station has a walk score of 23. Car-dependent. Most errands require a car, with limited nearby walkable options.

What is the occupancy rate at Accel at College Station?

Accel at College Station's occupancy is 78.8%.

What is the address of Accel at College Station?

Accel at College Station is located at 1500 Medical Avenue, College Station, TX 77845.

What is the phone number of Accel at College Station?

(979) 272-1000 will put you in contact with the team at Accel at College Station.

Is Accel at College Station Medicare or Medicaid certified?

Yes — Accel at College Station is a CMS-certified provider of Medicare and Medicaid.

Explore Open Rooms
1 Contact details
2 What type of senior care service are you looking for?
3 What budget do you have in mind for senior care?
4 How soon do you need to find care?
5 Additional details

Thank you for your interest!

Our team will be in touch shortly to help with next steps.