Alexandria Care Center
Nursing Home, Hospice Care, Memory Care & Respite Care · Los Angeles, CA
CMS overall rating Info CMS (the Centers for Medicare & Medicaid Services) is the federal agency that rates nursing home quality. Its Overall Rating runs from 1 to 5 stars, combining health inspections, staffing, and quality measures, with inspections weighted most heavily.

Alexandria Care Center

Nursing Home, Hospice Care, Memory Care & Respite Care · Los Angeles, CA
CMS overall rating Info CMS (the Centers for Medicare & Medicaid Services) is the federal agency that rates nursing home quality. Its Overall Rating runs from 1 to 5 stars, combining health inspections, staffing, and quality measures, with inspections weighted most heavily.
Calculator: See prices in your area
Alexandria Care Center accepts Medicare, Medicaid, and private pay.

Overview of Alexandria Care Center

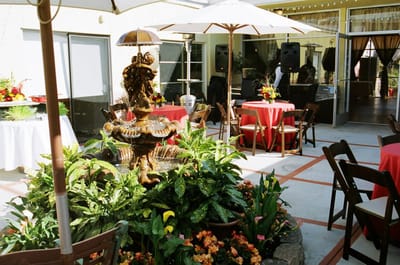
The Alexandria Care Center in Los Angeles is renowned for providing exceptional care to its residents with meticulous attention to detail and dedication. Their team of licensed nursing staff, psychosocial support, exceptional therapists, and a recreation specialist are only some of the excellent services they offer. In addition, the center takes great pride in serving authentic and mouth-watering dishes.

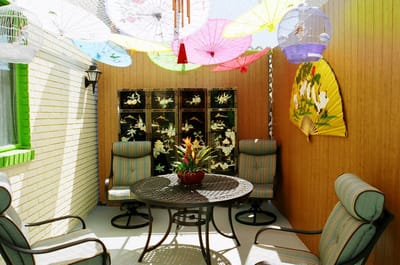
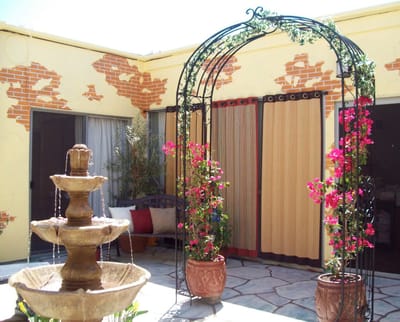
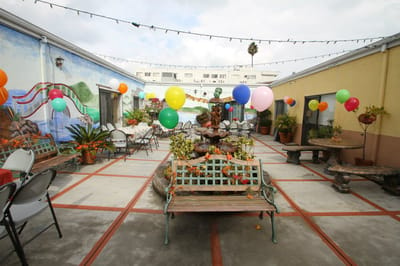
The facility has been serving the Armenian and Korean residents for over 15 years, focusing on their specific needs. They provide various amenities like lounge areas, garden and courtyard, housekeeping and laundry services, salon and barber services, pharmaceutical service, and much more. Its atmosphere is calm and refreshing, providing a welcoming environment that feels like home. This serene ambiance allows residents and visitors to create memories with newfound friends in a comfortable and relaxed haven.

(323) 660-1800

Quality ratings

Measured by Centers for Medicare & Medicaid Services (CMS)

Overall rating Info The Overall CMS Rating combines results from health inspections, staffing levels and quality measures. Health inspections carry the most weight. Staffing and quality scores can increase or decrease the final rating based on performance compared to state and national standards.
▼ 36.5% Below CA avg. ▼ 36.5% Below CA avg.CA average: 3.1Click the badge to see the full State ranking.Click here to see the full State ranking.
Health Inspection Info Based on the results of the facility's three most recent standard inspections and any complaint investigations. CMS reviews the number, scope, and severity of deficiencies, with more recent findings weighted more heavily.
▼ 64.2% Below CA avg. ▼ 64.2% Below CA avg.CA average: 2.8Click the badge to see the full State ranking.Click here to see the full State ranking.
Staffing Info Measures average nursing staff hours per resident per day, including Registered Nurses (RNs) and total nursing staff. Ratings are adjusted based on the level of care residents require and are compared to state and national benchmarks.
▲ 27.5% Above CA avg. ▲ 27.5% Above CA avg.CA average: 3.1Click the badge to see the full State ranking.Click here to see the full State ranking.
Quality Measures Info Based on clinical and physical health indicators reported to CMS, such as hospital readmissions, falls, pressure ulcers, and improvements in mobility. These measures reflect how well residents' health needs are being managed.
▲ 22.4% Above CA avg. ▲ 22.4% Above CA avg.CA average: 4.1Click the badge to see the full State ranking.Click here to see the full State ranking.

Staffing hours breakdown

Info Daily nursing hours per resident by staff type, reported to CMS. Higher is generally better — compare this facility to state and national averages to see where staffing stands.

Hours per resident per day — compared to California state averages

Total nursing care / resident Info This home is ranked 184th out of 354 homes in California for nurse hours. Total adjusted nursing hours per resident per day, combining RN, LPN, and aide time. CMS adjusts this for case-mix so facilities can be fairly compared.
3h 58m per day
Rank #184 / 354Nurse hours — State benchmarkedThis home is ranked 184th out of 354 homes in California. Shows adjusted nurse hours per resident per day benchmarked to the California average, with a ranking across 354 California facilities. More hours mean more direct care. The national average is about 3.5 hrs; below 3.0 is a red flag.Rankings are based only on facilities in California that report data for that category. Facilities without available data are excluded from the ranking.Click the rank badge to see the full State ranking.Click here to see the full State ranking.
This facility California avg (4h 13m per day)
vs California avg
-6%

6 of 6 metrics below state avg

Staff typeHours / Day / Residentvs state avg
Registered Nurse (RN) Info RNs hold the highest nursing license and can assess residents, interpret test results, and direct care plans. More RN hours per day often signals stronger clinical oversight and faster response to health changes. 28m per day ▼ 29% State avg: 39m per day · National avg: 41m per day
LPN / LVN Info Licensed Practical Nurses (LPNs) or Licensed Vocational Nurses (LVNs) deliver routine hands-on care — medication administration, wound dressing, and monitoring vital signs. They work under RN supervision and make up a large share of daily bedside care. 56m per day ▼ 23% State avg: 1h 13m per day · National avg: 52m per day
Nurse Aide Info Certified Nurse Aides (CNAs) provide the most direct day-to-day assistance: bathing, dressing, feeding, and mobility. Nurse aide hours are typically the largest staffing category and directly affect residents' quality of life. 2h 27m per day ▼ 7% State avg: 2h 38m per day · National avg: 2h 20m per day
Weekend Total Nursing Info Combined nursing hours (RN + LPN + Nurse Aide) per resident per day on weekends. Staffing often drops on weekends — this figure reveals whether the facility maintains adequate coverage outside of weekday hours. 3h 37m per day ▼ 12% State avg: 4h 5m per day · National avg: 3h 26m per day
Physical Therapist Info Hours per resident per day provided by licensed Physical Therapists (PTs) or PT Assistants. PT services help residents recover mobility after injury or illness and are especially important for post-acute (short-stay) rehabilitation. 5m per day ▼ 3% State avg: 5m per day · National avg: 4m per day
Weekend RN Info Registered nurse hours specifically on weekends. Facilities sometimes reduce RN presence on Saturdays and Sundays — a low weekend RN figure compared to weekday hours can indicate reduced clinical oversight when most administrative staff are absent. 21m per day ▼ 29% State avg: 30m per day · National avg: 28m per day

Capacity and availability

This home usually has limited availability

Higher occupancy than the California average: 84.7%
Occupancy rate
92.7% Rank #252 / 1537Occupancy rate — State benchmarkedThis home is ranked 252nd out of 1537 homes in California. Shows this facility's occupancy rate versus the California average, with its Statewide rank out of 1537. Higher occupancy signals strong local demand and financial stability.Rankings are based only on facilities in California that report data for that category. Facilities without available data are excluded from the ranking.Click the rank badge to see the full State ranking.Click here to see the full State ranking.
Avg. Length of Stay
106 days
Bed community size
177-bed community Rank #228 / 1657Bed count — State benchmarkedThis home is ranked 228th out of 1657 homes in California. Shows this facility's certified or reported bed count compared to other California facilities. Larger communities may offer more amenities, programs, and on-site services for residents and families.Rankings are based only on facilities in California that report data for that category. Facilities without available data are excluded from the ranking.Click the rank badge to see the full State ranking.Click here to see the full State ranking.
A large-scale community that may provide a wide range of amenities, services, and structured programs.
Years in operation
33 years in operation Rank #91 / 1487Years in operation — State benchmarkedThis home is ranked 91st out of 1487 homes in California. Shows how long this facility has been in operation compared to other California facilities. Longer operating histories may benefit residents, families, and staff.Rankings are based only on facilities in California that report data for that category. Facilities without available data are excluded from the ranking.Click the rank badge to see the full State ranking.Click here to see the full State ranking.
A longer operating history, which may indicate experience navigating regulations and delivering ongoing care.
Walk Score
Walk Score: 92 / 100 Rank #137 / 2092Walk Score — State benchmarkedThis home is ranked 137th out of 2092 homes in California. Shows how walkable this facility's neighborhood is compared to the average Walk Score across California facilities. Higher scores benefit residents, families, and staff.Rankings are based only on facilities in California that report data for that category. Facilities without available data are excluded from the ranking.Click the rank badge to see the full State ranking.Click here to see the full State ranking.
Walker's paradise. Daily errands do not require a car, with many shops and services nearby.

About this community

License Details

CMS Certification Number56113

Staffing

Key information about the people who lead and staff this community.

Leadership

ContactHolly Lanieri

Payment & Insurance

1 service
Accept Medicare

Therapy & Rehabilitation

1 service
Rehabilitation Services

Staffing & Medical

2 services
24-Hour Staffing
Staff-to-Resident Ratio: 3 to 1

Contact Alexandria Care Center

Inspection History

In California, the Department of Social Services (for assisted living facilities) and the Department of Public Health (for nursing homes) conduct inspections to ensure resident safety and regulatory compliance.

Since 2023 · 3 years of data 99 citations 21 total visits 8 complaint visits
Inspection Score Info A composite 0–100 score combining this facility's inspections, citations, complaints, and enforcement actions relative to the California state average. The score below shows how many points this facility sits above or below the typical California nursing home score (the benchmark); higher is better.

9 points below the California average for nursing homes (81/100)

Rank #1051 / 1401 in California Inspection Score — State benchmarked This home is ranked 1051st out of 1401 homes in California. Shows this facility's inspection score compared to the California average among 1401 comparable communities in the ranking pool. Rankings are based only on facilities in California that report data for that category. Facilities without available data are excluded from the ranking. Inspection score: 72 out of 100. Letter grade C-. 9 points below the California average for nursing homes (81/100)

Inspection Scorecard Info This scorecard compares key inspection, citation, and complaint metrics at this facility against the California state average. Metrics rated ≥15% worse than average are highlighted in red; those ≥15% better are highlighted in green.

Since 2023 vs. California state average
Overall vs. CA average 3 Worse Metrics worse than California average:
• Total citations (890% above)
• Citations per year (900% above)
• Citations per inspection (42% above)
3 Better Metrics better than California average:
• Total visits (50% below)
• Complaint visits (38% below)
• Other visits (100% below)
Latest Inspection January 28, 2026 Routine

Citations Info Citations are formal regulatory issues recorded during state inspections.

This FacilityCA Averagevs. CA Avg
Total citations Info Formal regulatory issues recorded by inspectors across all inspection types. 9910 This facility has 890% more total citations than a typical California nursing home (99 vs. CA avg 10).↑ 890% worse
Citations per year Info Average citations per year since 2023. 333.3 This facility has 900% more citations per year than a typical California nursing home (33 vs. CA avg 3.3).↑ 900% worse
Citations per inspection Info Average citations per inspection. 4.73.3 This facility has 42% more citations per inspection than a typical California nursing home (4.7 vs. CA avg 3.3).↑ 42% worse

Inspections & Visits Info State inspections evaluate whether the facility meets health and safety standards.

This FacilityCA Averagevs. CA Avg
Total visits Info Combined count of complaint visits, other regulatory visits, and official scheduled inspections. 816 This facility has 50% fewer total visits than a typical California nursing home (8 vs. CA avg 16).↓ 50% better
Complaint visits Info On-site visits triggered by formal complaints filed by residents, families, or staff. 813 This facility has 38% fewer complaint visits than a typical California nursing home (8 vs. CA avg 13).↓ 38% better
Other visits Info Regulatory visits that are neither routine inspections nor complaint investigations — administrative check-ins, follow-up reviews, licensing-related visits. 07 This facility has 100% fewer other visits than a typical California nursing home (0 vs. CA avg 7).↓ 100% better

Health Inspection History

Inspections since 2024
Total health inspections 19

California average 12.5


Last Health inspection on Jul 2025

Total health citations
104 Rank #346 / 361Health citations — State benchmarkedThis home is ranked 346th out of 361 homes in California. Shows this facility's total health deficiency citations benchmarked to the California State average, with a ranking across all 361 CA facilities. Lower citation counts earn a better rank.Rankings are based only on facilities in California that report data for that category. Facilities without available data are excluded from the ranking.Click the rank badge to see the full State ranking.Click here to see the full State ranking.

California average 50.2

Citations per inspection
5.47 Rank #277 / 361Citations per inspection — State benchmarkedThis home is ranked 277th out of 361 homes in California. Shows average deficiency citations per CMS inspection for this facility versus the California mean across 361 facilities with citation data. Lower is better.Rankings are based only on facilities in California that report data for that category. Facilities without available data are excluded from the ranking.Click the rank badge to see the full State ranking.Click here to see the full State ranking.

California average 4.65


Health citations are formal notices following inspections when they fail to comply with safety and care standards.

72 of 104 citations resulted from standard inspections; and 28 of 104 resulted from complaint investigations.

Breakdown of citation severity (last 2 years)
Critical health citations
0
100% better than California average

California average: 0.4


Serious health citations
0
100% better than California average

California average: 1

0 critical citations California average: 0.4

0 serious citations California average: 1

99 moderate citations California average: 47.2

5 minor citations California average: 1.5
Citations history (last 2 years)
Environmental moderate citation Jul 28, 2025
Corrected

Quality of Care moderate citation Jul 28, 2025
Corrected

Pharmacy moderate citation Apr 01, 2025
Corrected

Quality of Care moderate citation Apr 01, 2025
Corrected

Staffing Data

Reporting period: October 1 – December 31, 2025 (Q4 2025). Source: CMS Payroll-Based Journal report.

Total staff 199
Employees 161
Contractors 38
Staff to resident ratio 1.26 : 1
30% fewer staff per resident than California average
California average ratio: 1.81 : 1 California average ratio: 1.81 : 1See full California ranking
Avg staff/day 101
Average shift 7.4 hours
0% compared with California average
California average: 7.7 hours California average shift: 7.7 hoursSee full California ranking
Total staff hours (quarter) 69,023

Nursing staff breakdown

Q4 2025 · Oct 1 – Dec 31 More info This data comes from the CMS Payroll-Based Journal report covering October 1 – December 31, 2025.
Registered Nurse

Manages medical care and health needs.

RN Staff Info All 19 RN Staff are full-time employees. No contractors work on this role. 19
Average shift length Info Average shift length. Calculated as total hours divided by days worked and average staff per day. 7.6 hours
Licensed Practical Nurse

Assists with medical care and medications.

LPN Staff Info All 31 LPN Staff are full-time employees. No contractors work on this role. 31
Average shift length Info Average shift length. Calculated as total hours divided by days worked and average staff per day. 7.8 hours
Certified Nursing Assistant

Helps with daily care and mobility.

CNA Staff Info All 93 CNA Staff are full-time employees. No contractors work on this role. 93
Average shift length Info Average shift length. Calculated as total hours divided by days worked and average staff per day. 7.4 hours

Contractor staffing

Q4 2025 · Oct 1 – Dec 31 More info This data comes from the CMS Payroll-Based Journal report covering October 1 – December 31, 2025.

Total hours from contractors

8.8%

6,058 contractor hours this quarter

Speech Language Pathologist: 9 Physical Therapy Assistant: 8 Respiratory Therapy Technician: 8 Physical Therapy Aide: 7 Qualified Social Worker: 4 Medical Director: 1 Occupational Therapy Assistant: 1

Staff by category

Q4 2025 · Oct 1 – Dec 31 More info This data comes from the CMS Payroll-Based Journal report covering October 1 – December 31, 2025.
Certified Nursing Assistant9309337,02592100%7.4
Licensed Practical Nurse3103111,75392100%7.8
Registered Nurse190195,86792100%7.6
Other Dietary Services Staff6062,55992100%7.8
RN Director of Nursing5052,3618188%8.2
Physical Therapy Aide0771,6489199%6.7
Speech Language Pathologist0991,4869199%5.9
Dental Services Staff3031,3668997%8
Respiratory Therapy Technician0881,22492100%7
Physical Therapy Assistant0889298087%7.1
Qualified Social Worker0446368592%4.7
Clinical Nurse Specialist1015376470%8.4
Nurse Practitioner1015206571%8
Occupational Therapy Aide1015046368%8
Administrator1014725964%8
Occupational Therapy Assistant0111041617%6.5
Medical Director0113067%5
93 Certified Nursing Assistant
% of Days 100%
31 Licensed Practical Nurse
% of Days 100%
19 Registered Nurse
% of Days 100%
6 Other Dietary Services Staff
% of Days 100%
5 RN Director of Nursing
% of Days 88%
7 Physical Therapy Aide
% of Days 99%
9 Speech Language Pathologist
% of Days 99%
3 Dental Services Staff
% of Days 97%
8 Respiratory Therapy Technician
% of Days 100%
8 Physical Therapy Assistant
% of Days 87%
4 Qualified Social Worker
% of Days 92%
1 Clinical Nurse Specialist
% of Days 70%
1 Nurse Practitioner
% of Days 71%
1 Occupational Therapy Aide
% of Days 68%
1 Administrator
% of Days 64%
1 Occupational Therapy Assistant
% of Days 17%
1 Medical Director
% of Days 7%

Penalties and fines

Federal penalties imposed by CMS for regulatory violations, including civil money penalties (fines) and denials of payment for new Medicare/Medicaid admissions.

Source: CMS Penalties Database

No penalties in the past 3 years

No civil money penalties or payment denials were reported in the last 3 years.

Quality of care over time

These measures show how residents usually do over time at this home, based on health outcomes and preventive care.

High-risk clinical events score Info A composite score based on pressure ulcers, falls with injury, weight loss, walking ability decline, and activities of daily living decline. 4.3
35% better than California average

California average: 6.6

Functional decline score Info A composite score based on activities of daily living decline, walking ability decline, and incontinence. 6.3
45% better than California average

California average: 11.3

Long-stay resident measures
Significantly above average California avg: 4.2 Info CMS star rating based on long-stay quality measure performance. 5 stars = significantly above average, 1 star = significantly below average.
Need for Help with Daily Activities Increased Info Percent of long-stay residents whose need for help with daily activities has increased 4.5%
59% better than California average

California average: 11.1%

Walking Ability Worsened Info Percent of long-stay residents whose ability to move independently worsened 6.1%
49% better than California average

California average: 12.0%

Low Risk Residents with Bowel/Bladder Incontinence Info Percent of low risk long-stay residents who lose control of their bowels or bladder 8.1%
28% better than California average

California average: 11.3%

Falls with Major Injury Info Percent of long-stay residents experiencing one or more falls with major injury 1.9%
13% worse than California average

California average: 1.7%

High Risk Residents with Pressure Ulcers Info Percent of long-stay high risk residents with pressure ulcers 3.8%
23% better than California average

California average: 5.0%

Urinary Tract Infection Info Percent of long-stay residents with a urinary tract infection 0.8%
39% better than California average

California average: 1.2%

Lost Too Much Weight Info Percent of long-stay residents who lose too much weight 5.2%
23% worse than California average

California average: 4.2%

Depressive Symptoms Info Percent of long-stay residents who have depressive symptoms 3.3%
51% better than California average

California average: 6.7%

Antipsychotic Use Info Percent of long-stay residents who received an antipsychotic medication 12.0%
19% worse than California average

California average: 10.1%

Pneumococcal Vaccine Info Percent of long-stay residents assessed and appropriately given the pneumococcal vaccine 100.0%
In line with California average

California average: 98.5%

Influenza Vaccine Info Percent of long-stay residents assessed and appropriately given the seasonal influenza vaccine 100.0%
In line with California average

California average: 98.2%

Hospitalizations per 1,000 days Info Number of hospitalizations per 1,000 long-stay resident days. 1.61
28% better than California average

California average: 2.25

ED visits per 1,000 days Info Number of outpatient emergency department visits per 1,000 long-stay resident days. 0.54
66% better than California average

California average: 1.59

Short-stay resident measures
Average California avg: 3.5 Info CMS star rating based on short-stay quality measure performance. 5 stars = much above average, 1 star = much below average.
Pneumococcal Vaccine Info Percent of short-stay residents assessed and appropriately given the pneumococcal vaccine 99.7%
6% better than California average

California average: 94.0%

Antipsychotic medication increase Info Percent of short-stay residents who newly received an antipsychotic medication 0.2%
87% better than California average

California average: 1.5%

Influenza Vaccine Info Percent of short-stay residents assessed and appropriately given the seasonal influenza vaccine 98.7%
6% better than California average

California average: 93.2%

Re-hospitalized after SNF stay Info Percentage of short-stay residents who were re-hospitalized after their nursing home admission. 25.6%
10% worse than California average

California average: 23.2%

Emergency department visits Info Percentage of short-stay residents who had an outpatient emergency department visit. 5.6%
50% better than California average

California average: 11.2%

Falls with major injury Info Percentage of SNF residents who experience falls with major injury during their stay. 0.9%
22% worse than California average

California average: 0.8%

Ability to care for self at discharge Info Percentage of residents at or above expected ability to care for themselves at discharge. 39.1%
27% worse than California average

California average: 53.7%

Successful return to home or community Info Rate of successful return to home or community from a skilled nursing facility. 40.4%
20% worse than California average

California average: 50.6%

Breakdown by payment type

Medicare

15% of new residents, usually for short-term rehab.

Typical stay 2 months

Private pay

71% of new residents, often for short stays.

Typical stay 22 days

Medicaid

13% of new residents, often for long-term daily care.

Typical stay 2 years

Facility Characteristics

Source: CMS Long-Term Care Facility Characteristics (Data as of Jan 2026)

Total residents 158
Medicare
18
11.4% of residents
Medicaid
123
77.8% of residents
Private pay or other
17
10.8% of residents
Programs & Services
Residents Group

Residents meet regularly to discuss policies, care quality, and activities

Active Resident Council

Organized group of residents that meets regularly to discuss facility policies, quality of life, and activities.

Finances and operations

Based on CMS SNF Cost Report for fiscal year ending in 12/2023.

Privately-owned community
Operated by a single business entity.
Net patient revenue Info Net patient revenue — what the home actually collects for resident care, after contractual allowances, bad debt and discounts are subtracted from its gross charges (CMS cost report, Worksheet G-3). It covers resident care only; money the home earns from other sources is shown separately as "Other income."
$21.7M
Net patient income Info Net patient income: net patient revenue minus the home's total operating expenses. A positive figure means it earns more from resident care than it spends to deliver it; a negative figure means the opposite. It excludes non-operating "other income."
$862.2K
Privately-owned community Operated by a single business entity.
Net patient revenue Info Net patient revenue — what the home actually collects for resident care, after contractual allowances, bad debt and discounts are subtracted from its gross charges (CMS cost report, Worksheet G-3). It covers resident care only; money the home earns from other sources is shown separately as "Other income."
$21.7M Rank #63 / 355Revenue — State benchmarkedThis home is ranked 63rd out of 355 homes in California. Shows this facility's annual revenue compared to the California average. Higher revenue generally means more resources for staffing and capital — read alongside Payroll %.Rankings are based only on facilities in California that report data for that category. Facilities without available data are excluded from the ranking.Click the rank badge to see the full State ranking.Click here to see the full State ranking.
Net patient income Info Net patient income: net patient revenue minus the home's total operating expenses. A positive figure means it earns more from resident care than it spends to deliver it; a negative figure means the opposite. It excludes non-operating "other income."
$862.2K
Other income Info Money the home earns outside of resident care — such as investments, grants, rentals and other non-operating sources (CMS cost report, Worksheet G-3). It is tracked separately from net patient revenue: it is not part of that figure, and it is not included in net patient income.
$206.0K
Payroll costs Info Staff salaries plus wage-related costs — benefits such as payroll taxes, health insurance and retirement — from the home's own accounting records (CMS cost report, Worksheet A). Contract or agency labor is counted separately, under other operating costs. Rank #92 / 355Payroll — State benchmarkedThis home is ranked 92nd out of 355 homes in California. Shows total annual staff payroll benchmarked to the California average. Higher payroll investment relative to peers often signals better staffing and less reliance on cheaper contract labor.Rankings are based only on facilities in California that report data for that category. Facilities without available data are excluded from the ranking.Click the rank badge to see the full State ranking.Click here to see the full State ranking.
$11.2M 51.6% of net patient revenue Info Payroll as a share of revenue: staff salaries and wage-related benefits divided by net patient revenue. A higher figure means more of each revenue dollar goes to staff pay. Rank #303 / 355Payroll % — State benchmarkedThis home is ranked 303rd out of 355 homes in California. Shows payroll as a percentage of revenue versus the California average. Well-run California facilities typically land around 56–67% — the top third Statewide. Below 25% may signal understaffing or heavy agency use — read with Staffing ratings.Rankings are based only on facilities in California that report data for that category. Facilities without available data are excluded from the ranking.Click the rank badge to see the full State ranking.Click here to see the full State ranking.
Other operating costs Info Everything it costs to run the home apart from payroll — food, utilities, supplies, maintenance, contract labor and administration. Calculated as total operating expense minus payroll (staff salaries and wage-related benefits).
$9.6M
Total costs Info The home's total operating expense for the year — all the costs of running it, salaries included (CMS cost report, Worksheet G-3).
$20.8M

What does this home offer?

Building type icon
Building type icon

Building Type: Single-story

Who this home usually serves

TYPE OF STAY

Primarily short stays

Residents typically stay for brief periods, with frequent admissions and discharges throughout the year.

Most new residents arrive under private pay (71% of admissions), and a typical private pay stay runs around 22 days.

Admissions
519 total

Coverage residents most often arrive under.

Medicare 15%
Private pay 71%
Medicaid 13%
Discharges
563 total

Coverage residents most often leave under.

Medicare 15%
Private pay 53%
Medicaid 33%

Places of interest near Alexandria Care Center

Address 5.6 miles from city center Info Estimated distance in miles from Los Angeles's city center to Alexandria Care Center's address, calculated via Google Maps. — 0.49 miles to nearest hospital (Hollywood Presbyterian Medical Center)

Calculate Travel Distance to Alexandria Care Center

Add your location

Address

Compare Nursing Homes around Los Angeles

The information below is reported by the California Department of Social Services and Department of Public Health.

5 facilities compared · CMS & CA Dept. of Health data

Angels Nursing Center
NH
NC
Los Angeles (Westlake)
41
Facility 41
CA AVG 103
Rank #1205 / 1657
90.2%
Facility 90.2%
CA AVG 84.7%
Rank #319 / 1537
+7%
4.73
Facility 4.73
CA AVG 4.22
Rank #69 / 354
-54%+12%
$71.6k
Facility $71.6k
CA AVG $56.5k
Rank #329 / 362
60
Facility 60
CA AVG 81
Rank #1294 / 1401
42
Facility 42
CA AVG 50.2
Rank #184 / 361
3.8
Facility 3.8
CA AVG 4.6
Rank #152 / 361
437A+
92
Facility 92
CA AVG 57
Rank #137 / 2092
Aret Akian
$5.8M
Facility $5.8M
CA AVG $17.0M
Rank #348 / 355
$3.8M
Facility $3.8M
CA AVG $7.0M
Rank #323 / 355
65.6%
Facility 65.6%
CA AVG 45.2%
Rank #5 / 355
55704
Palazzo Post Acute
NH
Los Angeles (East Hollywood)
99
Facility 99
CA AVG 103
Rank #725 / 1657
91.6%
Facility 91.6%
CA AVG 84.7%
Rank #276 / 1537
+8%
4.46
Facility 4.46
CA AVG 4.22
Rank #92 / 354
-25%+6%
$0
Facility $0
CA AVG $56.5k
Rank #1 / 362
-
47
Facility 47
CA AVG 50.2
Rank #214 / 361
2.5
Facility 2.5
CA AVG 4.6
Rank #33 / 361
193A+
91
Facility 91
CA AVG 57
Rank #155 / 2092
Serrano Licensee 1 LLC
$13.0M
Facility $13.0M
CA AVG $17.0M
Rank #160 / 355
$8.5M
Facility $8.5M
CA AVG $7.0M
Rank #178 / 355
65.1%
Facility 65.1%
CA AVG 45.2%
Rank #208 / 355
56456
Grand Park Convalescent Hospital
NH
Los Angeles (Westlake)
151
Facility 151
CA AVG 103
Rank #339 / 1657
87.3%
Facility 87.3%
CA AVG 84.7%
Rank #401 / 1537
+3%- -20%-
$0
Facility $0
CA AVG $56.5k
Rank #1 / 362
-
36
Facility 36
CA AVG 50.2
Rank #148 / 361
4.0
Facility 4.0
CA AVG 4.6
Rank #169 / 361
-145A+
97
Facility 97
CA AVG 57
Rank #29 / 2092
Barry Kohn
$18.9M
Facility $18.9M
CA AVG $17.0M
Rank #43 / 355
$10.4M
Facility $10.4M
CA AVG $7.0M
Rank #82 / 355
55.1%
Facility 55.1%
CA AVG 45.2%
Rank #318 / 355
56244
Fountainview at Eisenberg Village
NH
AL
IL
Reseda
216
Facility 216
CA AVG 103
Rank #126 / 1657
48.1%
Facility 48.1%
CA AVG 84.7%
Rank #1389 / 1537
-43%
2.96
Facility 2.96
CA AVG 4.22
Rank #351 / 354
+1%-30%
$0
Facility $0
CA AVG $56.5k
Rank #1 / 362
89
Facility 89
CA AVG 81
Rank #461 / 1401
66
Facility 66
CA AVG 50.2
Rank #289 / 361
3.9
Facility 3.9
CA AVG 4.6
Rank #161 / 361
-90-
49
Facility 49
CA AVG 57
Rank #1370 / 2092
Karen Pham
$16.7M
Facility $16.7M
CA AVG $17.0M
Rank #153 / 355
$8.5M
Facility $8.5M
CA AVG $7.0M
Rank #154 / 355
50.6%
Facility 50.6%
CA AVG 45.2%
Rank #189 / 355
555716
Alexandria Care Center
NH
HC
MC
RC
Los Angeles (East Hollywood)
177
Facility 177
CA AVG 103
Rank #228 / 1657
92.7%
Facility 92.7%
CA AVG 84.7%
Rank #252 / 1537
+9%
3.96
Facility 3.96
CA AVG 4.22
Rank #184 / 354
+7%-6%
$0
Facility $0
CA AVG $56.5k
Rank #1 / 362
72
Facility 72
CA AVG 81
Rank #1051 / 1401
104
Facility 104
CA AVG 50.2
Rank #346 / 361
5.5
Facility 5.5
CA AVG 4.6
Rank #277 / 361
-164-
92
Facility 92
CA AVG 57
Rank #137 / 2092
Magnolia Health Management I LLC
$21.7M
Facility $21.7M
CA AVG $17.0M
Rank #63 / 355
$11.2M
Facility $11.2M
CA AVG $7.0M
Rank #92 / 355
51.6%
Facility 51.6%
CA AVG 45.2%
Rank #303 / 355
56113

Financial Assistance for
Nursing Home in California

Alexandria Care Center is located in Los Angeles, California.
Here are the financial assistance programs available to residents in California.

Get Financial aid guidance

Multipurpose Senior Services Program

MSSP (Medi-Cal Waiver)

Age 65+
General California resident, Medi-Cal eligible, nursing home risk.
Income Limits (2025) ~$2,829/month 300% FBR, individual
Asset Limits $2,000 (individual), $3,000 (couple).
CA

County-managed; waitlists possible.

Benefits
In-home support (4-6 hours/day) Respite care (14 days/year) Meals (~$6/meal) Transportation (8 trips/month) Care management

In-Home Supportive Services (IHSS)

California IHSS

Age 65+
General California resident, Medicaid-eligible or low-income.
Income Limits ~$1,732/month individual, Medi-Cal threshold
Asset Limits $2,000 individual
CA

Can hire family as caregivers.

Benefits
Personal care (up to 283 hours/month) Homemaker services Respite (varies)

Multipurpose Senior Services Program (MSSP)

CA MSSP

Age 65+
General California resident, Medi-Cal-eligible, nursing home-eligible but community-capable.
Income Limits ~$2,829/month 300% FBR, individual
Asset Limits $2,000 individual
CA

Available in 38 counties; waitlists common.

Benefits
Case management Respite care (up to 10 days/year) Minor home mods (avg. $500) Adult day care (~$50/day)

Property Tax Postponement Program (PTP)

CA PTP

Age 62+
General California resident, own and live in home, 40% equity.
Income Limits (2025) ~$51,500/year household, adjusted annually
Asset Limits Equity-based; no strict asset cap.
CA

Deferred taxes accrue interest (5% as of 2024); repaid upon sale/death.

Benefits
Property tax deferral (avg. $1,000-$3,000/year, varies by county)

Assisted Living Waiver (ALW)

CA ALW

Age 65+ or disabled
General California resident, Medi-Cal-eligible, nursing home-eligible.
Income Limits ~$2,829/month 300% FBR, individual
Asset Limits $2,000 individual
CA

Available in 15 counties (e.g., LA, Sacramento); waitlists common.

Benefits
Personal care in ALFs (5-7 hours/day) Medication management Social services

California CARES Program

CA CARES

Age
General Caregivers of California residents 60+ needing help with 3+ daily activities; no caregiver age limit.
Income Limits No strict limit; cost-sharing above ~$2,500/month threshold.
Asset Limits Not applicable; need-based.
CA

High demand in urban areas; complements IHSS respite.

Benefits
Respite care (up to 10 days/year) Counseling (4-6 sessions/year) Training (2-3 workshops/year) Supplies (~$200/year)

Frequently Asked Questions about Alexandria Care Center

What neighborhood is Alexandria Care Center in?

Alexandria Care Center is in the East Hollywood neighborhood of Los Angeles.

Is Alexandria Care Center in a walkable area?

Alexandria Care Center has a walk score of 92. Walker's paradise. Daily errands do not require a car, with many shops and services nearby.

What is the occupancy rate at Alexandria Care Center?

Alexandria Care Center's occupancy is 92.7%.

Are there photos of Alexandria Care Center?

Yes — there are 11 photos of Alexandria Care Center in the photo gallery on this page.

What is the address of Alexandria Care Center?

Alexandria Care Center is located at 1515 Alexandria Ave, Los Angeles, CA 90027.

What is the phone number of Alexandria Care Center?

(323) 660-1800 will put you in contact with the team at Alexandria Care Center.

Is Alexandria Care Center Medicare or Medicaid certified?

Yes — Alexandria Care Center is a CMS-certified provider of Medicare and Medicaid.

Guides for Better Senior Living

Care Cost Calculator: See Prices in Your Area

Nursing Home Data Explorer

Don’t Wait Too Long: 7 Red Flag Signs Your Parent Needs Assisted Living Now

The True Cost of Assisted Living in 2025 – And How Families Are Paying For It

Understanding Senior Living Costs: Pricing Models, Discounts & Financial Assistance