


Total health inspections
9
California average 12.5
Last Health inspection on Jul 2025
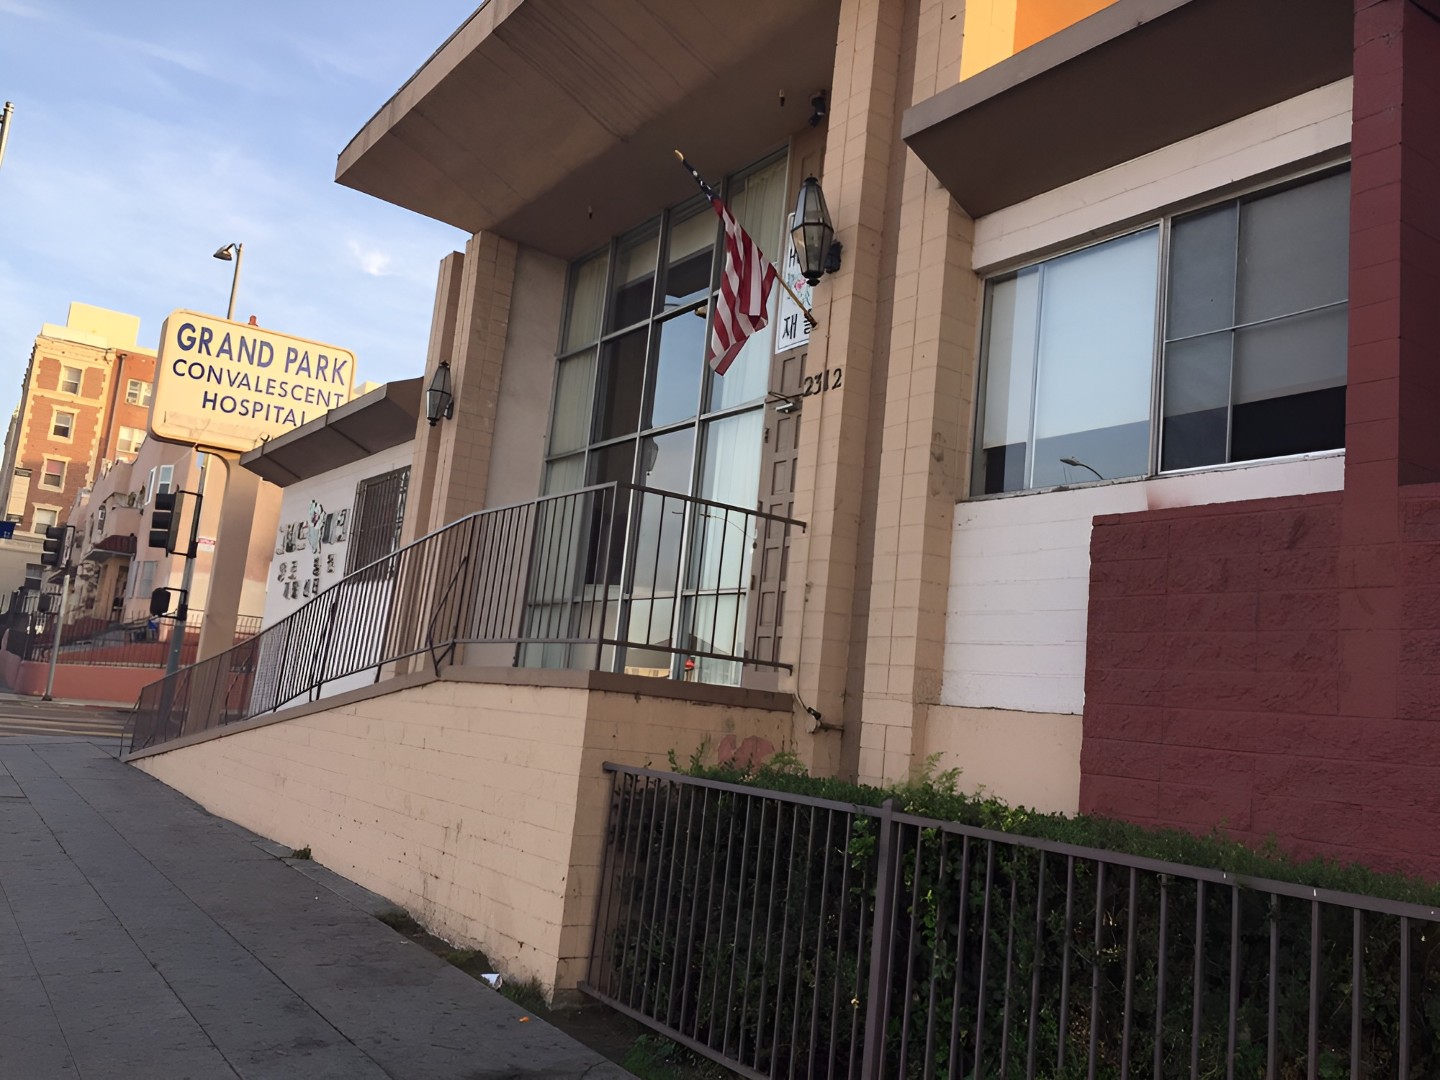
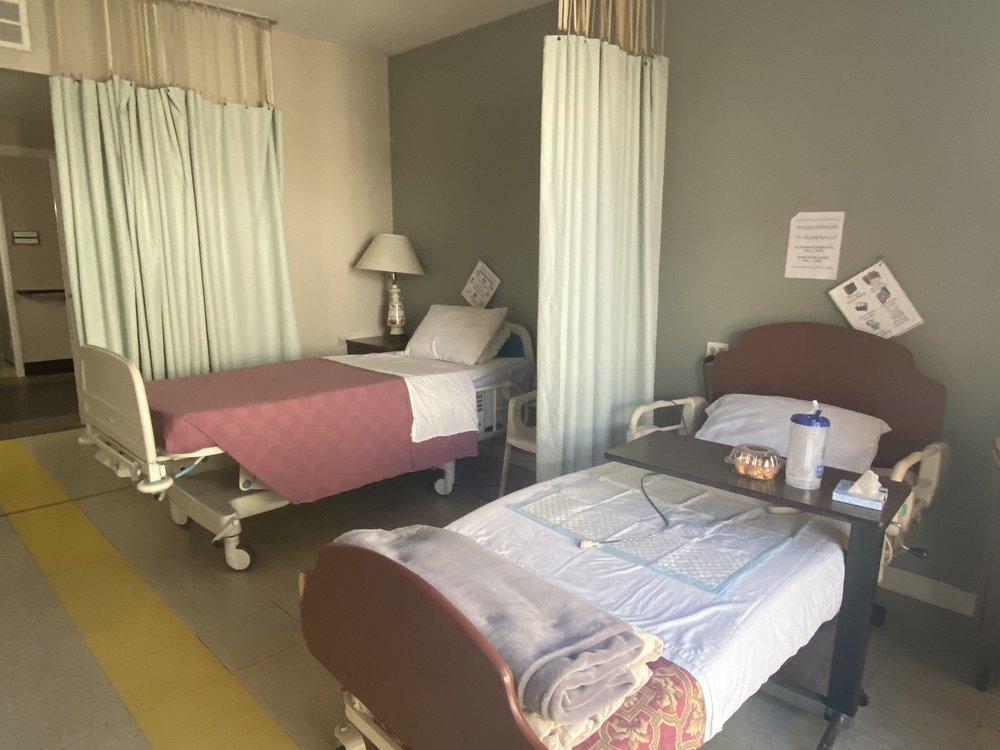
Experience top-notch care at Grand Park Convalescent Hospital, an award-winning community in Los Angeles, CA, offering long-term care and short-term care. 151 purposely built and spacious accommodations are provided, alongside personalized care, ensuring residents’ comfort and safety. Here, Medicare and Medicaid are accepted to ease residents’ financial burdens.
With a jam-packed calendar of engaging activities and enriching programs, residents are encouraged to live actively and maintain social connections. Residents enjoy a delightful dining experience with delicious and well-balanced dining options that cater to their dietary needs and preferences. With its exceptional care and state-of-the-art amenities, the community strives to help residents make the most of their best years.
| Staff type | Hours / Day / Resident | vs state avg |
|---|---|---|
|
Registered Nurse (RN)
| 26m per day | ▼ 33% State avg: 39m per day · National avg: 41m per day |
|
LPN / LVN
| 58m per day | ▼ 21% State avg: 1h 13m per day · National avg: 52m per day |
|
Nurse Aide
| 2h 55m per day | ▲ 10% State avg: 2h 39m per day · National avg: 2h 21m per day |
|
Weekend Total Nursing
| 3h 49m per day | ▼ 7% State avg: 4h 5m per day · National avg: 3h 26m per day |
|
Physical Therapist
| 13m per day | ▲ 152% State avg: 5m per day · National avg: 4m per day |
|
Weekend RN
| 20m per day | ▼ 32% State avg: 30m per day · National avg: 29m per day |
In California, the Department of Social Services (for assisted living facilities) and the Department of Public Health (for nursing homes) conduct inspections to ensure resident safety and regulatory compliance.
California average 12.5
Last Health inspection on Jul 2025
California average 50.2
California average 4.65
Health citations are formal notices following inspections when they fail to comply with safety and care standards.
30 of 36 citations resulted from standard inspections; and 6 of 36 resulted from complaint investigations.
California average: 0.4
California average: 1
Reporting period: October 1 – December 31, 2025 (Q4 2025). Source: CMS Payroll-Based Journal report.
Manages medical care and health needs.
Assists with medical care and medications.
Helps with daily care and mobility.
Total hours from contractors
13,082 contractor hours this quarter
| Certified Nursing Assistant | 92 | 0 | 92 | 38,965 | 92 | 100% | 7.4 |
| Licensed Practical Nurse | 29 | 0 | 29 | 12,281 | 92 | 100% | 7.8 |
| Registered Nurse | 13 | 1 | 14 | 5,159 | 92 | 100% | 8.3 |
| Physical Therapy Aide | 0 | 9 | 9 | 2,994 | 86 | 93% | 7.5 |
| Other Dietary Services Staff | 7 | 0 | 7 | 2,965 | 92 | 100% | 7.7 |
| Respiratory Therapy Technician | 0 | 8 | 8 | 2,805 | 90 | 98% | 6.8 |
| Therapeutic Recreation Specialist | 0 | 8 | 8 | 2,567 | 91 | 99% | 7.8 |
| Speech Language Pathologist | 0 | 7 | 7 | 2,136 | 89 | 97% | 6.7 |
| Physical Therapy Assistant | 1 | 6 | 7 | 1,758 | 83 | 90% | 7.1 |
| Qualified Social Worker | 0 | 4 | 4 | 618 | 90 | 98% | 4.5 |
| Dental Services Staff | 2 | 0 | 2 | 551 | 61 | 66% | 6.2 |
| Occupational Therapy Aide | 1 | 0 | 1 | 544 | 68 | 74% | 8 |
| RN Director of Nursing | 1 | 0 | 1 | 536 | 67 | 73% | 8 |
| Administrator | 1 | 0 | 1 | 515 | 64 | 70% | 8 |
| Nurse Practitioner | 1 | 0 | 1 | 492 | 64 | 70% | 7.7 |
| Mental Health Service Worker | 1 | 0 | 1 | 442 | 56 | 61% | 7.9 |
| Dietitian | 1 | 0 | 1 | 392 | 48 | 52% | 8.2 |
| Clinical Nurse Specialist | 0 | 2 | 2 | 164 | 51 | 55% | 3.2 |
| Feeding Assistant | 0 | 1 | 1 | 52 | 13 | 14% | 4 |
| Medical Director | 0 | 1 | 1 | 26 | 13 | 14% | 2 |
Federal penalties imposed by CMS for regulatory violations, including civil money penalties (fines) and denials of payment for new Medicare/Medicaid admissions.
Source: CMS Penalties Database
No penalties in the past 3 years
No civil money penalties or payment denials were reported in the last 3 years.
These measures show how residents usually do over time at this home, based on health outcomes and preventive care.
California average: 6.6
California average: 11.3
California average: 11.1%
California average: 12.0%
California average: 11.3%
California average: 1.7%
California average: 5.0%
California average: 1.2%
California average: 4.2%
California average: 6.7%
California average: 10.1%
California average: 98.5%
California average: 98.2%
California average: 2.25
California average: 1.59
California average: 94.0%
California average: 1.5%
California average: 93.2%
California average: 23.2%
California average: 11.2%
California average: 0.8%
California average: 53.7%
California average: 50.6%
Quality measures are calculated from Minimum Data Set (MDS) assessments. For most measures, lower percentages indicate better care quality.
45% of new residents, usually for short-term rehab.
18% of new residents, often for short stays.
36% of new residents, often for long-term daily care.
Source: CMS Long-Term Care Facility Characteristics (Data as of Jan 2026)
Residents meet regularly to discuss policies, care quality, and activities
State-approved Nurse Aide Training and Competency Evaluation Program on-site
Part of a Continuing Care Retirement Community offering multiple care levels
Organized group of residents that meets regularly to discuss facility policies, quality of life, and activities.
Data sourced from CMS Long-Term Care Facility Characteristics quarterly report. Payer mix reflects the current resident census by primary payment source.
Historical financial and operational data for Grand Park Convalescent Hospital from 2011–2023, based on CMS SNF Cost Reports.
Key figures below are for fiscal year ending in 12/2023.
Based on CMS SNF Cost Report for fiscal year ending in 12/2023.
Housing Options: Semi-Private / Shared Rooms
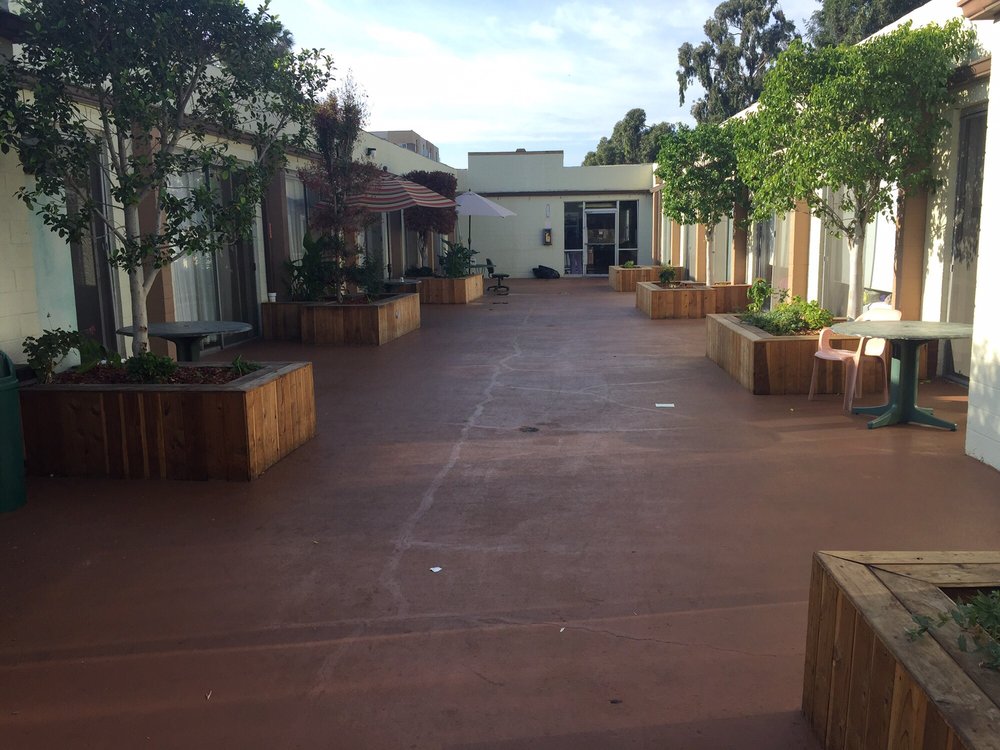
Building Type: Single-story
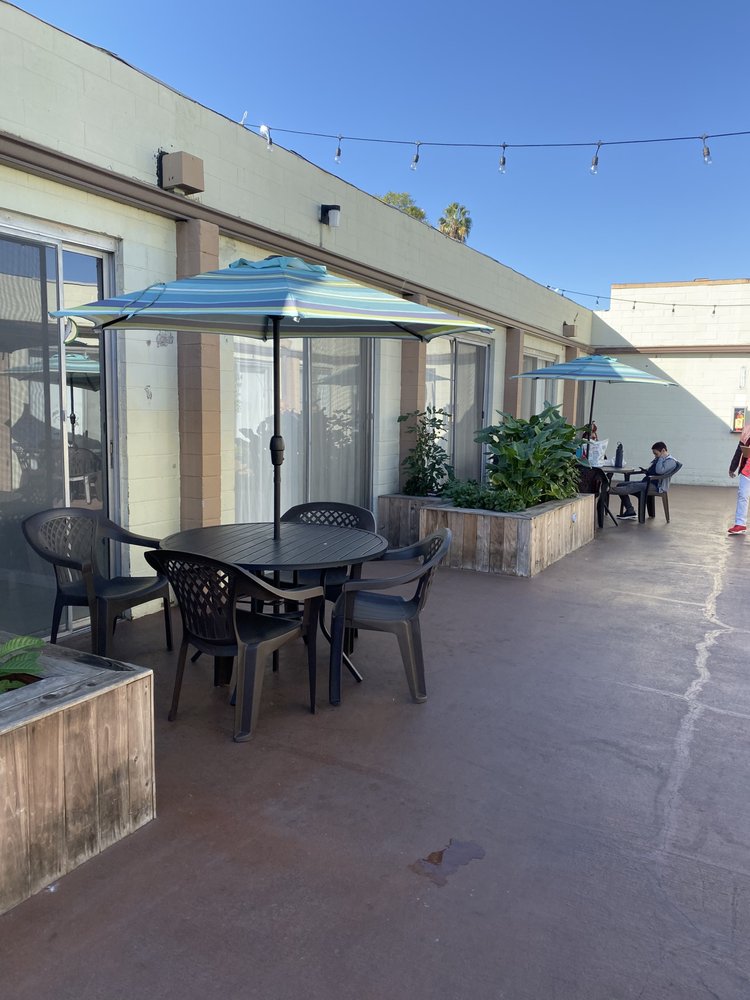
Social and Recreational Activities

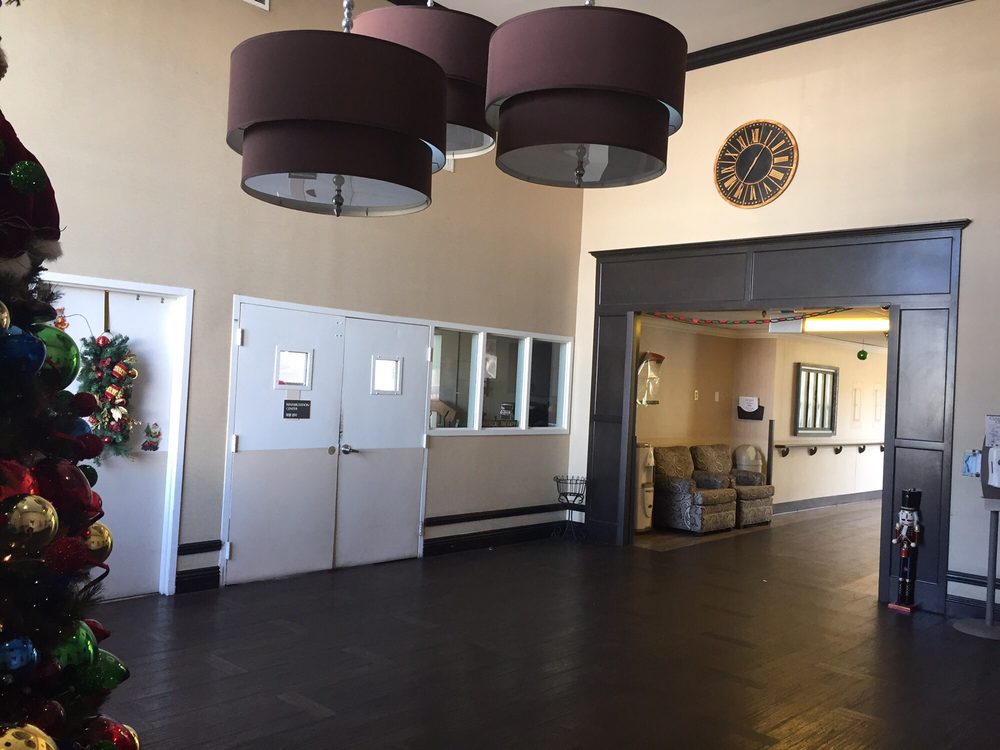
On-site Medical Care and Health Services
Most residents typically stay for a few weeks or months before returning home or moving on.
New residents most often arrive under Medicare (45% of admissions), and a typical Medicare stay runs around 27 days.
Coverage residents most often arrive under.
Coverage residents most often leave under.
![]() 2.9 miles from city center
2.9 miles from city center
![]() Estimated distance in miles from Los Angeles's city center to Grand Park Convalescent Hospital's address, calculated via Google Maps.
Estimated distance in miles from Los Angeles's city center to Grand Park Convalescent Hospital's address, calculated via Google Maps.
Add your location
Info below is compiled from CMS reports & the CA Dept. of Social Services (CDSS), senior community websites & trusted data sources such as Walk Score & BBB.
Communities are listed from highest to lowest based on our ranking methodology.
| Angels Nursing Center | NH SNF | Los Angeles (Westlake) | 41
Facility
41
CA AVG
104
Rank
#1194 / 1644 |
90.2%
Facility
90.2%
CA AVG
73.9
Rank
#338 / 1492 | +22% | 4.73
Facility
4.73
CA AVG
4.22
Rank
#56 / 293 | -54% | +12% | $71.6k
Facility
$71.6k
CA AVG
$56.5k
Rank
#271 / 298 | 60
Facility
60
CA AVG
81
Rank
#1294 / 1400 | 42
Facility
42
CA AVG
50.2
Rank
#151 / 293 | 3.8
Facility
3.8
CA AVG
4.6
Rank
#130 / 293 | 4 | 37 | A+ |
92
Facility
92
CA AVG
57
Rank
#137 / 2087 | Aret Akian | $5.8MFiscal year ending 12/2023
Facility
$5.8MFiscal year ending 12/2023
CA AVG
$17.0M
Rank
#292 / 295 | $3.8MFiscal year ending 12/2023
Facility
$3.8MFiscal year ending 12/2023
CA AVG
$7.0M
Rank
#283 / 295 | 65.6%Fiscal year ending 12/2023
Facility
65.6%Fiscal year ending 12/2023
CA AVG
45.2%
Rank
#5 / 295 | 55704 | ||||
| Palazzo Post Acute | NH SNF | Los Angeles (East Hollywood) | 99
Facility
99
CA AVG
104
Rank
#724 / 1644 |
94.0%
Facility
94.0%
CA AVG
73.9
Rank
#237 / 1492 | +27% | 4.46
Facility
4.46
CA AVG
4.22
Rank
#76 / 293 | -25% | +6% | $0
Facility
$0
CA AVG
$56.5k
Rank
#1 / 298 | - | 47
Facility
47
CA AVG
50.2
Rank
#173 / 293 | 2.5
Facility
2.5
CA AVG
4.6
Rank
#29 / 293 | 1 | 93 | A+ |
91
Facility
91
CA AVG
57
Rank
#155 / 2087 | Serrano Licensee 1 LLC | $13.0MFiscal year ending 12/2023
Facility
$13.0MFiscal year ending 12/2023
CA AVG
$17.0M
Rank
#134 / 295 | $8.5MFiscal year ending 12/2023
Facility
$8.5MFiscal year ending 12/2023
CA AVG
$7.0M
Rank
#152 / 295 | 65.1%Fiscal year ending 12/2023
Facility
65.1%Fiscal year ending 12/2023
CA AVG
45.2%
Rank
#187 / 295 | 56456 | ||||
| Hollenbeck Palms | NH AL IL MC SNF | Los Angeles (Central La) | 185
Facility
185
CA AVG
104
Rank
#196 / 1644 |
85.4%
Facility
85.4%
CA AVG
73.9
Rank
#443 / 1492 | +16% | 4.84
Facility
4.84
CA AVG
4.22
Rank
#47 / 293 | -11% | +15% | $0
Facility
$0
CA AVG
$56.5k
Rank
#1 / 298 | 89
Facility
89
CA AVG
81
Rank
#461 / 1400 | 39
Facility
39
CA AVG
50.2
Rank
#137 / 293 | 6.5
Facility
6.5
CA AVG
4.6
Rank
#257 / 293 | 1 | 158 | - |
62
Facility
62
CA AVG
57
Rank
#980 / 2087 | Casey Adams | $21.4MFiscal year ending 06/2024
Facility
$21.4MFiscal year ending 06/2024
CA AVG
$17.0M
Rank
#77 / 295 | $15.8MFiscal year ending 06/2024
Facility
$15.8MFiscal year ending 06/2024
CA AVG
$7.0M
Rank
#20 / 295 | 73.6%Fiscal year ending 06/2024
Facility
73.6%Fiscal year ending 06/2024
CA AVG
45.2%
Rank
#44 / 295 | 55115 | ||||
| Fountainview at Eisenberg Village | NH AL IL SNF | Reseda | 216
Facility
216
CA AVG
104
Rank
#127 / 1644 |
48.1%
Facility
48.1%
CA AVG
73.9
Rank
#1350 / 1492 | -35% | 2.96
Facility
2.96
CA AVG
4.22
Rank
#291 / 293 | +1% | -30% | $0
Facility
$0
CA AVG
$56.5k
Rank
#1 / 298 | 89
Facility
89
CA AVG
81
Rank
#461 / 1400 | 66
Facility
66
CA AVG
50.2
Rank
#237 / 293 | 3.9
Facility
3.9
CA AVG
4.6
Rank
#137 / 293 | - | 104 | - |
49
Facility
49
CA AVG
57
Rank
#1368 / 2087 | Karen Pham | $16.7MFiscal year ending 12/2023
Facility
$16.7MFiscal year ending 12/2023
CA AVG
$17.0M
Rank
#128 / 295 | $8.5MFiscal year ending 12/2023
Facility
$8.5MFiscal year ending 12/2023
CA AVG
$7.0M
Rank
#131 / 295 | 50.6%Fiscal year ending 12/2023
Facility
50.6%Fiscal year ending 12/2023
CA AVG
45.2%
Rank
#173 / 295 | 555716 | ||||
| Grand Park Convalescent Hospital | NH | Los Angeles (Westlake) | 151
Facility
151
CA AVG
104
Rank
#338 / 1644 |
96.2%
Facility
96.2%
CA AVG
73.9
Rank
#187 / 1492 | +30% | - | -20% | - | $0
Facility
$0
CA AVG
$56.5k
Rank
#1 / 298 | - | 36
Facility
36
CA AVG
50.2
Rank
#124 / 293 | 4.0
Facility
4.0
CA AVG
4.6
Rank
#142 / 293 | - | 145 | A+ |
97
Facility
97
CA AVG
57
Rank
#29 / 2087 | Barry Kohn | $18.9MFiscal year ending 12/2023
Facility
$18.9MFiscal year ending 12/2023
CA AVG
$17.0M
Rank
#39 / 295 | $10.4MFiscal year ending 12/2023
Facility
$10.4MFiscal year ending 12/2023
CA AVG
$7.0M
Rank
#74 / 295 | 55.1%Fiscal year ending 12/2023
Facility
55.1%Fiscal year ending 12/2023
CA AVG
45.2%
Rank
#265 / 295 | 56244 |
Grand Park Convalescent Hospital is located in Los Angeles, California.
Here are the financial assistance programs available to residents in California.
Grand Park Convalescent Hospital is in the Westlake neighborhood of Los Angeles.
Grand Park Convalescent Hospital has a walk score of 97. Walker's paradise. Daily errands do not require a car, with many shops and services nearby.
Grand Park Convalescent Hospital's occupancy is 87.3%.
Grand Park Convalescent Hospital has been operating for approximately 55 years, based on available licensing and registration records.
No, Grand Park Convalescent Hospital has a no-pet policy.
Grand Park Convalescent Hospital is registered as a for-profit in CA.
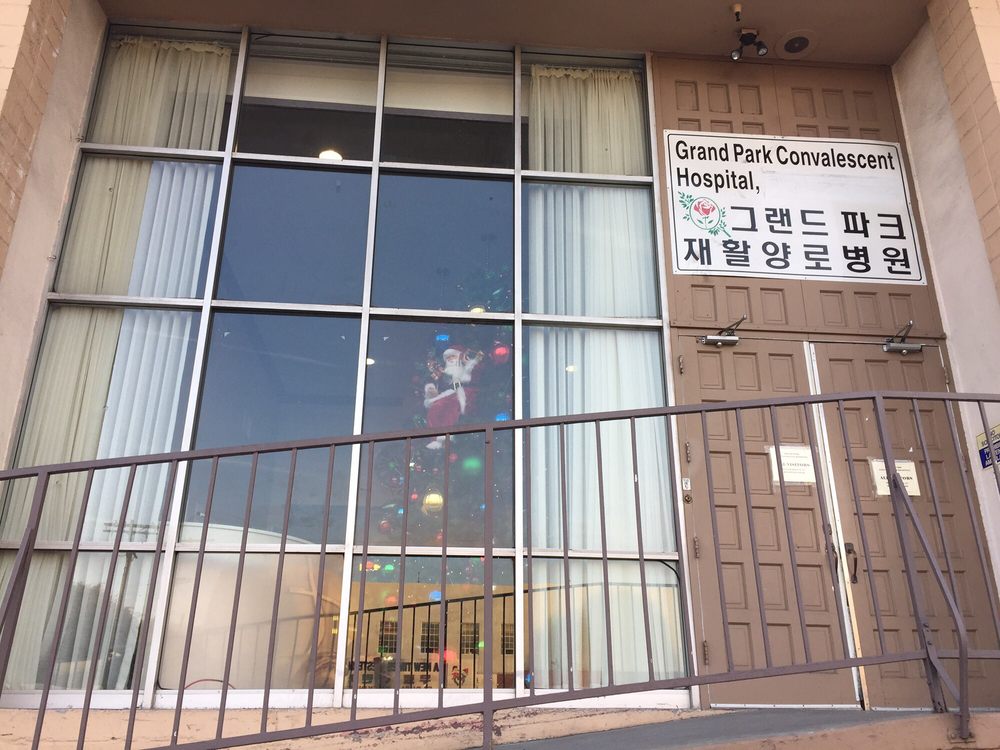
Yes — there are 6 photos of Grand Park Convalescent Hospital in the photo gallery on this page.
Care Cost Calculator: See Prices in Your Area
Nursing Home Data Explorer
Don’t Wait Too Long: 7 Red Flag Signs Your Parent Needs Assisted Living Now
The True Cost of Assisted Living in 2025 – And How Families Are Paying For It
Understanding Senior Living Costs: Pricing Models, Discounts & Financial Assistance


