Alexandria Rehabilitation & Healthcare Center
Nursing Home, Hospice Care, Nursing Care, Palliative Care & Respite Care · Alexandria, VA
CMS overall rating Info CMS (the Centers for Medicare & Medicaid Services) is the federal agency that rates nursing home quality. Its Overall Rating runs from 1 to 5 stars, combining health inspections, staffing, and quality measures, with inspections weighted most heavily.

Alexandria Rehabilitation & Healthcare Center

Nursing Home, Hospice Care, Nursing Care, Palliative Care & Respite Care · Alexandria, VA
CMS overall rating Info CMS (the Centers for Medicare & Medicaid Services) is the federal agency that rates nursing home quality. Its Overall Rating runs from 1 to 5 stars, combining health inspections, staffing, and quality measures, with inspections weighted most heavily.
Calculator: See prices in your area
Alexandria Rehabilitation & Healthcare Center accepts Medicare, Medicaid, and private pay.

Overview of Alexandria Rehabilitation & Healthcare Center

Alexandria Rehabilitation & Healthcare Center sits at 900 Virginia Ave in Alexandria’s North Ridge neighborhood, a 111-bed nursing facility owned by Tahir Majeed. The care mix is substantial: nursing care, rehabilitation, palliative care, hospice, and respite stays are all available under one roof. The neighborhood scores a 37 on walkability, so transportation is a practical consideration for most outings.

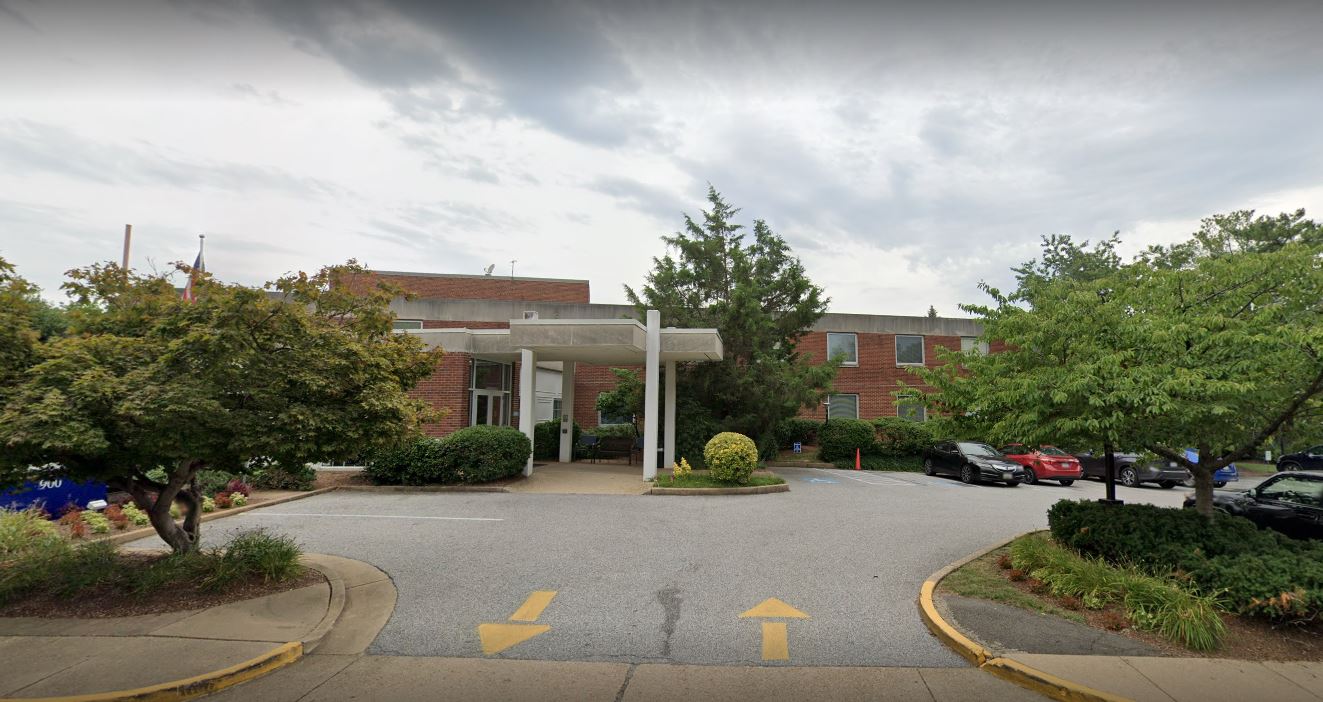
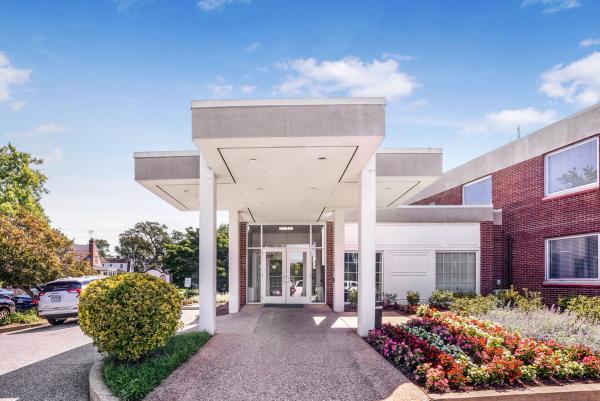
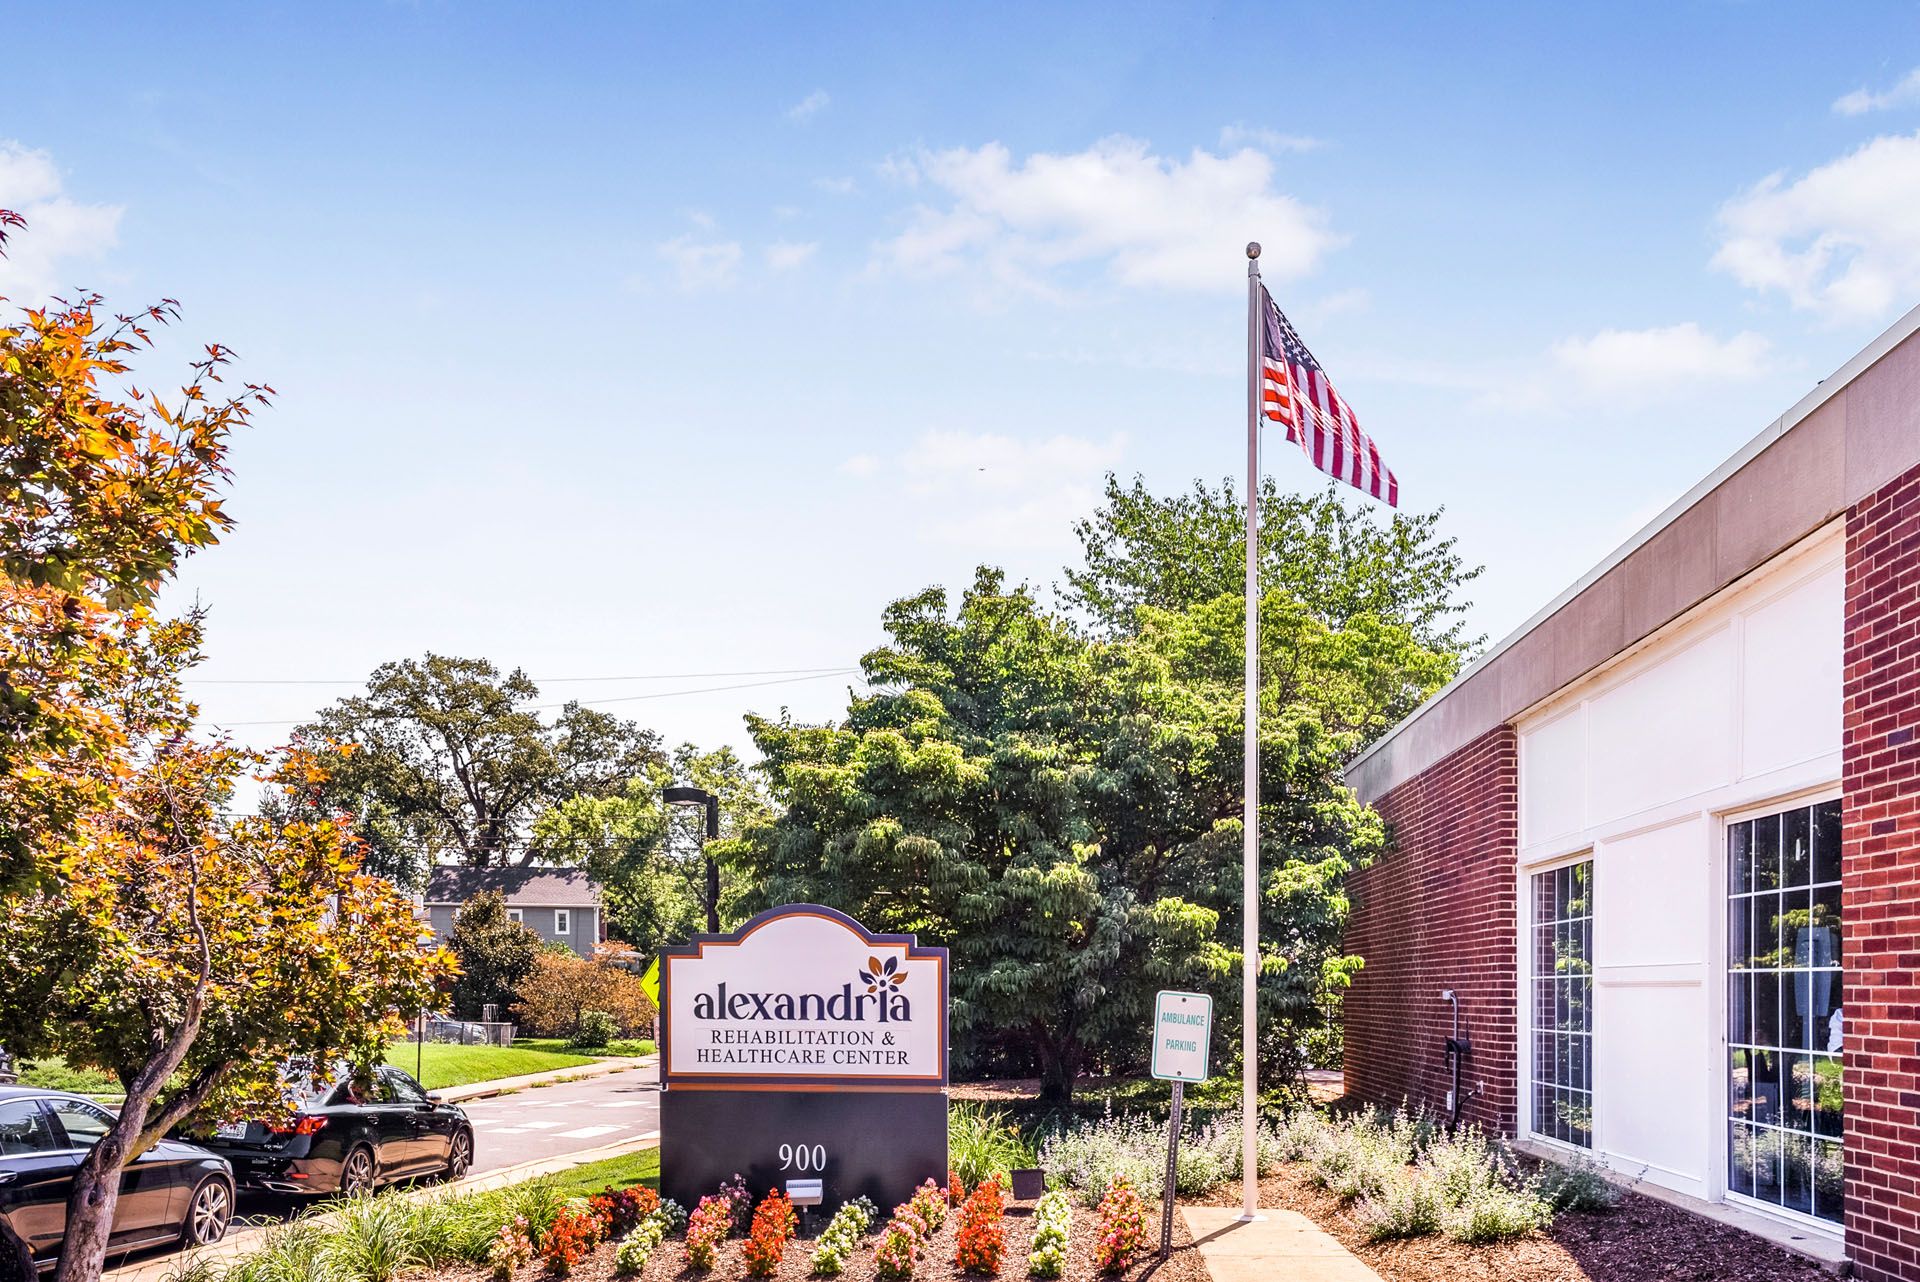
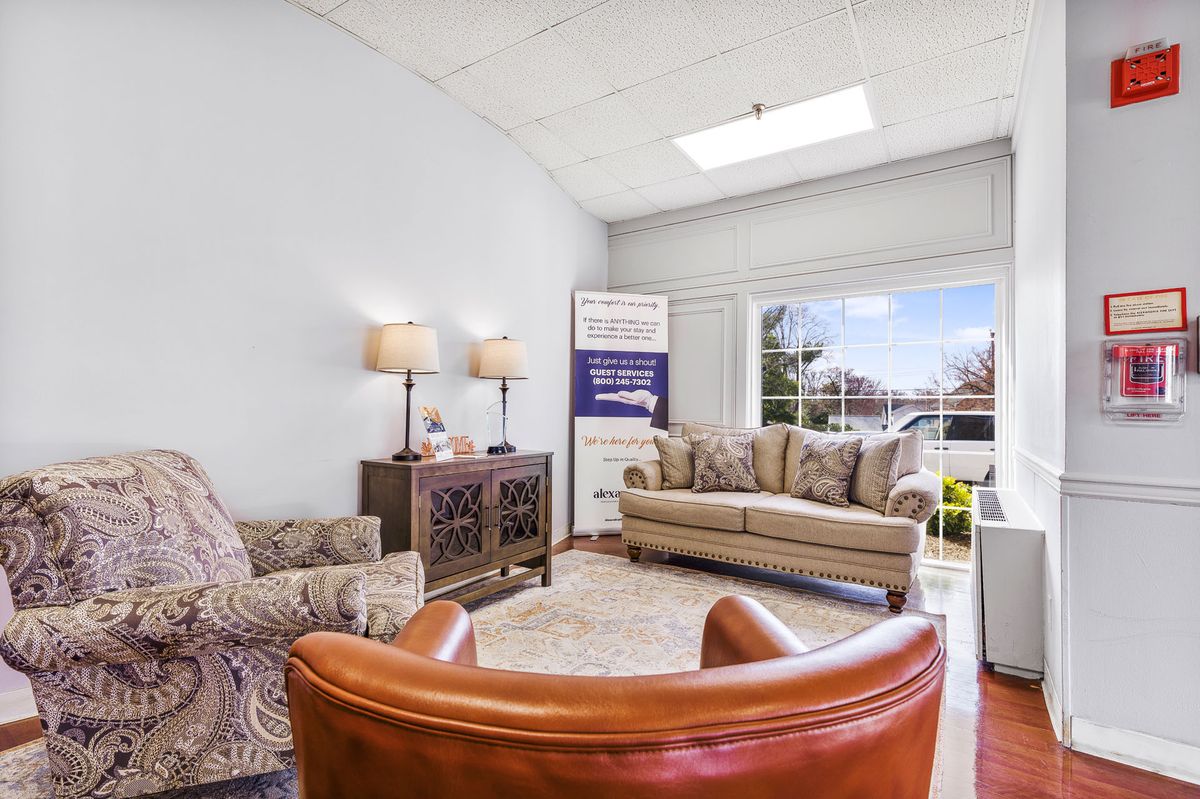
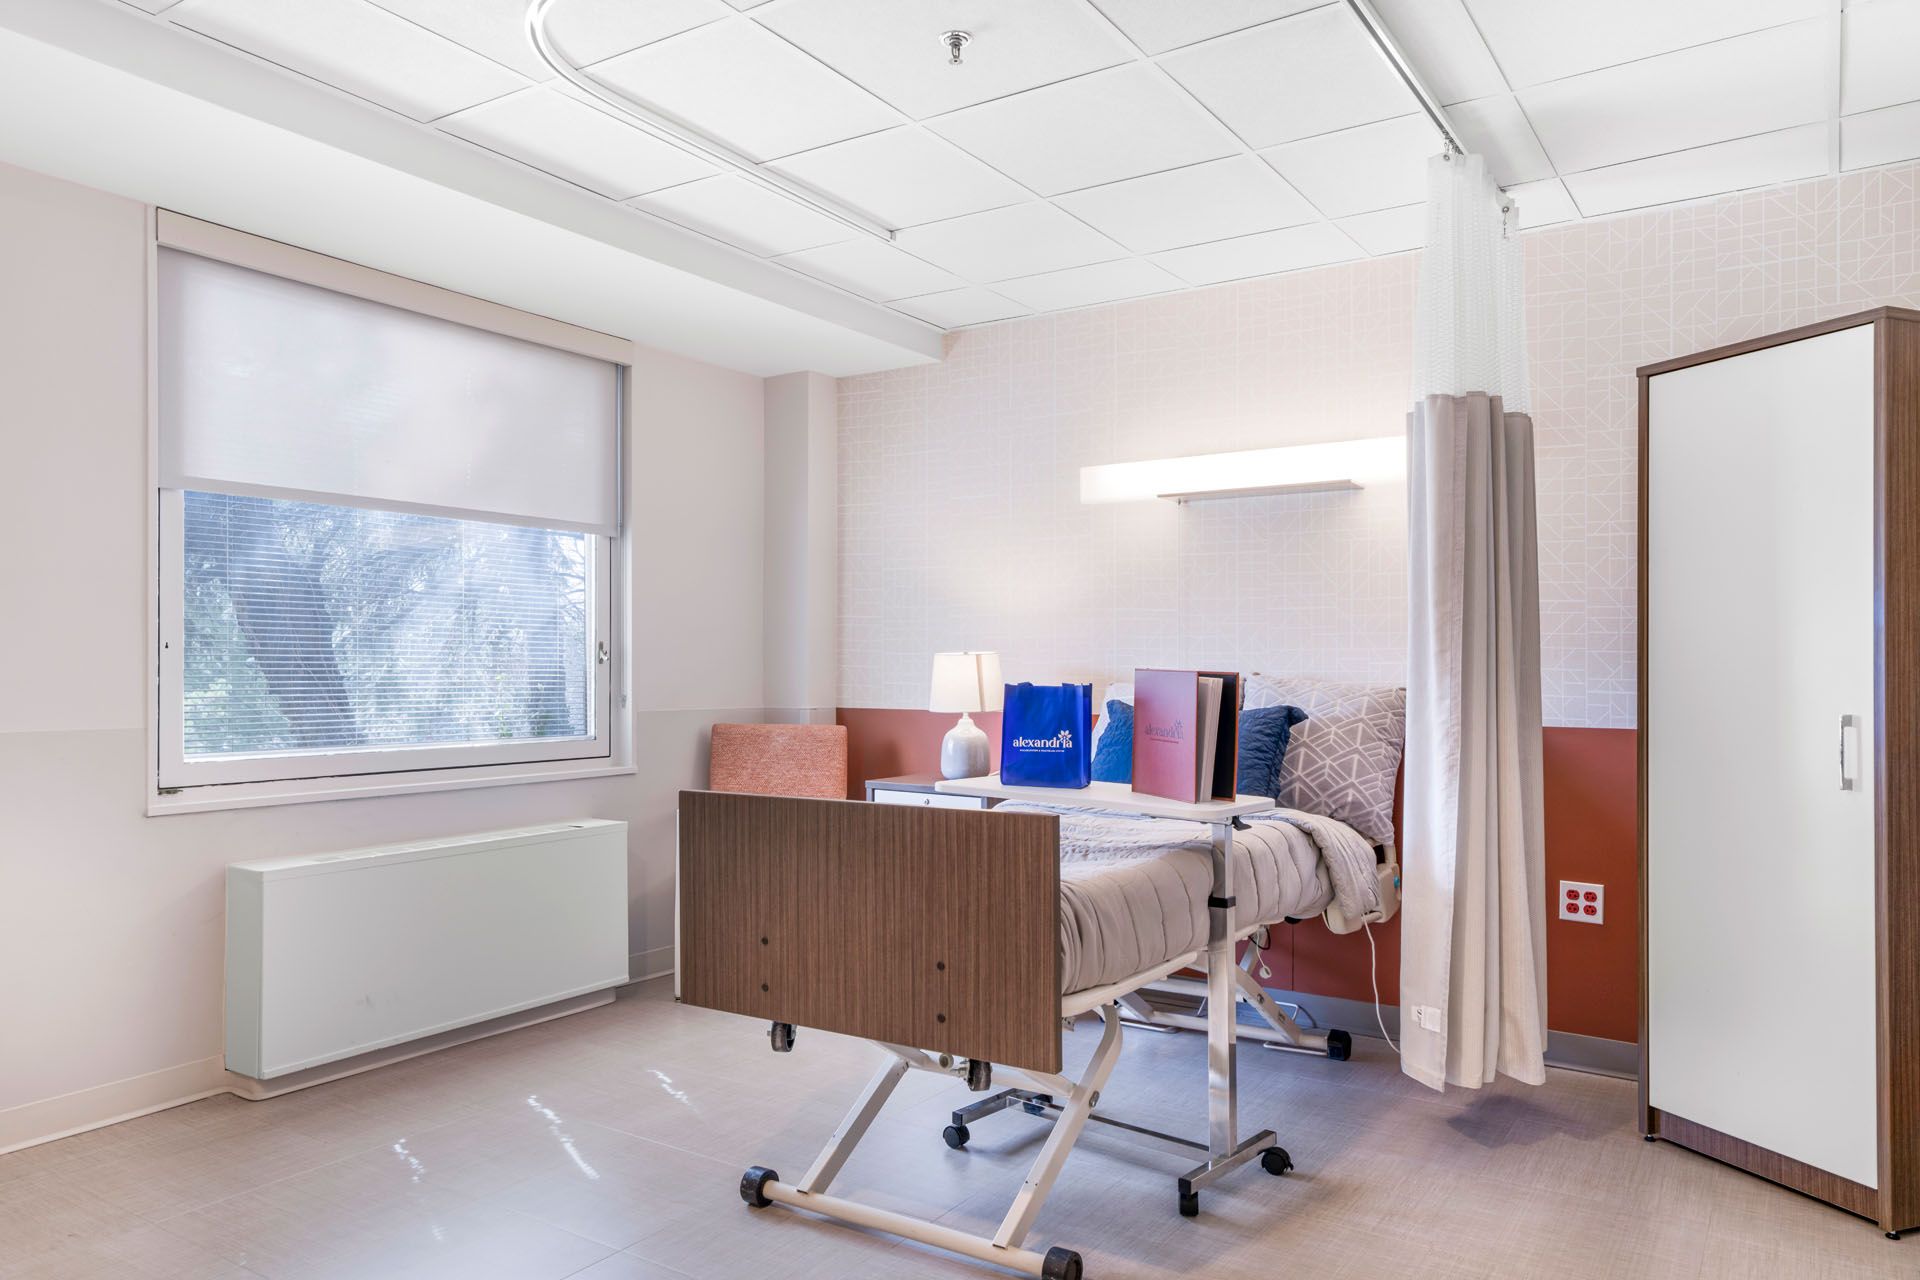
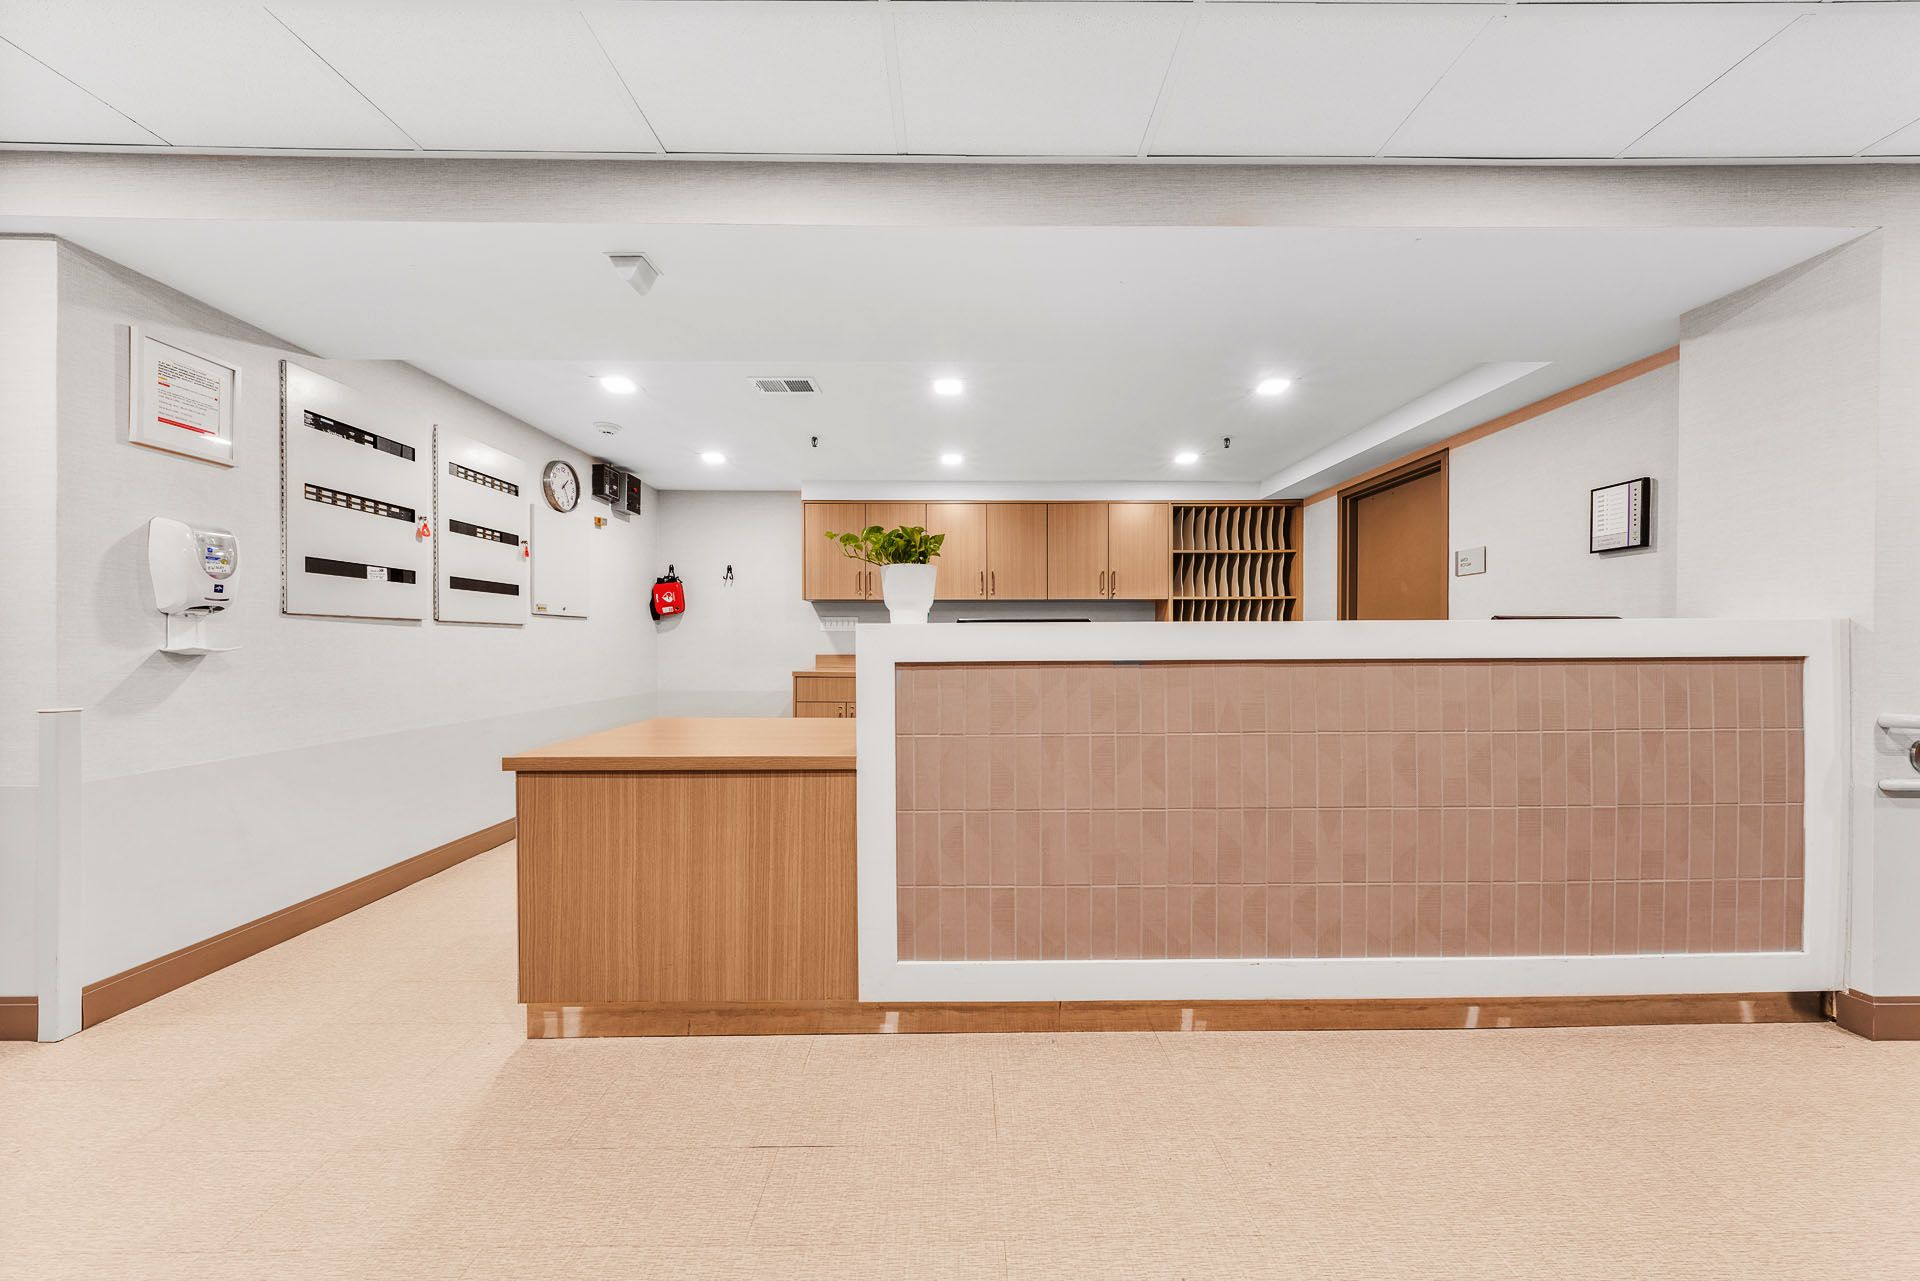
Residents stay an average of 121 days, a figure that reflects both short-term rehab patients working toward discharge and residents with longer-term nursing needs. Total nursing care averages 2 hours and 57 minutes per resident per day, with 35 minutes of that coming from registered nurses. Staffing runs around the clock. Medicare, Medicaid, and private pay are all accepted.

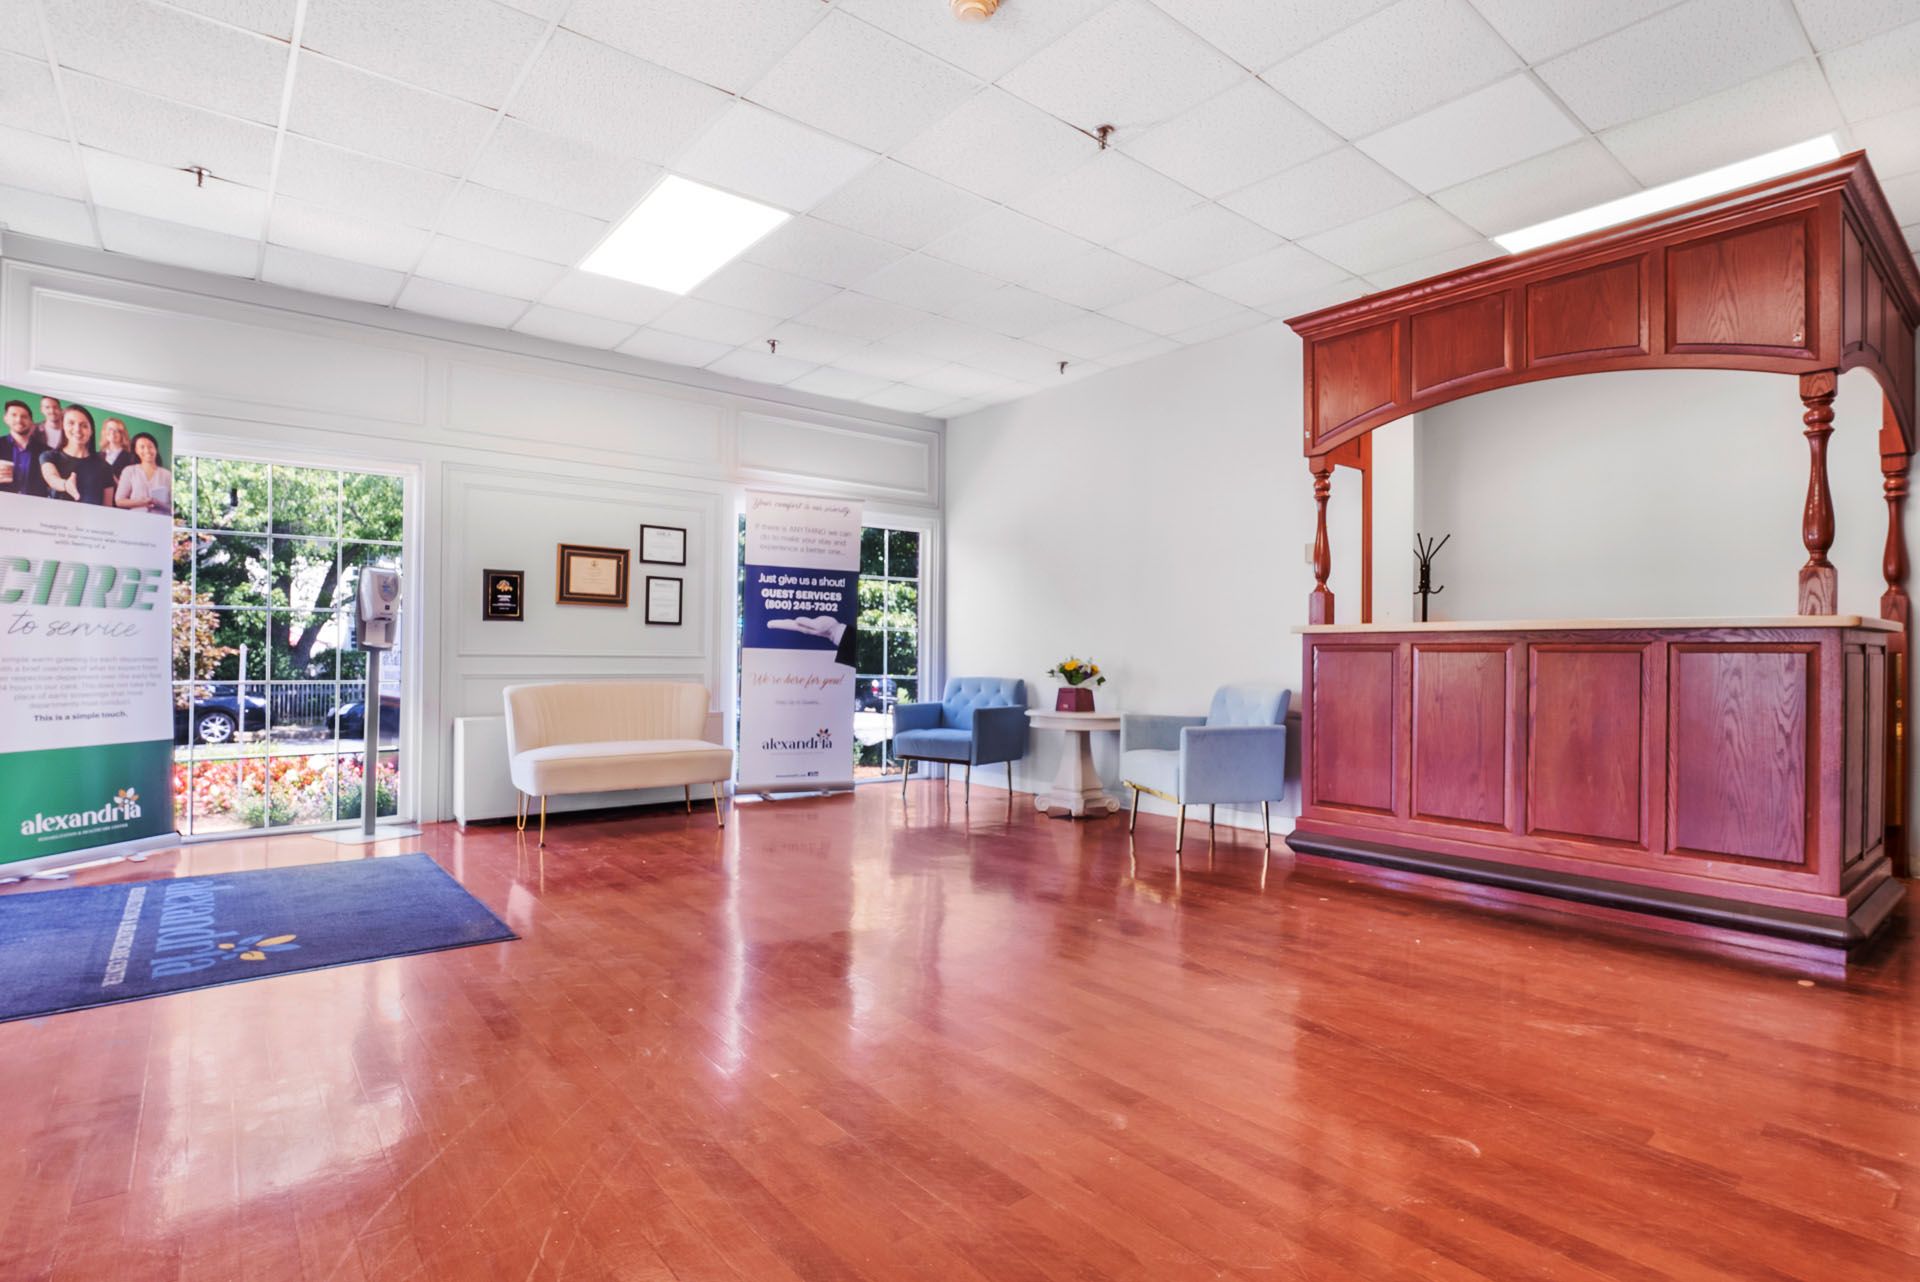
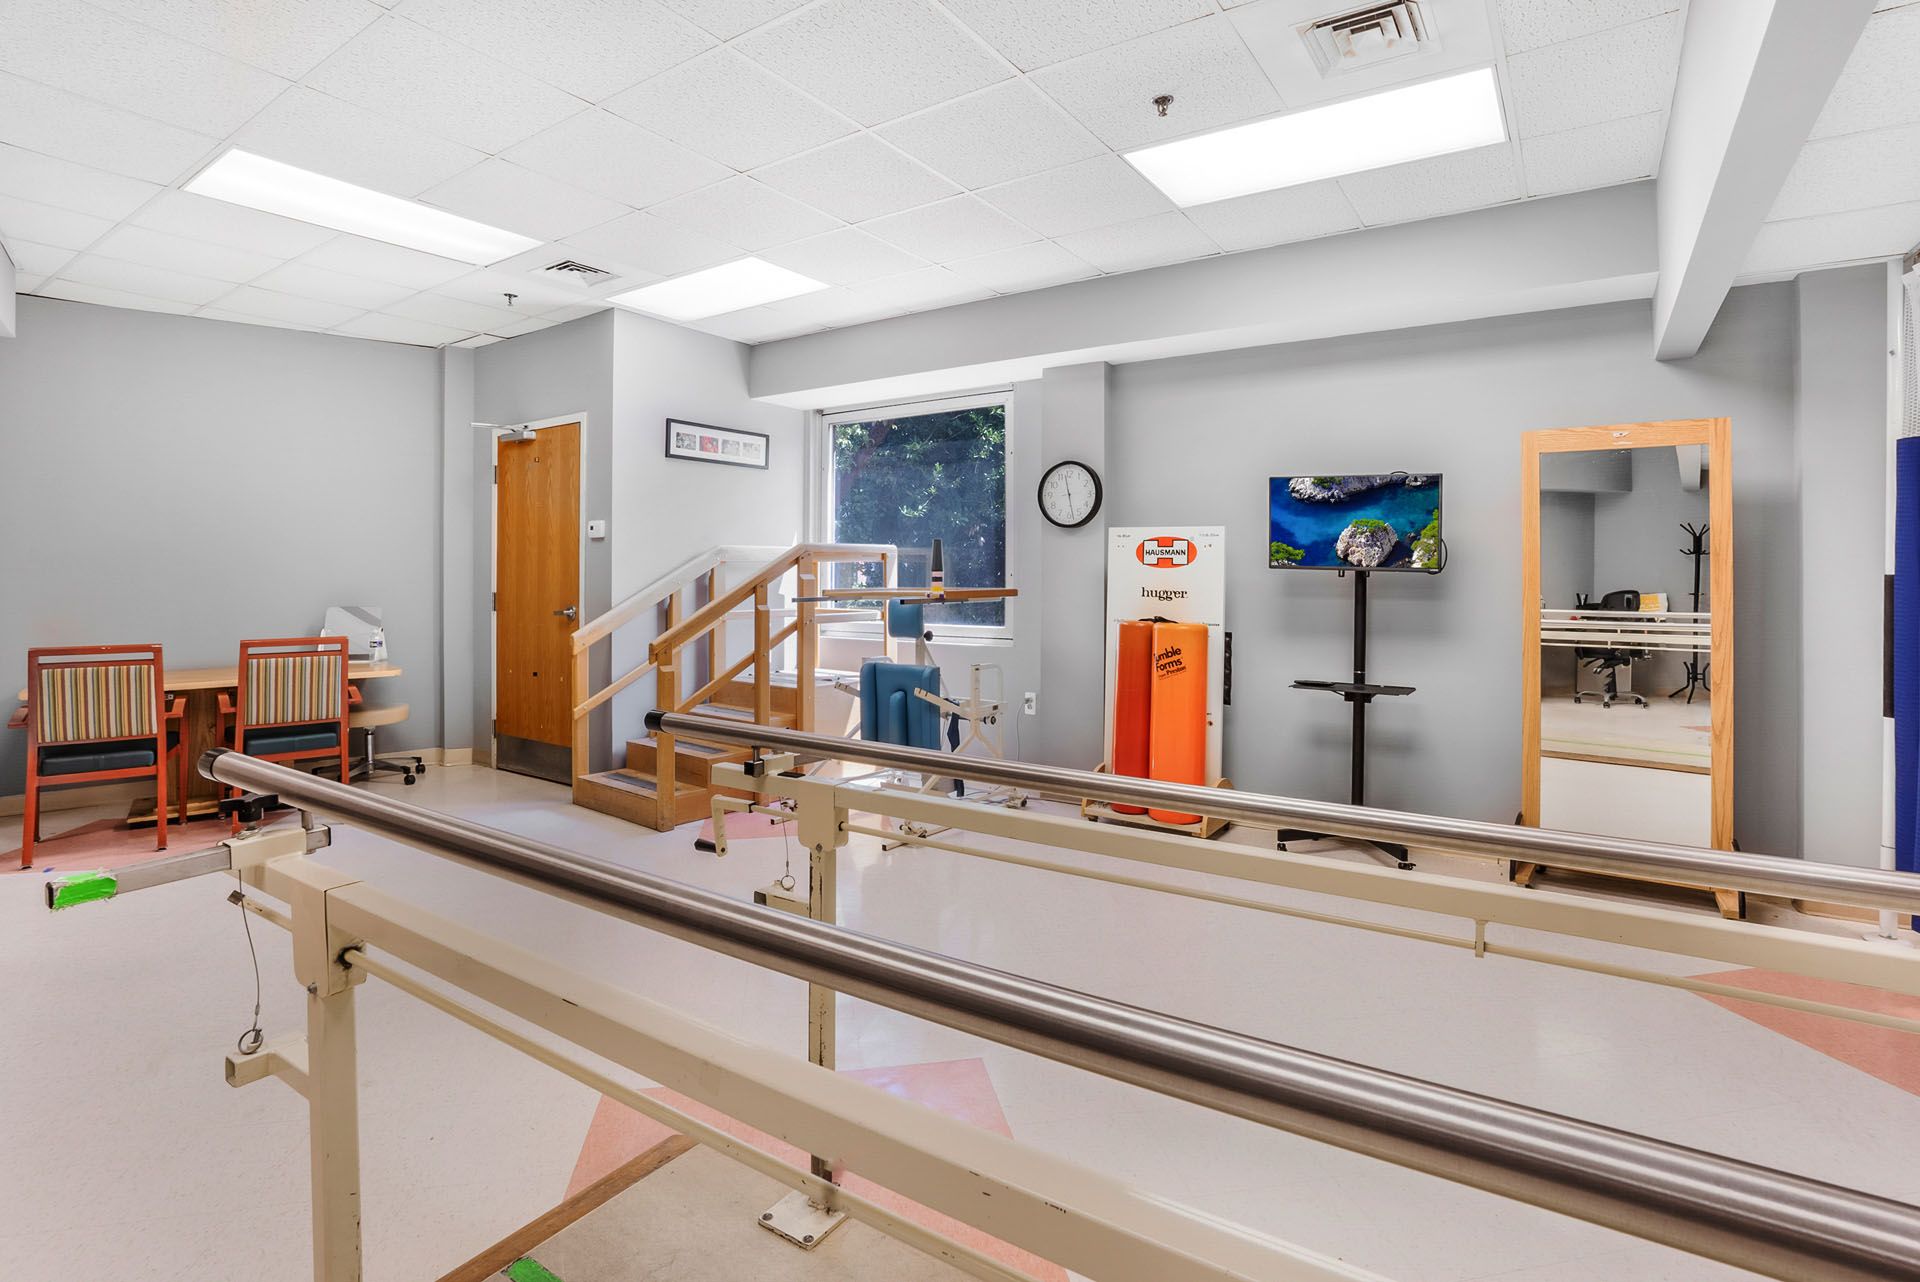
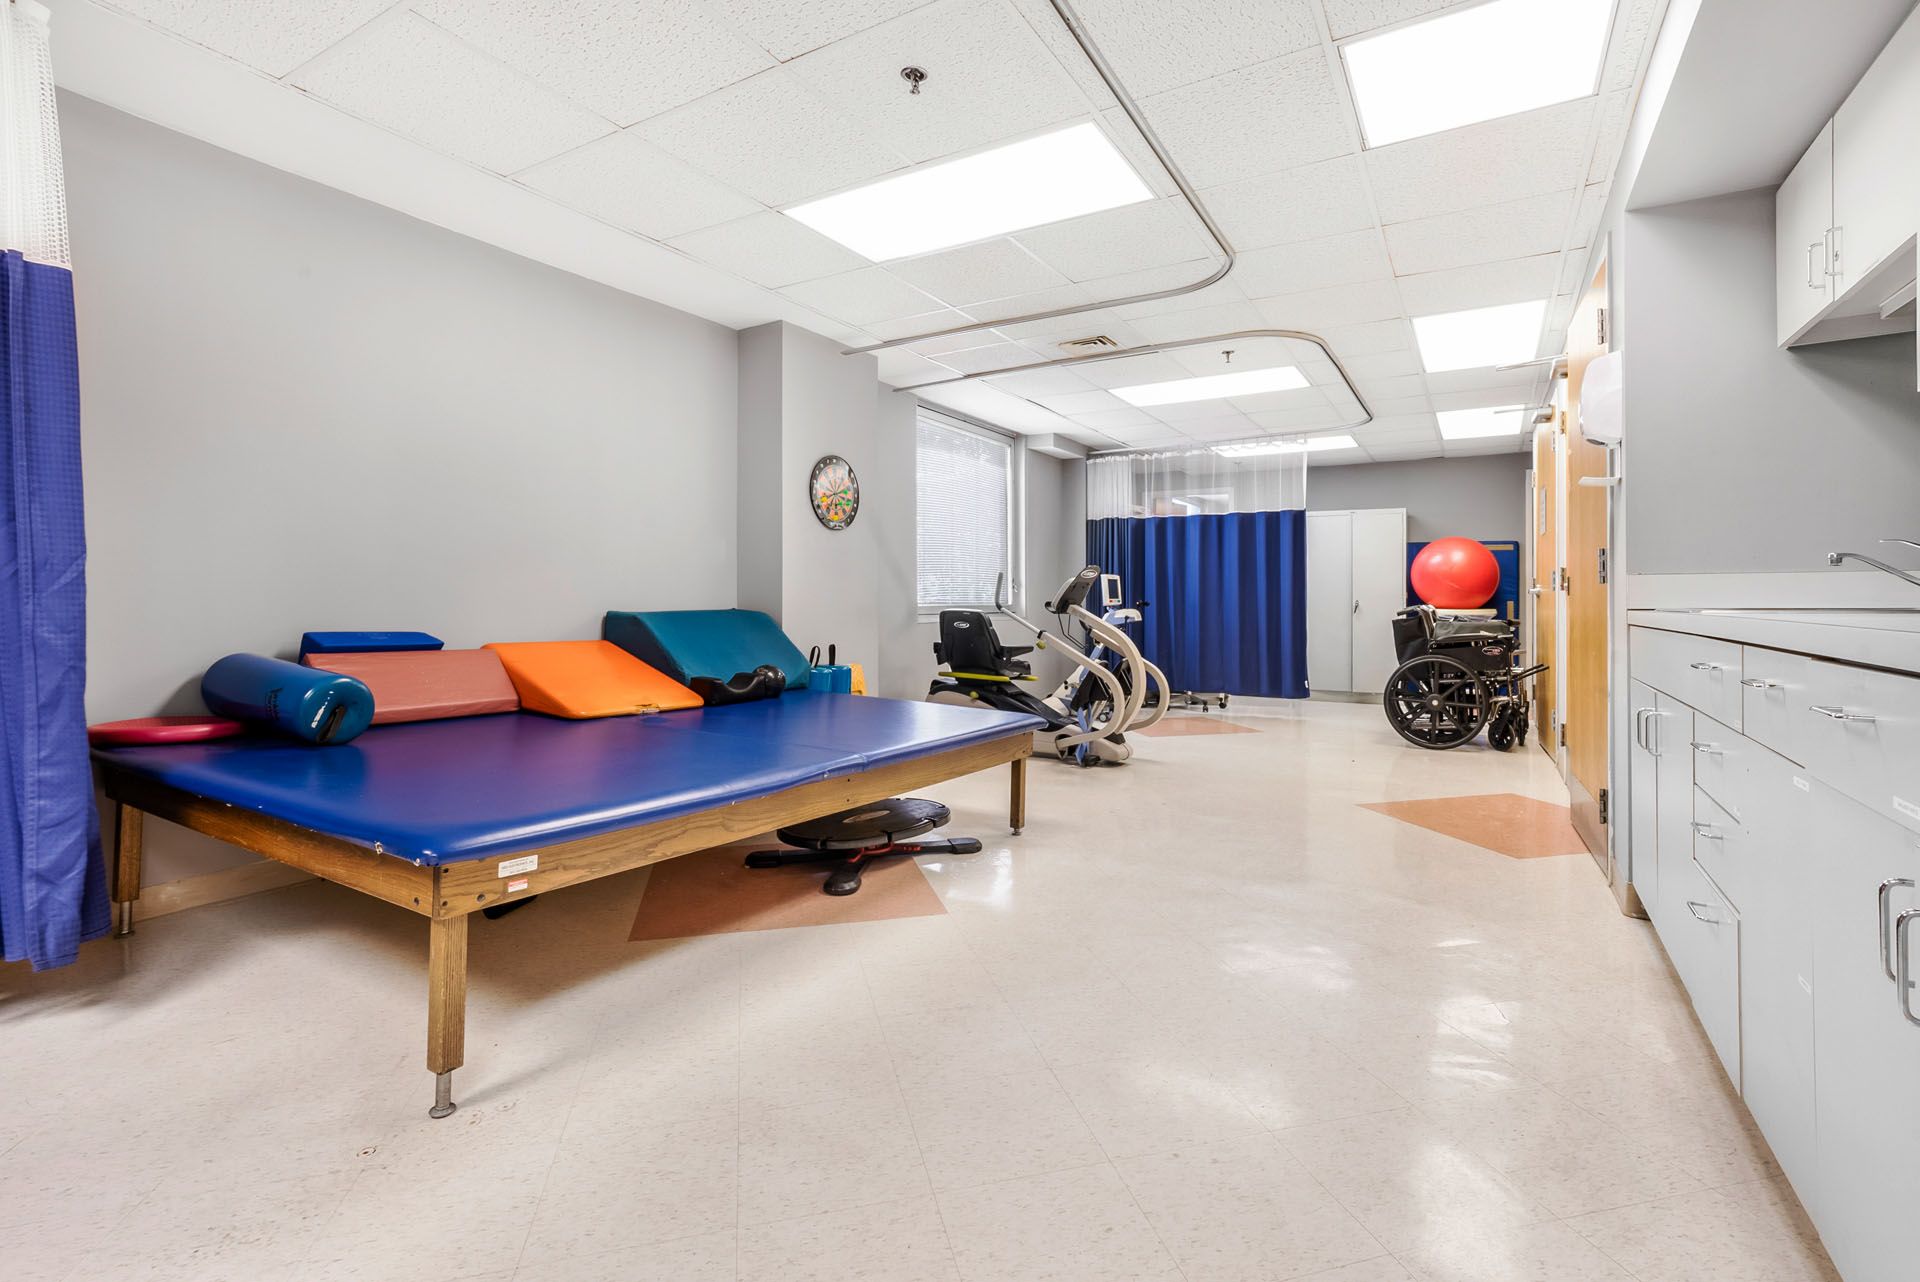
The facility’s clinical program includes several branded tracks: OrthoWin Rehab targets orthopedic recovery, NeuroGen Stroke Recovery addresses neurological rehabilitation, and UrgentSNF is designed for time-sensitive post-acute placement. Care Navigation helps coordinate transitions in and out of the facility. On the amenity side, residents have access to a gym, library, barber services, and walking paths.

Alexandria Rehabilitation & Healthcare Center is a clinically active nursing facility with a defined post-acute rehabilitation identity, multiple named care tracks, full Medicare and Medicaid acceptance, and a service range that covers the continuum from short-stay rehab through end-of-life care.

Quality ratings

Measured by Centers for Medicare & Medicaid Services (CMS)

Overall rating Info The Overall CMS Rating combines results from health inspections, staffing levels and quality measures. Health inspections carry the most weight. Staffing and quality scores can increase or decrease the final rating based on performance compared to state and national standards.
At VA avg. At VA avg.VA average: 3.0Click the badge to see the full State ranking.Click here to see the full State ranking.
Health Inspection Info Based on the results of the facility's three most recent standard inspections and any complaint investigations. CMS reviews the number, scope, and severity of deficiencies, with more recent findings weighted more heavily.
▼ 27.9% Below VA avg. ▼ 27.9% Below VA avg.VA average: 2.8Click the badge to see the full State ranking.Click here to see the full State ranking.
Staffing Info Measures average nursing staff hours per resident per day, including Registered Nurses (RNs) and total nursing staff. Ratings are adjusted based on the level of care residents require and are compared to state and national benchmarks.
▼ 19.0% Below VA avg. ▼ 19.0% Below VA avg.VA average: 2.5Click the badge to see the full State ranking.Click here to see the full State ranking.
Quality Measures Info Based on clinical and physical health indicators reported to CMS, such as hospital readmissions, falls, pressure ulcers, and improvements in mobility. These measures reflect how well residents' health needs are being managed.
▲ 29.9% Above VA avg. ▲ 29.9% Above VA avg.VA average: 3.8Click the badge to see the full State ranking.Click here to see the full State ranking.

Staffing hours breakdown

Info Daily nursing hours per resident by staff type, reported to CMS. Higher is generally better — compare this facility to state and national averages to see where staffing stands.

Hours per resident per day — compared to Virginia state averages

Total nursing care / resident Info This home is ranked 81st out of 89 homes in Virginia for nurse hours. Total adjusted nursing hours per resident per day, combining RN, LPN, and aide time. CMS adjusts this for case-mix so facilities can be fairly compared.
2h 57m per day
Rank #81 / 89Nurse hours — State benchmarkedThis home is ranked 81st out of 89 homes in Virginia. Shows adjusted nurse hours per resident per day benchmarked to the Virginia average, with a ranking across 89 Virginia facilities. More hours mean more direct care. The national average is about 3.5 hrs; below 3.0 is a red flag.Rankings are based only on facilities in Virginia that report data for that category. Facilities without available data are excluded from the ranking.Click the rank badge to see the full State ranking.Click here to see the full State ranking.
This facility Virginia avg (3h 45m per day)
vs Virginia avg
-21%

5 of 6 metrics below state avg

Staff typeHours / Day / Residentvs state avg
Registered Nurse (RN) Info RNs hold the highest nursing license and can assess residents, interpret test results, and direct care plans. More RN hours per day often signals stronger clinical oversight and faster response to health changes. 35m per day ▼ 14% State avg: 41m per day · National avg: 41m per day
LPN / LVN Info Licensed Practical Nurses (LPNs) or Licensed Vocational Nurses (LVNs) deliver routine hands-on care — medication administration, wound dressing, and monitoring vital signs. They work under RN supervision and make up a large share of daily bedside care. 1h 1m per day ■ Avg State avg: 1h 0m per day · National avg: 52m per day
Nurse Aide Info Certified Nurse Aides (CNAs) provide the most direct day-to-day assistance: bathing, dressing, feeding, and mobility. Nurse aide hours are typically the largest staffing category and directly affect residents' quality of life. 1h 56m per day ▼ 9% State avg: 2h 8m per day · National avg: 2h 21m per day
Weekend Total Nursing Info Combined nursing hours (RN + LPN + Nurse Aide) per resident per day on weekends. Staffing often drops on weekends — this figure reveals whether the facility maintains adequate coverage outside of weekday hours. 2h 59m per day ▼ 10% State avg: 3h 19m per day · National avg: 3h 26m per day
Physical Therapist Info Hours per resident per day provided by licensed Physical Therapists (PTs) or PT Assistants. PT services help residents recover mobility after injury or illness and are especially important for post-acute (short-stay) rehabilitation. 2m per day ▼ 51% State avg: 5m per day · National avg: 4m per day
Weekend RN Info Registered nurse hours specifically on weekends. Facilities sometimes reduce RN presence on Saturdays and Sundays — a low weekend RN figure compared to weekday hours can indicate reduced clinical oversight when most administrative staff are absent. 24m per day ▼ 14% State avg: 28m per day · National avg: 29m per day

Capacity and availability

This home usually has limited availability

Higher occupancy than the Virginia average: 85.7%
Occupancy rate
93.9% Rank #22 / 314Occupancy rate — State benchmarkedThis home is ranked 22nd out of 314 homes in Virginia. Shows this facility's occupancy rate versus the Virginia average, with its Statewide rank out of 314. Higher occupancy signals strong local demand and financial stability.Rankings are based only on facilities in Virginia that report data for that category. Facilities without available data are excluded from the ranking.Click the rank badge to see the full State ranking.Click here to see the full State ranking.
Avg. Length of Stay
121 days
Bed community size
111-bed community Rank #110 / 371Bed count — State benchmarkedThis home is ranked 110th out of 371 homes in Virginia. Shows this facility's certified or reported bed count compared to other Virginia facilities. Larger communities may offer more amenities, programs, and on-site services for residents and families.Rankings are based only on facilities in Virginia that report data for that category. Facilities without available data are excluded from the ranking.Click the rank badge to see the full State ranking.Click here to see the full State ranking.
A larger shared setting that may offer more common spaces and organized community services.
Walk Score
Walk Score: 37 / 100 Rank #255 / 449Walk Score — State benchmarkedThis home is ranked 255th out of 449 homes in Virginia. Shows how walkable this facility's neighborhood is compared to the average Walk Score across Virginia facilities. Higher scores benefit residents, families, and staff.Rankings are based only on facilities in Virginia that report data for that category. Facilities without available data are excluded from the ranking.Click the rank badge to see the full State ranking.Click here to see the full State ranking.
Somewhat walkable. A few nearby services may be reachable on foot, but most trips require transportation.

About this community

Awards

Awarded for Excellence

Therapy & Rehabilitation

3 services
Rehabilitation Services
Respite Care
Short-Term Rehab

Staffing & Medical

1 service
24-Hour Staffing

Additional Services

1 service
Home Care

Amenities & Lifestyle

Gym
Library
Barber
Walking Paths
Laundry
Specific ProgramsPost Acute Care, OrthoWin Rehab, NeuroGen Stroke Recovery, Care Navigation, Family Matters, UrgentSNF, Guest Services, Life Enrichment, Care, Anew

Contact Alexandria Rehabilitation & Healthcare Center

Staffing Data

Reporting period: October 1 – December 31, 2025 (Q4 2025). Source: CMS Payroll-Based Journal report.

Total staff 109
Employees 93
Contractors 16
Staff to resident ratio 0.98 : 1
41% fewer staff per resident than Virginia average
Virginia average ratio: 1.67 : 1 Virginia average ratio: 1.67 : 1See full Virginia ranking
Avg staff/day 56
Average shift 7.4 hours
8% worse than Virginia average
Virginia average: 8 hours Virginia average shift: 8 hoursSee full Virginia ranking
Total staff hours (quarter) 38,260

Nursing staff breakdown

Q4 2025 · Oct 1 – Dec 31 More info This data comes from the CMS Payroll-Based Journal report covering October 1 – December 31, 2025.
Registered Nurse

Manages medical care and health needs.

RN Staff Info 10 total: 7 full-time employees and 3 contractors. 10
Average shift length Info Average shift length. Calculated as total hours divided by days worked and average staff per day. 7.9 hours
Licensed Practical Nurse

Assists with medical care and medications.

LPN Staff Info 20 total: 19 full-time employees and 1 contractor. 20
Average shift length Info Average shift length. Calculated as total hours divided by days worked and average staff per day. 8.4 hours
Certified Nursing Assistant

Helps with daily care and mobility.

CNA Staff Info All 51 CNA Staff are full-time employees. No contractors work on this role. 51
Average shift length Info Average shift length. Calculated as total hours divided by days worked and average staff per day. 7.3 hours

Contractor staffing

Q4 2025 · Oct 1 – Dec 31 More info This data comes from the CMS Payroll-Based Journal report covering October 1 – December 31, 2025.

Total hours from contractors

4.9%

1,881 contractor hours this quarter

Respiratory Therapy Technician: 5 Physical Therapy Assistant: 4 Registered Nurse: 3 Qualified Social Worker: 2 Licensed Practical Nurse: 1 Physical Therapy Aide: 1

Staff by category

Q4 2025 · Oct 1 – Dec 31 More info This data comes from the CMS Payroll-Based Journal report covering October 1 – December 31, 2025.
Certified Nursing Assistant5105118,50292100%7.3
Licensed Practical Nurse191208,44892100%8.4
Registered Nurse73102,84392100%7.9
Clinical Nurse Specialist6062,28592100%6.3
RN Director of Nursing3031,2166773%8
Mental Health Service Worker2029736874%8
Other Dietary Services Staff2027117278%7.3
Physical Therapy Assistant0446416672%5.1
Nurse Practitioner1015126470%8
Administrator1015046368%8
Dietitian1014806065%8
Qualified Social Worker0224566571%7
Respiratory Therapy Technician0553925155%5.2
Physical Therapy Aide0113003841%7.9
51 Certified Nursing Assistant
% of Days 100%
20 Licensed Practical Nurse
% of Days 100%
10 Registered Nurse
% of Days 100%
6 Clinical Nurse Specialist
% of Days 100%
3 RN Director of Nursing
% of Days 73%
2 Mental Health Service Worker
% of Days 74%
2 Other Dietary Services Staff
% of Days 78%
4 Physical Therapy Assistant
% of Days 72%
1 Nurse Practitioner
% of Days 70%
1 Administrator
% of Days 68%
1 Dietitian
% of Days 65%
2 Qualified Social Worker
% of Days 71%
5 Respiratory Therapy Technician
% of Days 55%
1 Physical Therapy Aide
% of Days 41%

Penalties and fines

Federal penalties imposed by CMS for regulatory violations, including civil money penalties (fines) and denials of payment for new Medicare/Medicaid admissions.

Source: CMS Penalties Database

No penalties in the past 3 years

No civil money penalties or payment denials were reported in the last 3 years.

Quality of care over time

These measures show how residents usually do over time at this home, based on health outcomes and preventive care.

High-risk clinical events score Info A composite score based on pressure ulcers, falls with injury, weight loss, walking ability decline, and activities of daily living decline. 4.0
61% better than Virginia average

Virginia average: 10.1

Functional decline score Info A composite score based on activities of daily living decline, walking ability decline, and incontinence. 8.3
58% better than Virginia average

Virginia average: 19.7

Long-stay resident measures
Significantly above average Virginia avg: 3.9 Info CMS star rating based on long-stay quality measure performance. 5 stars = significantly above average, 1 star = significantly below average.
Need for Help with Daily Activities Increased Info Percent of long-stay residents whose need for help with daily activities has increased 2.2%
87% better than Virginia average

Virginia average: 16.8%

Walking Ability Worsened Info Percent of long-stay residents whose ability to move independently worsened 3.9%
80% better than Virginia average

Virginia average: 19.7%

Low Risk Residents with Bowel/Bladder Incontinence Info Percent of low risk long-stay residents who lose control of their bowels or bladder 18.7%
17% better than Virginia average

Virginia average: 22.6%

Falls with Major Injury Info Percent of long-stay residents experiencing one or more falls with major injury 1.3%
65% better than Virginia average

Virginia average: 3.6%

High Risk Residents with Pressure Ulcers Info Percent of long-stay high risk residents with pressure ulcers 5.3%
In line with Virginia average

Virginia average: 5.4%

Urinary Tract Infection Info Percent of long-stay residents with a urinary tract infection 0.7%
58% better than Virginia average

Virginia average: 1.5%

Lost Too Much Weight Info Percent of long-stay residents who lose too much weight 7.1%
22% worse than Virginia average

Virginia average: 5.9%

Depressive Symptoms Info Percent of long-stay residents who have depressive symptoms 75.8%
409% worse than Virginia average

Virginia average: 14.9%

Antipsychotic Use Info Percent of long-stay residents who received an antipsychotic medication 5.8%
55% better than Virginia average

Virginia average: 12.9%

Pneumococcal Vaccine Info Percent of long-stay residents assessed and appropriately given the pneumococcal vaccine 98.7%
8% better than Virginia average

Virginia average: 91.3%

Influenza Vaccine Info Percent of long-stay residents assessed and appropriately given the seasonal influenza vaccine 96.6%
In line with Virginia average

Virginia average: 94.0%

Hospitalizations per 1,000 days Info Number of hospitalizations per 1,000 long-stay resident days. 2.56
75% worse than Virginia average

Virginia average: 1.46

ED visits per 1,000 days Info Number of outpatient emergency department visits per 1,000 long-stay resident days. 1.32
6% better than Virginia average

Virginia average: 1.41

Short-stay resident measures
Significantly above average Virginia avg: 3.9 Info CMS star rating based on short-stay quality measure performance. 5 stars = much above average, 1 star = much below average.
Pneumococcal Vaccine Info Percent of short-stay residents assessed and appropriately given the pneumococcal vaccine 82.5%
10% better than Virginia average

Virginia average: 74.9%

Antipsychotic medication increase Info Percent of short-stay residents who newly received an antipsychotic medication 0.0%
100% better than Virginia average

Virginia average: 1.2%

Influenza Vaccine Info Percent of short-stay residents assessed and appropriately given the seasonal influenza vaccine 73.7%
In line with Virginia average

Virginia average: 73.6%

Re-hospitalized after SNF stay Info Percentage of short-stay residents who were re-hospitalized after their nursing home admission. 18.2%
17% better than Virginia average

Virginia average: 22.0%

Emergency department visits Info Percentage of short-stay residents who had an outpatient emergency department visit. 7.0%
40% better than Virginia average

Virginia average: 11.7%

Falls with major injury Info Percentage of SNF residents who experience falls with major injury during their stay. 0.0%
100% better than Virginia average

Virginia average: 0.8%

Ability to care for self at discharge Info Percentage of residents at or above expected ability to care for themselves at discharge. 75.0%
40% better than Virginia average

Virginia average: 53.7%

Successful return to home or community Info Rate of successful return to home or community from a skilled nursing facility. 56.3%
11% better than Virginia average

Virginia average: 50.6%

Breakdown by payment type

Medicare

50% of new residents, usually for short-term rehab.

Typical stay 28 days

Private pay

38% of new residents, often for short stays.

Typical stay 1 - 2 months

Medicaid

12% of new residents, often for long-term daily care.

Typical stay 2 years

Facility Characteristics

Source: CMS Long-Term Care Facility Characteristics (Data as of Jan 2026)

Total residents 111
Private pay or other
111
100% of residents
Programs & Services
Residents Group

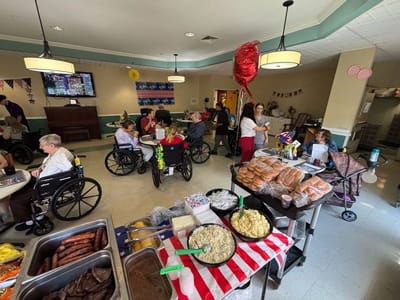
Residents meet regularly to discuss policies, care quality, and activities

Active Resident Council

Organized group of residents that meets regularly to discuss facility policies, quality of life, and activities.

Finances and operations

Based on CMS SNF Cost Report for fiscal year ending in 06/2024.

For-profit
Operated by a single business entity.
Net patient revenue Info Net patient revenue — what the home actually collects for resident care, after contractual allowances, bad debt and discounts are subtracted from its gross charges (CMS cost report, Worksheet G-3). It covers resident care only; money the home earns from other sources is shown separately as "Other income."
$15.7M
Net patient income Info Net patient income: net patient revenue minus the home's total operating expenses. A positive figure means it earns more from resident care than it spends to deliver it; a negative figure means the opposite. It excludes non-operating "other income."
$1.9M
For-profit Operated by a single business entity.
Net patient revenue Info Net patient revenue — what the home actually collects for resident care, after contractual allowances, bad debt and discounts are subtracted from its gross charges (CMS cost report, Worksheet G-3). It covers resident care only; money the home earns from other sources is shown separately as "Other income."
$15.7M Rank #61 / 89Revenue — State benchmarkedThis home is ranked 61st out of 89 homes in Virginia. Shows this facility's annual revenue compared to the Virginia average. Higher revenue generally means more resources for staffing and capital — read alongside Payroll %.Rankings are based only on facilities in Virginia that report data for that category. Facilities without available data are excluded from the ranking.Click the rank badge to see the full State ranking.Click here to see the full State ranking.
Net patient income Info Net patient income: net patient revenue minus the home's total operating expenses. A positive figure means it earns more from resident care than it spends to deliver it; a negative figure means the opposite. It excludes non-operating "other income."
$1.9M
Other income Info Money the home earns outside of resident care — such as investments, grants, rentals and other non-operating sources (CMS cost report, Worksheet G-3). It is tracked separately from net patient revenue: it is not part of that figure, and it is not included in net patient income.
$30.5K
Payroll costs Info Staff salaries plus wage-related costs — benefits such as payroll taxes, health insurance and retirement — from the home's own accounting records (CMS cost report, Worksheet A). Contract or agency labor is counted separately, under other operating costs. Rank #74 / 89Payroll — State benchmarkedThis home is ranked 74th out of 89 homes in Virginia. Shows total annual staff payroll benchmarked to the Virginia average. Higher payroll investment relative to peers often signals better staffing and less reliance on cheaper contract labor.Rankings are based only on facilities in Virginia that report data for that category. Facilities without available data are excluded from the ranking.Click the rank badge to see the full State ranking.Click here to see the full State ranking.
$6.1M 38.9% of net patient revenue Info Payroll as a share of revenue: staff salaries and wage-related benefits divided by net patient revenue. A higher figure means more of each revenue dollar goes to staff pay. Rank #66 / 89Payroll % — State benchmarkedThis home is ranked 66th out of 89 homes in Virginia. Shows payroll as a percentage of revenue versus the Virginia average. Well-run Virginia facilities typically land around 51–60% — the top third Statewide. Below 25% may signal understaffing or heavy agency use — read with Staffing ratings.Rankings are based only on facilities in Virginia that report data for that category. Facilities without available data are excluded from the ranking.Click the rank badge to see the full State ranking.Click here to see the full State ranking.
Other operating costs Info Everything it costs to run the home apart from payroll — food, utilities, supplies, maintenance, contract labor and administration. Calculated as total operating expense minus payroll (staff salaries and wage-related benefits).
$7.7M
Total costs Info The home's total operating expense for the year — all the costs of running it, salaries included (CMS cost report, Worksheet G-3).
$13.9M

Who this home usually serves

TYPE OF STAY

Mostly short-term rehab stays

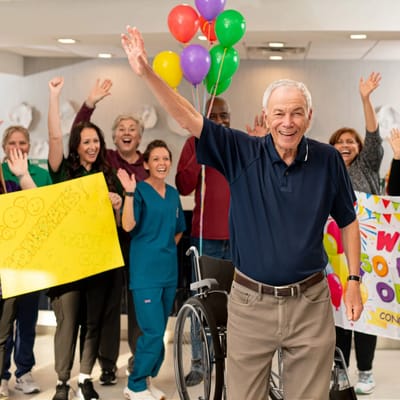
Most residents typically stay for a few weeks or months before returning home or moving on.

Most new residents arrive under Medicare (50% of admissions), and a typical Medicare stay runs around 28 days.

Admissions
317 total

Coverage residents most often arrive under.

Medicare 50%
Private pay 38%
Medicaid 12%
Discharges
316 total

Coverage residents most often leave under.

Medicare 39%
Private pay 41%
Medicaid 20%

Places of interest near Alexandria Rehabilitation & Healthcare Center

Address 2.7 miles from city center Info Estimated distance in miles from Alexandria's city center to Alexandria Rehabilitation & Healthcare Center's address, calculated via Google Maps.

Calculate Travel Distance to Alexandria Rehabilitation & Healthcare Center

Add your location

Address

Compare Nursing Homes around Alexandria

The information below is reported by the Virginia Department of Social Services and Department of Health.

5 facilities compared · CMS & VA Dept. of Health data

Goodwin House Alexandria
NH
AL
HC
IL
MC
NC
Alexandria (Alexandria West)
250
Facility 250
VA AVG 95
Rank #6 / 371
22.4%
Facility 22.4%
VA AVG 85.7%
Rank #311 / 314
-74%
6.07
Facility 6.07
VA AVG 3.74
Rank #9 / 89
+19%+62%
$0
Facility $0
VA AVG $54.3k
Rank #1 / 93
14
Facility 14
VA AVG 38.4
Rank #15 / 90
4.7
Facility 4.7
VA AVG 8.9
Rank #19 / 90
-56-
62
Facility 62
VA AVG 44
Rank #98 / 449
Robert Liebreich
$31.7M
Facility $31.7M
VA AVG $18.3M
Rank #4 / 89
$31.0M
Facility $31.0M
VA AVG $6.9M
Rank #1 / 89
97.7%
Facility 97.7%
VA AVG 39.7%
Rank #29 / 89
495057
Arleigh Burke Pavilion at Vinson Hall Retirement Community
NH
AL
HC
IL
MC
RC
Mclean (Kirby Road)
32
Facility 32
VA AVG 95
Rank #341 / 371
59.4%
Facility 59.4%
VA AVG 85.7%
Rank #230 / 314
-31%
5.53
Facility 5.53
VA AVG 3.74
Rank #13 / 89
-11%+48%
$0
Facility $0
VA AVG $54.3k
Rank #1 / 93
13
Facility 13
VA AVG 38.4
Rank #12 / 90
4.3
Facility 4.3
VA AVG 8.9
Rank #15 / 90
-19-
52
Facility 52
VA AVG 44
Rank #161 / 449
Nmcgr
$10.7M
Facility $10.7M
VA AVG $18.3M
Rank #35 / 89
$14.8M
Facility $14.8M
VA AVG $6.9M
Rank #21 / 89
139.4%
Facility 139.4%
VA AVG 39.7%
Rank #33 / 89
495410
The Fairfax
NH
AL
IL
MC
Fort Belvoir
96
Facility 96
VA AVG 95
Rank #165 / 371
71.9%
Facility 71.9%
VA AVG 85.7%
Rank #163 / 314
-16%
4.64
Facility 4.64
VA AVG 3.74
Rank #28 / 89
+4%+24%
$0
Facility $0
VA AVG $54.3k
Rank #1 / 93
16
Facility 16
VA AVG 38.4
Rank #23 / 90
5.3
Facility 5.3
VA AVG 8.9
Rank #25 / 90
-69-
2
Facility 2
VA AVG 44
Rank #434 / 449
Hwan Yi
$33.2M
Facility $33.2M
VA AVG $18.3M
Rank #11 / 89
$13.5M
Facility $13.5M
VA AVG $6.9M
Rank #26 / 89
40.6%
Facility 40.6%
VA AVG 39.7%
Rank #85 / 89
495197
Alexandria Rehabilitation & Healthcare Center
NH
HC
NC
PC
RC
Alexandria (North Ridge)
111
Facility 111
VA AVG 95
Rank #110 / 371
93.9%
Facility 93.9%
VA AVG 85.7%
Rank #22 / 314
+10%
2.94
Facility 2.94
VA AVG 3.74
Rank #81 / 89
-5%-21%
$0
Facility $0
VA AVG $54.3k
Rank #1 / 93
40
Facility 40
VA AVG 38.4
Rank #56 / 90
13.3
Facility 13.3
VA AVG 8.9
Rank #71 / 90
2104-
37
Facility 37
VA AVG 44
Rank #255 / 449
Tahir Majeed
$15.7M
Facility $15.7M
VA AVG $18.3M
Rank #61 / 89
$6.1M
Facility $6.1M
VA AVG $6.9M
Rank #74 / 89
38.9%
Facility 38.9%
VA AVG 39.7%
Rank #66 / 89
495203
Mount Vernon Healthcare Center
NH
AL
HC
MC
RC
Alexandria
130
Facility 130
VA AVG 95
Rank #69 / 371
82.5%
Facility 82.5%
VA AVG 85.7%
Rank #282 / 314
-4%
4.22
Facility 4.22
VA AVG 3.74
Rank #37 / 89
-33%+13%
$0
Facility $0
VA AVG $54.3k
Rank #1 / 93
95
Facility 95
VA AVG 38.4
Rank #87 / 90
19.0
Facility 19.0
VA AVG 8.9
Rank #89 / 90
9125F
36
Facility 36
VA AVG 44
Rank #257 / 449
Kimberly Owens
$15.0M
Facility $15.0M
VA AVG $18.3M
Rank #59 / 89
$7.0M
Facility $7.0M
VA AVG $6.9M
Rank #57 / 89
46.2%
Facility 46.2%
VA AVG 39.7%
Rank #42 / 89
495211

Financial Assistance for
Nursing Home in Virginia

Alexandria Rehabilitation & Healthcare Center is located in Alexandria, Virginia.
Here are the financial assistance programs available to residents in Virginia.

Get Financial aid guidance

Commonwealth Coordinated Care Plus (CCC Plus)

VA Medicaid CCC Plus

Age 65+ or disabled
General Virginia resident, Medicaid-eligible, nursing home-level care need.
Income Limits (2025) ~$2,829/month 300% FBR, individual
Asset Limits $2,000 (individual), $3,000 (couple).
VA

Managed care model; high demand in urban areas.

Benefits
Personal care (5-7 hours/day) Respite (240 hours/year) Adult day care ($65/day) Home modifications ($1,500 avg.)

Virginia Respite Care Grant Program

VA Respite Grant

Age Caregiver of someone 60+
General Virginia resident.
Income Limits ~$2,500/month individual, varies
Asset Limits $40,000 individual
VA

Limited grants; rural/urban balance.

Benefits
In-home respite (up to 30 days/year) Adult day care (~$65/day) Facility respite (up to 5 days)

Adult Services Program

Virginia Adult Services (AS)

Age 60+ (or disabled 18+)
General VA resident, need significant care (2+ ADLs), not Medicaid-eligible.
Income Limits (2025) Varies by locality; typically < ~$2,510/month 200% FPL
Asset Limits Limited assets (excludes home, car); varies by DSS.
VA

Serves ~5,000 annually; focuses on low-income independence.

Benefits
Personal care (4-6 hours/week) Adult day care (~$60/day) Chore services Assessments Respite (~5 days/year)

Auxiliary Grant Program

Virginia Auxiliary Grant (AG)

Age 65+ (or disabled 18+)
General VA resident, living in approved ALF/foster care, SSI-eligible or low-income.
Income Limits (2025) ~$1,041/month (individual, SSI level + $20 disregard); higher with medical deductions.
Asset Limits $2,000 individual
VA

Serves 4,000; personal needs allowance ($90/month).

Benefits
Cash (~$1,400-$1,700/month in 2025, varies by region) for ALF/foster care costs; basic care included

Medicare Savings Program (MSP)

Virginia Medicare Savings Program

Age 65+ or disabled
General VA resident, Medicare Part A/B.
Income Limits (2025) ~$2,510/month (QMB), ~$3,380/month (SLMB), ~$3,598/month (QI)—individual.
Asset Limits $9,430 (individual), $14,130 (couple).
VA

Includes Extra Help for Part D; no waitlist.

Benefits
Covers Part B premiums ($174.70/month) Deductibles ($240/year) Copays (~20%)

Energy Assistance Program (EAP)

Virginia Energy Assistance Program

Age 60+ prioritized
General VA resident, low-income household.
Income Limits (2025) ~$3,970/month 185% FPL
Asset Limits Not assessed.
VA

Fuel, Crisis, Cooling components; serves ~100,000 households.

Benefits
Heating/cooling aid ($300-$1,000/season) Crisis aid ($500 max) Equipment repair (~$250)

VA Aid and Attendance (A&A) and Housebound Benefits

Virginia VA Aid and Attendance/Housebound

Age 65+ or disabled veteran/spouse
General VA resident, wartime service, ADL help (A&A) or homebound.
Income Limits (2025) Net income < ~$1,984/month (veteran with dependent, A&A); pension offsets income.
Asset Limits ~$155,356 net worth
VA

High veteran population; supports rural/urban needs.

Benefits
Cash (~$1,433-$2,642/month veteran, ~$951-$1,318 spouse) for care costs

Property Tax Relief for the Elderly and Disabled

Virginia Property Tax Relief

Age 65+ or disabled
General VA resident, homeowner, income/asset limits vary by locality.
Income Limits (2025) ~$50,000-$75,000/year household, e.g., Fairfax: $72,000; Richmond: $50,000
Asset Limits Varies e.g., Fairfax: $400,000 net worth; Richmond: $100,000
VA

Offered in 90% of localities; saves ~$500-$2,000/year.

Benefits
Tax exemption/deferral (~$500-$2,000/year depending on locality)

Senior Farmers’ Market Nutrition Program (SFMNP)

Virginia SFMNP

Age 60+
General VA resident, low-income.
Income Limits (2025) ~$2,322/month 185% FPL
Asset Limits Not assessed.
VA

Vouchers (~$50-$75/season); serves ~15,000 via AAAs.

Benefits
Vouchers (~$50-$75/season) for produce at farmers’ markets

Frequently Asked Questions about Alexandria Rehabilitation & Healthcare Center

What neighborhood is Alexandria Rehabilitation & Healthcare Center in?

Alexandria Rehabilitation & Healthcare Center is in the North Ridge neighborhood.

Is Alexandria Rehabilitation & Healthcare Center in a walkable area?

Alexandria Rehabilitation & Healthcare Center has a walk score of 37. Somewhat walkable. A few nearby services may be reachable on foot, but most trips require transportation.

What is the occupancy rate at Alexandria Rehabilitation & Healthcare Center?

Alexandria Rehabilitation & Healthcare Center's occupancy is 93.9%.

Does Alexandria Rehabilitation & Healthcare Center operate as a for-profit or non-profit?

Alexandria Rehabilitation & Healthcare Center is registered as a for-profit.

Are there photos of Alexandria Rehabilitation & Healthcare Center?

Yes — there are 77 photos of Alexandria Rehabilitation & Healthcare Center in the photo gallery on this page.

What is the address of Alexandria Rehabilitation & Healthcare Center?

Alexandria Rehabilitation & Healthcare Center is located at 900 Virginia Ave, Alexandria, VA 22302.

What is the phone number of Alexandria Rehabilitation & Healthcare Center?

(703) 684-9100 will put you in contact with the team at Alexandria Rehabilitation & Healthcare Center.

Guides for Better Senior Living

Care Cost Calculator: See Prices in Your Area

Nursing Home Data Explorer

Don’t Wait Too Long: 7 Red Flag Signs Your Parent Needs Assisted Living Now

The True Cost of Assisted Living in 2025 – And How Families Are Paying For It

Understanding Senior Living Costs: Pricing Models, Discounts & Financial Assistance