

Total staff
105
Employees
86
Contractors
19

We arrange tours, appointments, and even moving support so you don’t have to
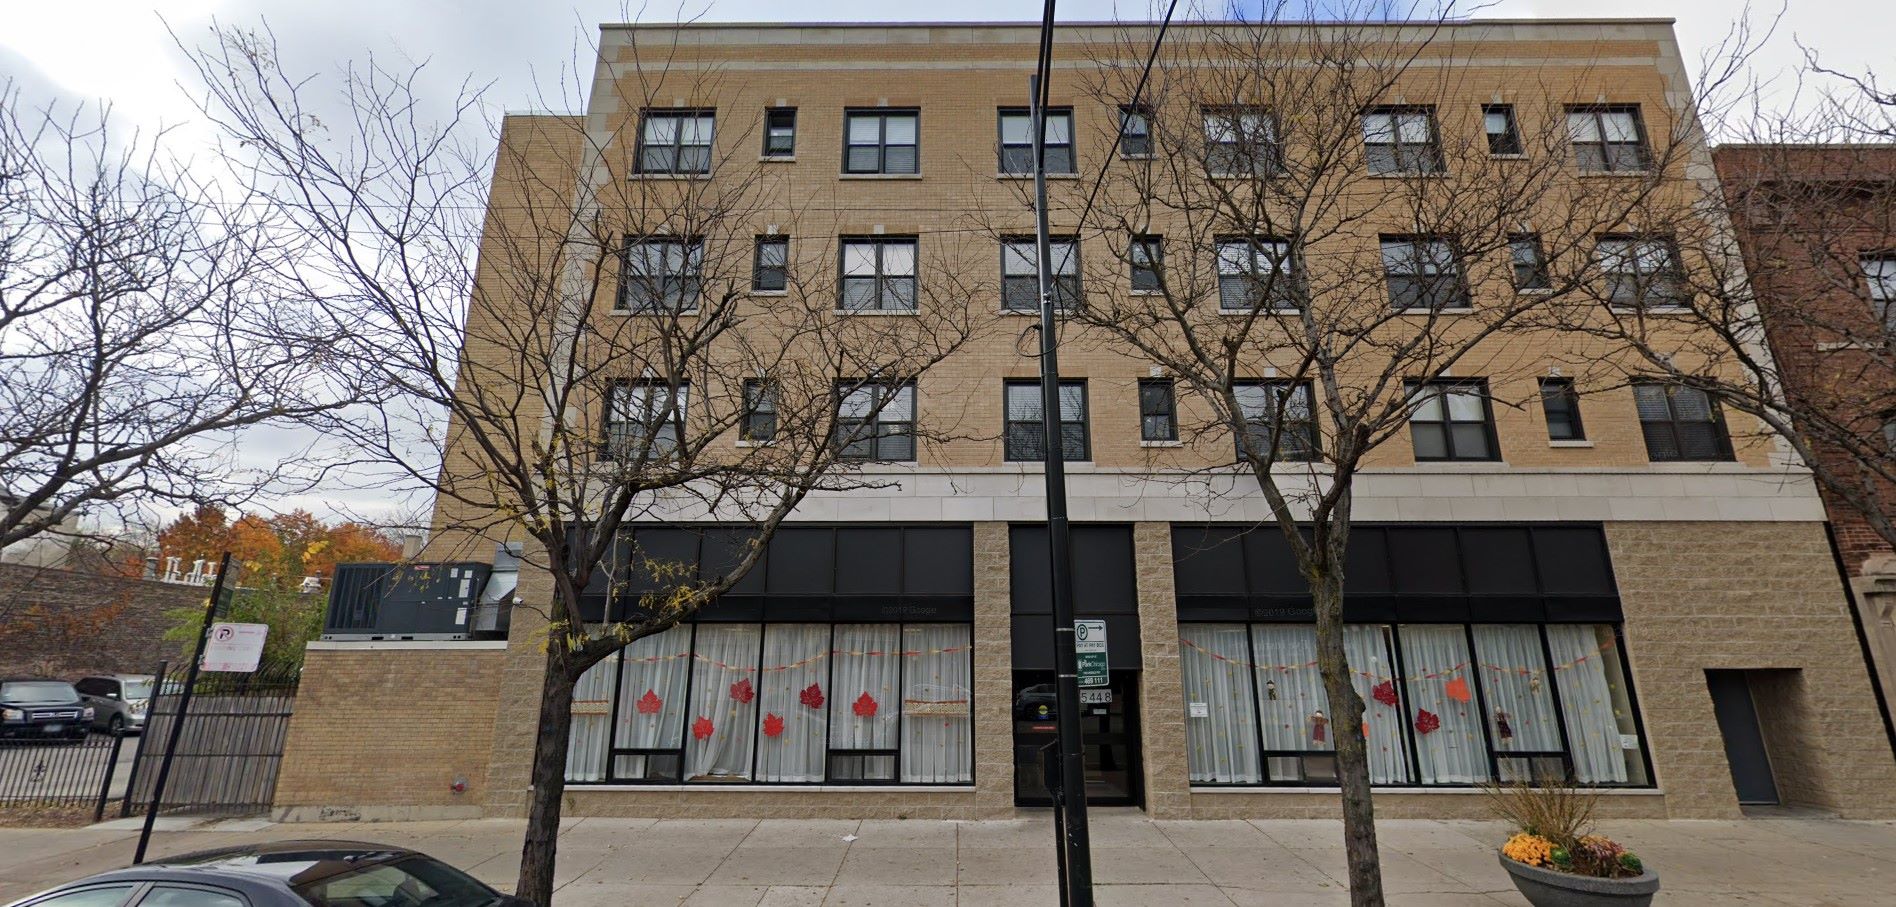


All American Village Nursing and Rehabilitation Center stands as a beacon of compassionate care and community in Chicago, IL. This state-of-the-art facility is dedicated to providing exceptional rehabilitation services and long-term care for its residents. Boasting a team of highly skilled healthcare professionals, including experienced nurses, therapists, and support staff, the center offers personalized treatment plans tailored to meet each individual’s needs. From cutting-edge rehabilitation techniques to specialized memory care programs, All American Village fosters a warm, supportive environment that promotes healing and enhances the quality of life for all its residents.
Beyond its outstanding medical care, All American Village prides itself on fostering a vibrant community where residents feel valued and engaged. The center hosts a diverse range of activities and events, encouraging social interaction and meaningful connections among residents. Additionally, the facility prioritizes family involvement, recognizing the importance of a strong support network in the recovery and well-being of its residents. With its commitment to excellence and a warm, inclusive atmosphere, All American Village Nursing and Rehabilitation Center stands as a trusted partner in providing top-tier care and support to those in need.
| Staff type | Hours / Day / Resident | vs state avg |
|---|---|---|
|
Registered Nurse (RN)
| 14m per day | ▼ 68% State avg: 44m per day · National avg: 41m per day |
|
LPN / LVN
| 40m per day | ▲ 5% State avg: 38m per day · National avg: 52m per day |
|
Nurse Aide
| 1h 23m per day | ▼ 35% State avg: 2h 8m per day · National avg: 2h 21m per day |
|
Weekend Total Nursing
| 1h 53m per day | ▼ 39% State avg: 3h 5m per day · National avg: 3h 26m per day |
|
Physical Therapist
| 1m per day | ▼ 67% State avg: 3m per day · National avg: 4m per day |
|
Weekend RN
| 7m per day | ▼ 79% State avg: 34m per day · National avg: 29m per day |
Reporting period: October 1 – December 31, 2025 (Q4 2025). Source: CMS Payroll-Based Journal report.
Manages medical care and health needs.
No contractors work on this role.
Assists with medical care and medications.
No contractors work on this role.
Helps with daily care and mobility.
No contractors work on this role.
Total hours from contractors
1,307 contractor hours this quarter
| Certified Nursing Assistant | 41 | 0 | 41 | 17,364 | 92 | 100% | 7.7 |
| Licensed Practical Nurse | 20 | 0 | 20 | 8,050 | 92 | 100% | 7.9 |
| Registered Nurse | 4 | 0 | 4 | 2,046 | 92 | 100% | 8.4 |
| RN Director of Nursing | 3 | 0 | 3 | 1,339 | 81 | 88% | 7.3 |
| Mental Health Service Worker | 5 | 1 | 6 | 1,077 | 83 | 90% | 7.5 |
| Other Dietary Services Staff | 2 | 0 | 2 | 1,030 | 91 | 99% | 7.9 |
| Clinical Nurse Specialist | 2 | 1 | 3 | 629 | 64 | 70% | 7 |
| Dietitian | 1 | 0 | 1 | 512 | 64 | 70% | 8 |
| Diagnostic X-ray Services Staff | 6 | 0 | 6 | 484 | 60 | 65% | 6.9 |
| Physical Therapy Aide | 0 | 2 | 2 | 480 | 68 | 74% | 7.1 |
| Nurse Practitioner | 1 | 0 | 1 | 473 | 63 | 68% | 7.5 |
| Administrator | 1 | 0 | 1 | 405 | 54 | 59% | 7.5 |
| Respiratory Therapy Technician | 0 | 5 | 5 | 311 | 37 | 40% | 8.1 |
| Physical Therapy Assistant | 0 | 3 | 3 | 179 | 32 | 35% | 5.6 |
| Speech Language Pathologist | 0 | 2 | 2 | 126 | 30 | 33% | 4.2 |
| Qualified Social Worker | 0 | 1 | 1 | 83 | 35 | 38% | 2.4 |
| Occupational Therapy Assistant | 0 | 1 | 1 | 48 | 6 | 7% | 8 |
| Medical Director | 0 | 2 | 2 | 36 | 3 | 3% | 6 |
| Other Physician | 0 | 1 | 1 | 30 | 12 | 13% | 2.5 |
Federal penalties imposed by CMS for regulatory violations, including civil money penalties (fines) and denials of payment for new Medicare/Medicaid admissions.
Source: CMS Penalties Database
No penalties in the past 3 years
No civil money penalties or payment denials were reported in the last 3 years.
These measures show how residents usually do over time at this home, based on health outcomes and preventive care.
Illinois average: 9.7
Illinois average: 18.6
Illinois average: 15.5%
Illinois average: 18.4%
Illinois average: 21.6%
Illinois average: 3.4%
Illinois average: 5.3%
Illinois average: 1.8%
Illinois average: 6.5%
Illinois average: 48.1%
Illinois average: 20.2%
Illinois average: 89.2%
Illinois average: 91.6%
Illinois average: 2.05
Illinois average: 2.25
Illinois average: 68.3%
Illinois average: 26.2%
Illinois average: 14.0%
Illinois average: 0.8%
Quality measures are calculated from Minimum Data Set (MDS) assessments. For most measures, lower percentages indicate better care quality.
4% of new residents, usually for short-term rehab.
2% of new residents, often for short stays.
95% of new residents, often for long-term daily care.
Source: CMS Long-Term Care Facility Characteristics (Data as of Jan 2026)
Residents meet regularly to discuss policies, care quality, and activities
Organized group of residents that meets regularly to discuss facility policies, quality of life, and activities.
Data sourced from CMS Long-Term Care Facility Characteristics quarterly report. Payer mix reflects the current resident census by primary payment source.
Historical financial and operational data for All American Village Nursing and Rehabilitation Center based on CMS SNF Cost Reports.
Most residents stay for extended periods and receive ongoing daily care.
![]() 9.3 miles from city center
9.3 miles from city center
![]() Estimated distance in miles from Chicago's city center to All American Village Nursing and Rehabilitation Center's address, calculated via Google Maps.
— 3.48 miles to nearest hospital (Ascension Saint Joseph - Chicago)
Estimated distance in miles from Chicago's city center to All American Village Nursing and Rehabilitation Center's address, calculated via Google Maps.
— 3.48 miles to nearest hospital (Ascension Saint Joseph - Chicago)
Add your location
All American Village Nursing and Rehabilitation Center is located in Chicago, Illinois.
Here are the financial assistance programs available to residents in Illinois.
The information below is reported by the Illinois Department of Public Health, Office of Health Care Regulation.
| Asbury Gardens |
NH Nursing Home Licensed facility providing 24/7 skilled nursing care for residents with complex, ongoing medical needs. Staffed by RNs, LPNs, and CNAs. Inspected and star-rated annually by CMS. Accepts Medicare (short-term rehab) and Medicaid (long-term care).
AL Assisted Living A licensed, long-term care setting for seniors or individuals with disabilities who need help with daily activities — like bathing, dressing, and medication management — but not 24-hour skilled nursing. Offers housing, meals, and around-the-clock support while aiming to maximize resident independence.
IL Independent Living Lifestyle-focused communities for older adults offering dining, activities, and transportation with minimal personal care. Best for active, independent seniors who want community without medical support.
MC Memory Care Secured, specialized care for people living with Alzheimer's or dementia. Staff trained in cognitive impairment, with higher staff-to-resident ratios and an environment designed to reduce confusion and wandering risk. | North Aurora (Airport Road) | 75 | 80.8% | +17% | 4.00 | +6% | +29% | $6.4k | 21 | 3.5 | - | 59 | A+ | 38 | Abraham Diamond | $8.6M | $5.1M | 59.8% | 146170 | ||||
| Admiral at the Lake |
NH Nursing Home Licensed facility providing 24/7 skilled nursing care for residents with complex, ongoing medical needs. Staffed by RNs, LPNs, and CNAs. Inspected and star-rated annually by CMS. Accepts Medicare (short-term rehab) and Medicaid (long-term care).
AL Assisted Living A licensed, long-term care setting for seniors or individuals with disabilities who need help with daily activities — like bathing, dressing, and medication management — but not 24-hour skilled nursing. Offers housing, meals, and around-the-clock support while aiming to maximize resident independence.
IL Independent Living Lifestyle-focused communities for older adults offering dining, activities, and transportation with minimal personal care. Best for active, independent seniors who want community without medical support.
MC Memory Care Secured, specialized care for people living with Alzheimer's or dementia. Staff trained in cognitive impairment, with higher staff-to-resident ratios and an environment designed to reduce confusion and wandering risk. | Chicago (Uptown) | 56 | 88.6% | +28% | 4.93 | -22% | +59% | $0 | 26 | 5.2 | 1 | 27 | A+ | 90 | Nadia Geigler | $25.6M | $11.0M | 42.8% | 146165 | ||||
| Encore Village of Schaumburg |
NH Nursing Home Licensed facility providing 24/7 skilled nursing care for residents with complex, ongoing medical needs. Staffed by RNs, LPNs, and CNAs. Inspected and star-rated annually by CMS. Accepts Medicare (short-term rehab) and Medicaid (long-term care).
AL Assisted Living A licensed, long-term care setting for seniors or individuals with disabilities who need help with daily activities — like bathing, dressing, and medication management — but not 24-hour skilled nursing. Offers housing, meals, and around-the-clock support while aiming to maximize resident independence.
IL Independent Living Lifestyle-focused communities for older adults offering dining, activities, and transportation with minimal personal care. Best for active, independent seniors who want community without medical support.
MC Memory Care Secured, specialized care for people living with Alzheimer's or dementia. Staff trained in cognitive impairment, with higher staff-to-resident ratios and an environment designed to reduce confusion and wandering risk. | Schaumburg | 109 | 55.4% | -20% | 3.46 | +8% | +12% | $25.5k | 28 | 2.6 | 2 | 114 | A+ | 58 | Il Ccrc, LLC | $96.9M | $18.2M | 18.8% | 145341 | ||||
| All American Village Nursing and Rehabilitation Center |
NH Nursing Home Licensed facility providing 24/7 skilled nursing care for residents with complex, ongoing medical needs. Staffed by RNs, LPNs, and CNAs. Inspected and star-rated annually by CMS. Accepts Medicare (short-term rehab) and Medicaid (long-term care). | Chicago (Edgewater) | 145 | 95.2% | +37% | 1.51 | -73% | -51% | $0 | 32 | 3.2 | - | 138 | - | 95 | - | $10.5M | $6.2M | 59.1% | 146198 | ||||
| Mayfield Care Rehab Center |
NH Nursing Home Licensed facility providing 24/7 skilled nursing care for residents with complex, ongoing medical needs. Staffed by RNs, LPNs, and CNAs. Inspected and star-rated annually by CMS. Accepts Medicare (short-term rehab) and Medicaid (long-term care). | Chicago (Austin) | 156 | 66.7% | -4% | 2.56 | -64% | -17% | $416.6k | 80 | 4.4 | 12 | 104 | A+ | 81 | - | $12.2M | $8.4M | 68.9% | 145885 |
All American Village Nursing and Rehabilitation Center is in the Edgewater neighborhood.
All American Village Nursing and Rehabilitation Center has a walk score of 95. Walker's paradise. Daily errands do not require a car, with many shops and services nearby.
Yes — there are 3 photos of All American Village Nursing and Rehabilitation Center in the photo gallery on this page.
(773) 334-2224 will put you in contact with the team at All American Village Nursing and Rehabilitation Center.
Yes — All American Village Nursing and Rehabilitation Center is a CMS-certified provider of Medicare and Medicaid.
Care Cost Calculator: See Prices in Your Area
Nursing Home Data Explorer
Don’t Wait Too Long: 7 Red Flag Signs Your Parent Needs Assisted Living Now
The True Cost of Assisted Living in 2025 – And How Families Are Paying For It
Understanding Senior Living Costs: Pricing Models, Discounts & Financial Assistance


Thank you for your interest!
Our team will be in touch shortly to help with next steps.
