Andover Forest Post Acute Care Center
Nursing Home & Nursing Care · North Andover, MA
CMS overall rating Info CMS (the Centers for Medicare & Medicaid Services) is the federal agency that rates nursing home quality. Its Overall Rating runs from 1 to 5 stars, combining health inspections, staffing, and quality measures, with inspections weighted most heavily.

Andover Forest Post Acute Care Center

Nursing Home & Nursing Care · North Andover, MA
CMS overall rating Info CMS (the Centers for Medicare & Medicaid Services) is the federal agency that rates nursing home quality. Its Overall Rating runs from 1 to 5 stars, combining health inspections, staffing, and quality measures, with inspections weighted most heavily.
Calculator: See prices in your area
Andover Forest Post Acute Care Center accepts Medicare, Medicaid, and private pay.

Overview of Andover Forest Post Acute Care Center

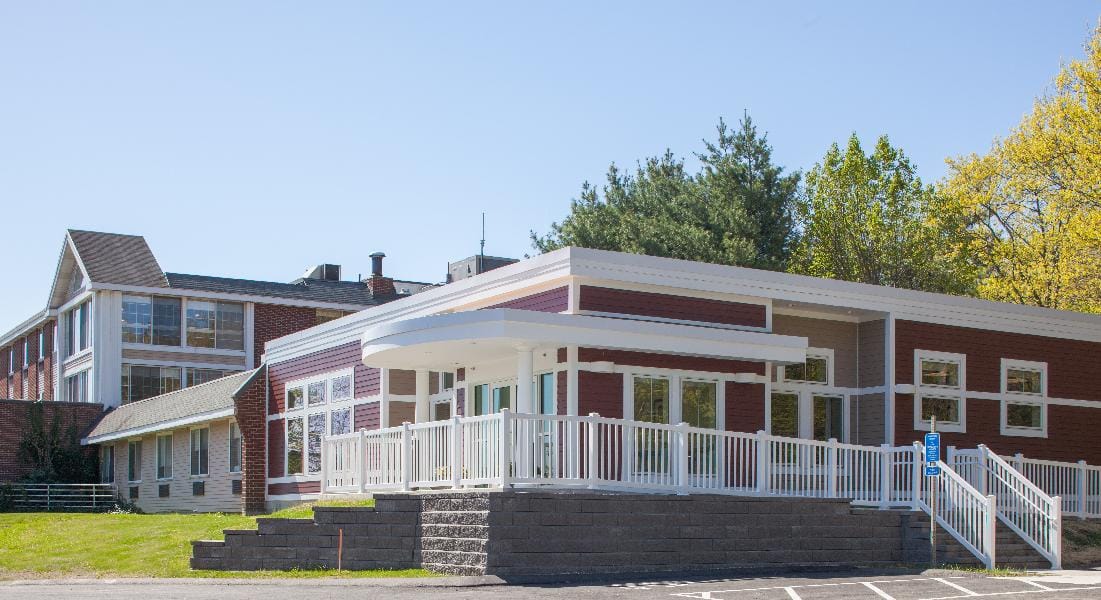
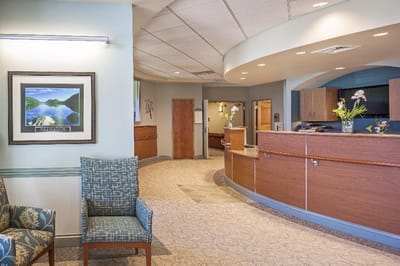
Andover Forest Post Acute Care Center in North Andover, MA, is a nursing home that offers rehabilitation and skilled nursing. The community’s compassionate and supportive environment ensures older adults are well-cared for. With 24-hour care, housekeeping, and home-cooked meals, residents receive the utmost attention and care to live comfortably. Through personalized care plans, the community strives to get to know residents’ needs and habits to help them recover and return to their routines.

Fun gatherings, exercises, and games encourage residents to explore interests and gain meaningful experiences. Top-notch rehabilitation equipment and thoughtfully curated amenities also ensure residents can rest and move around safely. Located near Farnums Mill Pond in the tree-lined neighborhood of North Andover, the community ensures residents have a stress-free retirement. This nursing home is committed to helping older adults live to their potential, making it an ideal choice for senior living in Massachusetts.

Quality ratings

Measured by Centers for Medicare & Medicaid Services (CMS)

Overall rating Info The Overall CMS Rating combines results from health inspections, staffing levels and quality measures. Health inspections carry the most weight. Staffing and quality scores can increase or decrease the final rating based on performance compared to state and national standards.
▼ 31.0% Below MA avg. ▼ 31.0% Below MA avg.MA average: 2.9Click the badge to see the full State ranking.Click here to see the full State ranking.
Health Inspection Info Based on the results of the facility's three most recent standard inspections and any complaint investigations. CMS reviews the number, scope, and severity of deficiencies, with more recent findings weighted more heavily.
▼ 29.7% Below MA avg. ▼ 29.7% Below MA avg.MA average: 2.8Click the badge to see the full State ranking.Click here to see the full State ranking.
Staffing Info Measures average nursing staff hours per resident per day, including Registered Nurses (RNs) and total nursing staff. Ratings are adjusted based on the level of care residents require and are compared to state and national benchmarks.
At MA avg. At MA avg.MA average: 3.0Click the badge to see the full State ranking.Click here to see the full State ranking.
Quality Measures Info Based on clinical and physical health indicators reported to CMS, such as hospital readmissions, falls, pressure ulcers, and improvements in mobility. These measures reflect how well residents' health needs are being managed.
▲ 25.8% Above MA avg. ▲ 25.8% Above MA avg.MA average: 3.2Click the badge to see the full State ranking.Click here to see the full State ranking.

Staffing hours breakdown

Info Daily nursing hours per resident by staff type, reported to CMS. Higher is generally better — compare this facility to state and national averages to see where staffing stands.

Hours per resident per day — compared to Massachusetts state averages

Total nursing care / resident Info This home is ranked 58th out of 93 homes in Massachusetts for nurse hours. Total adjusted nursing hours per resident per day, combining RN, LPN, and aide time. CMS adjusts this for case-mix so facilities can be fairly compared.
3h 45m per day
Rank #58 / 93Nurse hours — State benchmarkedThis home is ranked 58th out of 93 homes in Massachusetts. Shows adjusted nurse hours per resident per day benchmarked to the Massachusetts average, with a ranking across 93 Massachusetts facilities. More hours mean more direct care. The national average is about 3.5 hrs; below 3.0 is a red flag.Rankings are based only on facilities in Massachusetts that report data for that category. Facilities without available data are excluded from the ranking.Click the rank badge to see the full State ranking.Click here to see the full State ranking.
This facility Massachusetts avg (3h 56m per day)
vs Massachusetts avg
-5%

5 of 6 metrics below state avg

Staff typeHours / Day / Residentvs state avg
Registered Nurse (RN) Info RNs hold the highest nursing license and can assess residents, interpret test results, and direct care plans. More RN hours per day often signals stronger clinical oversight and faster response to health changes. 25m per day ▼ 37% State avg: 39m per day · National avg: 41m per day
LPN / LVN Info Licensed Practical Nurses (LPNs) or Licensed Vocational Nurses (LVNs) deliver routine hands-on care — medication administration, wound dressing, and monitoring vital signs. They work under RN supervision and make up a large share of daily bedside care. 58m per day ■ Avg State avg: 57m per day · National avg: 52m per day
Nurse Aide Info Certified Nurse Aides (CNAs) provide the most direct day-to-day assistance: bathing, dressing, feeding, and mobility. Nurse aide hours are typically the largest staffing category and directly affect residents' quality of life. 2h 12m per day ▼ 3% State avg: 2h 16m per day · National avg: 2h 20m per day
Weekend Total Nursing Info Combined nursing hours (RN + LPN + Nurse Aide) per resident per day on weekends. Staffing often drops on weekends — this figure reveals whether the facility maintains adequate coverage outside of weekday hours. 3h 13m per day ▼ 8% State avg: 3h 29m per day · National avg: 3h 27m per day
Physical Therapist Info Hours per resident per day provided by licensed Physical Therapists (PTs) or PT Assistants. PT services help residents recover mobility after injury or illness and are especially important for post-acute (short-stay) rehabilitation. 3m per day ▼ 42% State avg: 5m per day · National avg: 4m per day
Weekend RN Info Registered nurse hours specifically on weekends. Facilities sometimes reduce RN presence on Saturdays and Sundays — a low weekend RN figure compared to weekday hours can indicate reduced clinical oversight when most administrative staff are absent. 15m per day ▼ 45% State avg: 27m per day · National avg: 29m per day

Capacity and availability

This home usually has availability

Higher occupancy than the Massachusetts average: 82%
Occupancy rate
84.2% Rank #53 / 96Occupancy rate — State benchmarkedThis home is ranked 53rd out of 96 homes in Massachusetts. Shows this facility's occupancy rate versus the Massachusetts average, with its Statewide rank out of 96. Higher occupancy signals strong local demand and financial stability.Rankings are based only on facilities in Massachusetts that report data for that category. Facilities without available data are excluded from the ranking.Click the rank badge to see the full State ranking.Click here to see the full State ranking.
Avg. Length of Stay
130 days
Bed community size
142-bed community Rank #34 / 280Bed count — State benchmarkedThis home is ranked 34th out of 280 homes in Massachusetts. Shows this facility's certified or reported bed count compared to other Massachusetts facilities. Larger communities may offer more amenities, programs, and on-site services for residents and families.Rankings are based only on facilities in Massachusetts that report data for that category. Facilities without available data are excluded from the ranking.Click the rank badge to see the full State ranking.Click here to see the full State ranking.
A larger shared setting that may offer more common spaces and organized community services.
Walk Score
Walk Score: 23 / 100 Rank #395 / 499Walk Score — State benchmarkedThis home is ranked 395th out of 499 homes in Massachusetts. Shows how walkable this facility's neighborhood is compared to the average Walk Score across Massachusetts facilities. Higher scores benefit residents, families, and staff.Rankings are based only on facilities in Massachusetts that report data for that category. Facilities without available data are excluded from the ranking.Click the rank badge to see the full State ranking.Click here to see the full State ranking.
Car-dependent. Most errands require a car, with limited nearby walkable options.

Therapy & Rehabilitation

1 service
Rehabilitation Services

Staffing & Medical

1 service
Doctor on Staff

Amenities & Lifestyle

Salon
Barber
Courtyard
Housekeeping
Laundry
Private Dining
Activities
Wellness Program
Specific ProgramsSpeech Therapy, Occupational Therapy, Postoperative Care, Physical Therapy

Contact Andover Forest Post Acute Care Center

Staffing Data

Reporting period: October 1 – December 31, 2025 (Q4 2025). Source: CMS Payroll-Based Journal report.

Total staff 120
Employees 111
Contractors 9
Staff to resident ratio 1.14 : 1
31% fewer staff per resident than Massachusetts average
Massachusetts average ratio: 1.66 : 1 Massachusetts average ratio: 1.66 : 1See full Massachusetts ranking
Avg staff/day 52
Average shift 8.2 hours
0% compared with Massachusetts average
Massachusetts average: 7.9 hours Massachusetts average shift: 7.9 hoursSee full Massachusetts ranking
Total staff hours (quarter) 39,415

Nursing staff breakdown

Q4 2025 · Oct 1 – Dec 31 More info This data comes from the CMS Payroll-Based Journal report covering October 1 – December 31, 2025.
Registered Nurse

Manages medical care and health needs.

RN Staff Info All 12 RN Staff are full-time employees. No contractors work on this role. 12
Average shift length Info Average shift length. Calculated as total hours divided by days worked and average staff per day. 8.5 hours
Licensed Practical Nurse

Assists with medical care and medications.

LPN Staff Info All 25 LPN Staff are full-time employees. No contractors work on this role. 25
Average shift length Info Average shift length. Calculated as total hours divided by days worked and average staff per day. 9.4 hours
Certified Nursing Assistant

Helps with daily care and mobility.

CNA Staff Info All 56 CNA Staff are full-time employees. No contractors work on this role. 56
Average shift length Info Average shift length. Calculated as total hours divided by days worked and average staff per day. 8.1 hours

Contractor staffing

Q4 2025 · Oct 1 – Dec 31 More info This data comes from the CMS Payroll-Based Journal report covering October 1 – December 31, 2025.

Total hours from contractors

5.2%

2,039 contractor hours this quarter

Physical Therapy Assistant: 2 Respiratory Therapy Technician: 2 Speech Language Pathologist: 2 Physical Therapy Aide: 2 Qualified Social Worker: 1

Staff by category

Q4 2025 · Oct 1 – Dec 31 More info This data comes from the CMS Payroll-Based Journal report covering October 1 – December 31, 2025.
Certified Nursing Assistant5605621,43792100%8.1
Licensed Practical Nurse250258,81592100%9.4
Registered Nurse120122,7599199%8.5
Other Dietary Services Staff7071,0939098%6.7
Clinical Nurse Specialist2027446470%8
RN Director of Nursing2026084852%8
Physical Therapy Assistant0225596470%7.5
Dietitian1015126470%8
Nurse Practitioner3035046368%8
Qualified Social Worker0114936470%7.7
Administrator2024886166%8
Respiratory Therapy Technician0224306065%7.2
Mental Health Service Worker1014165257%8
Physical Therapy Aide0223885257%7.5
Speech Language Pathologist0221694246%4
56 Certified Nursing Assistant
% of Days 100%
25 Licensed Practical Nurse
% of Days 100%
12 Registered Nurse
% of Days 99%
7 Other Dietary Services Staff
% of Days 98%
2 Clinical Nurse Specialist
% of Days 70%
2 RN Director of Nursing
% of Days 52%
2 Physical Therapy Assistant
% of Days 70%
1 Dietitian
% of Days 70%
3 Nurse Practitioner
% of Days 68%
1 Qualified Social Worker
% of Days 70%
2 Administrator
% of Days 66%
2 Respiratory Therapy Technician
% of Days 65%
1 Mental Health Service Worker
% of Days 57%
2 Physical Therapy Aide
% of Days 57%
2 Speech Language Pathologist
% of Days 46%

Penalties and fines

Includes penalties issued in 2023-2024

Federal penalties imposed by CMS for regulatory violations, including civil money penalties (fines) and denials of payment for new Medicare/Medicaid admissions.

Source: CMS Penalties Database (Data as of Jan 2026)

Total fines amount $54K Rank #79 / 94Federal fines — State benchmarkedThis home is ranked 79th out of 94 homes in Massachusetts. Shows this facility's cumulative CMS federal fine dollars versus the Massachusetts average among facilities with fines, and where it ranks among 94 facilities in the pool. Lower total dollars mean a better rank.Rankings are based only on facilities in Massachusetts that report data for that category. Facilities without available data are excluded from the ranking.Click the rank badge to see the full State ranking.Click here to see the full State ranking.
25% lower than Massachusetts average

Massachusetts average: $72K

Number of fines 4
133% more fines than Massachusetts average

Massachusetts average: 1.7

Payment Denials Info Serious action where Medicare and/or Medicaid temporarily stops payments for new residents until issues are fixed. 0
100% fewer payment denials than Massachusetts average

Massachusetts average: 0.1

Fines amount comparison
This facility $54K
Massachusetts average $72K
Penalty History

Penalties are imposed by CMS for violations of federal nursing home regulations.

3 penalties in the past 3 years

Multiple penalties were reported in the last 3 years.

Civil Money Penalty Info Fines imposed for noncompliance, which can be assessed per day or per instance of violation. Apr 12, 2024
$26K
Civil Money Penalty Info Fines imposed for noncompliance, which can be assessed per day or per instance of violation. Sep 26, 2023
$11K
Civil Money Penalty Info Fines imposed for noncompliance, which can be assessed per day or per instance of violation. Aug 29, 2023
$8K

Last updated: Jan 2026

Quality of care over time

These measures show how residents usually do over time at this home, based on health outcomes and preventive care.

High-risk clinical events score Info A composite score based on pressure ulcers, falls with injury, weight loss, walking ability decline, and activities of daily living decline. 7.5
26% better than Massachusetts average

Massachusetts average: 10.2

Functional decline score Info A composite score based on activities of daily living decline, walking ability decline, and incontinence. 13.6
32% better than Massachusetts average

Massachusetts average: 20.0

Long-stay resident measures
Need for Help with Daily Activities Increased Info Percent of long-stay residents whose need for help with daily activities has increased 7.7%
59% better than Massachusetts average

Massachusetts average: 18.7%

Walking Ability Worsened Info Percent of long-stay residents whose ability to move independently worsened 6.5%
66% better than Massachusetts average

Massachusetts average: 19.3%

Low Risk Residents with Bowel/Bladder Incontinence Info Percent of low risk long-stay residents who lose control of their bowels or bladder 26.7%
21% worse than Massachusetts average

Massachusetts average: 22.1%

Falls with Major Injury Info Percent of long-stay residents experiencing one or more falls with major injury 7.9%
120% worse than Massachusetts average

Massachusetts average: 3.6%

High Risk Residents with Pressure Ulcers Info Percent of long-stay high risk residents with pressure ulcers 2.3%
50% better than Massachusetts average

Massachusetts average: 4.7%

Urinary Tract Infection Info Percent of long-stay residents with a urinary tract infection 0.8%
62% better than Massachusetts average

Massachusetts average: 2.1%

Lost Too Much Weight Info Percent of long-stay residents who lose too much weight 13.2%
156% worse than Massachusetts average

Massachusetts average: 5.2%

Depressive Symptoms Info Percent of long-stay residents who have depressive symptoms 16.9%
58% worse than Massachusetts average

Massachusetts average: 10.7%

Antipsychotic Use Info Percent of long-stay residents who received an antipsychotic medication 25.1%
24% worse than Massachusetts average

Massachusetts average: 20.3%

Pneumococcal Vaccine Info Percent of long-stay residents assessed and appropriately given the pneumococcal vaccine 98.7%
7% better than Massachusetts average

Massachusetts average: 91.9%

Influenza Vaccine Info Percent of long-stay residents assessed and appropriately given the seasonal influenza vaccine 98.1%
In line with Massachusetts average

Massachusetts average: 94.8%

Short-stay resident measures
Pneumococcal Vaccine Info Percent of short-stay residents assessed and appropriately given the pneumococcal vaccine 97.3%
27% better than Massachusetts average

Massachusetts average: 76.7%

Antipsychotic medication increase Info Percent of short-stay residents who newly received an antipsychotic medication 0.0%
100% better than Massachusetts average

Massachusetts average: 1.3%

Influenza Vaccine Info Percent of short-stay residents assessed and appropriately given the seasonal influenza vaccine 90.4%
16% better than Massachusetts average

Massachusetts average: 77.7%

Breakdown by payment type

Medicare

30% of new residents, usually for short-term rehab.

Typical stay 29 days

Private pay

64% of new residents, often for short stays.

Typical stay 1 months

Medicaid

6% of new residents, often for long-term daily care.

Typical stay 9 - 10 years

Facility Characteristics

Source: CMS Long-Term Care Facility Characteristics (Data as of Jan 2026)

Total residents 105
Medicare
12
11.4% of residents
Medicaid
60
57.1% of residents
Private pay or other
33
31.4% of residents
Programs & Services
Residents Group

Residents meet regularly to discuss policies, care quality, and activities

Active Resident Council

Organized group of residents that meets regularly to discuss facility policies, quality of life, and activities.

Finances and operations

Based on CMS SNF Cost Report for fiscal year ending in 10/2023.

For-profit
Corporation
Net patient revenue Info Net patient revenue — what the home actually collects for resident care, after contractual allowances, bad debt and discounts are subtracted from its gross charges (CMS cost report, Worksheet G-3). It covers resident care only; money the home earns from other sources is shown separately as "Other income."
$11.4M
Net patient income Info Net patient income: net patient revenue minus the home's total operating expenses. A positive figure means it earns more from resident care than it spends to deliver it; a negative figure means the opposite. It excludes non-operating "other income."
-$633.9K
For-profit Corporation
Net patient revenue Info Net patient revenue — what the home actually collects for resident care, after contractual allowances, bad debt and discounts are subtracted from its gross charges (CMS cost report, Worksheet G-3). It covers resident care only; money the home earns from other sources is shown separately as "Other income."
$11.4M Rank #59 / 96Revenue — State benchmarkedThis home is ranked 59th out of 96 homes in Massachusetts. Shows this facility's annual revenue compared to the Massachusetts average. Higher revenue generally means more resources for staffing and capital — read alongside Payroll %.Rankings are based only on facilities in Massachusetts that report data for that category. Facilities without available data are excluded from the ranking.Click the rank badge to see the full State ranking.Click here to see the full State ranking.
Net patient income Info Net patient income: net patient revenue minus the home's total operating expenses. A positive figure means it earns more from resident care than it spends to deliver it; a negative figure means the opposite. It excludes non-operating "other income."
-$633.9K
Other income Info Money the home earns outside of resident care — such as investments, grants, rentals and other non-operating sources (CMS cost report, Worksheet G-3). It is tracked separately from net patient revenue: it is not part of that figure, and it is not included in net patient income.
$121.6K
Payroll costs Info Staff salaries plus wage-related costs — benefits such as payroll taxes, health insurance and retirement — from the home's own accounting records (CMS cost report, Worksheet A). Contract or agency labor is counted separately, under other operating costs. Rank #65 / 96Payroll — State benchmarkedThis home is ranked 65th out of 96 homes in Massachusetts. Shows total annual staff payroll benchmarked to the Massachusetts average. Higher payroll investment relative to peers often signals better staffing and less reliance on cheaper contract labor.Rankings are based only on facilities in Massachusetts that report data for that category. Facilities without available data are excluded from the ranking.Click the rank badge to see the full State ranking.Click here to see the full State ranking.
$5.0M 44.2% of net patient revenue Info Payroll as a share of revenue: staff salaries and wage-related benefits divided by net patient revenue. A higher figure means more of each revenue dollar goes to staff pay. Rank #65 / 96Payroll % — State benchmarkedThis home is ranked 65th out of 96 homes in Massachusetts. Shows payroll as a percentage of revenue versus the Massachusetts average. Well-run Massachusetts facilities typically land around 54–65% — the top third Statewide. Below 25% may signal understaffing or heavy agency use — read with Staffing ratings.Rankings are based only on facilities in Massachusetts that report data for that category. Facilities without available data are excluded from the ranking.Click the rank badge to see the full State ranking.Click here to see the full State ranking.
Other operating costs Info Everything it costs to run the home apart from payroll — food, utilities, supplies, maintenance, contract labor and administration. Calculated as total operating expense minus payroll (staff salaries and wage-related benefits).
$7.0M
Total costs Info The home's total operating expense for the year — all the costs of running it, salaries included (CMS cost report, Worksheet G-3).
$12.0M

What does this home offer?

Building type icon
Building type icon

Building Type: 3-story

On-site medical care and health services icon

On-site Medical Care and Health Services

Rehabilitative support icon

Rehabilitative Support

Beauty services icon

Beauty Services

Housekeeping icon
Housekeeping icon

Housekeeping Services

Social and recreational activities icon

Social and Recreational Activities

Who this home usually serves

TYPE OF STAY

Primarily short stays

Residents typically stay for brief periods, with frequent admissions and discharges throughout the year.

Most new residents arrive under private pay (64% of admissions), and a typical private pay stay runs around 1 months.

Admissions
143 total

Coverage residents most often arrive under.

Medicare 30%
Private pay 64%
Medicaid 6%
Discharges
265 total

Coverage residents most often leave under.

Medicare 15%
Private pay 39%
Medicaid 46%

Places of interest near Andover Forest Post Acute Care Center

Address 5.7 miles from city center Info Estimated distance in miles from North Andover's city center to Andover Forest Post Acute Care Center's address, calculated via Google Maps.

Calculate Travel Distance to Andover Forest Post Acute Care Center

Add your location

Address

Compare Nursing Homes around North Andover

The information below is reported by the Massachusetts Executive Office of Elder Affairs and Department of Public Health.

3 facilities compared · CMS & MA Dept. of Health data

The Meadows Health Center
NH
North Andover
60
Facility 60
MA AVG 94
Rank #212 / 280
89.0%
Facility 89.0%
MA AVG 82%
Rank #36 / 96
+9%
6.01
Facility 6.01
MA AVG 3.93
Rank #4 / 93
-45%+53%
$0
Facility $0
MA AVG $76.6k
Rank #1 / 94
---37-
4
Facility 4
MA AVG 53
Rank #489 / 499
Edgewood Retirement Community, Inc
$28.2M
Facility $28.2M
MA AVG $17.4M
Rank #7 / 96
$13.3M
Facility $13.3M
MA AVG $6.5M
Rank #17 / 96
47.1%
Facility 47.1%
MA AVG 43.6%
Rank #88 / 96
225724
Andover Forest Post Acute Care Center
NH
NC
North Andover
142
Facility 142
MA AVG 94
Rank #34 / 280
84.2%
Facility 84.2%
MA AVG 82%
Rank #53 / 96
+3%
3.74
Facility 3.74
MA AVG 3.93
Rank #58 / 93
-22%-5%
$44.3k
Facility $44.3k
MA AVG $76.6k
Rank #79 / 94
44
Facility 44
MA AVG 32.7
Rank #77 / 93
8.8
Facility 8.8
MA AVG 7.2
Rank #71 / 93
5106-
23
Facility 23
MA AVG 53
Rank #395 / 499
-
$11.4M
Facility $11.4M
MA AVG $17.4M
Rank #59 / 96
$5.0M
Facility $5.0M
MA AVG $6.5M
Rank #65 / 96
44.2%
Facility 44.2%
MA AVG 43.6%
Rank #65 / 96
225530
Prescott House
NH
MC
RC
North Andover
126
Facility 126
MA AVG 94
Rank #49 / 280
95.1%
Facility 95.1%
MA AVG 82%
Rank #13 / 96
+16%
3.84
Facility 3.84
MA AVG 3.93
Rank #50 / 93
+36%-2%
$0
Facility $0
MA AVG $76.6k
Rank #1 / 94
34
Facility 34
MA AVG 32.7
Rank #62 / 93
8.5
Facility 8.5
MA AVG 7.2
Rank #68 / 93
-120-
46
Facility 46
MA AVG 53
Rank #281 / 499
Preswest Holding Company LLC
$16.9M
Facility $16.9M
MA AVG $17.4M
Rank #32 / 96
$7.5M
Facility $7.5M
MA AVG $6.5M
Rank #52 / 96
44.2%
Facility 44.2%
MA AVG 43.6%
Rank #78 / 96
225510

Financial Assistance for
Nursing Home in Massachusetts

Andover Forest Post Acute Care Center is located in North Andover, Massachusetts.
Here are the financial assistance programs available to residents in Massachusetts.

Get Financial aid guidance

Home Care Program

MassHealth Home Care

Age 60+
General Massachusetts resident, at risk of nursing home placement.
Income Limits (2025) ~$1,500/month individual, varies by region
Asset Limits $2,000 individual, excludes home, car
MA

Coordinated through Aging Services Access Points (ASAPs); high demand in urban areas.

Benefits
In-home care (3-5 hours/day) Homemaker services Respite care (up to 14 days/year) Adult day care (~$75/day)

Frail Elder Waiver

Massachusetts Medicaid FE Waiver

Age 65+
General Massachusetts resident, Medicaid-eligible, nursing home-level care need.
Income Limits (2025) ~$2,829/month 300% FBR, individual
Asset Limits $2,000 (individual), $3,000 (couple).
MA

Requires clinical eligibility determination.

Benefits
Personal care (5-7 hours/day) Respite care (240 hours/year) Adult day care (~$75/day) Home health services

Senior Care Options (SCO)

Massachusetts Senior Care Options

Age 65+
General Massachusetts resident, eligible for MassHealth (Medicare optional), nursing home-level care need.
Income Limits (2025) ~$2,829/month (300% FBR, individual); QIT allowed.
Asset Limits $2,000 (individual), $3,000 (couple) (excludes home up to $713,000, car).
MA

Not available in Dukes/Nantucket Counties; multiple SCO providers (e.g., CCA, Tufts).

Benefits
Personal care (5-7 hours/day) Medical care Respite (240 hours/year) Adult

Medicare Savings Program (MSP)

Massachusetts Medicare Savings Program (MassHealth Buy-In)

Age 65+ or disabled
General Massachusetts resident, Medicare Part A/B.
Income Limits (2025) ~$2,510/month (QMB), ~$3,380/month (SLMB), ~$3,598/month (QI)—individual.
Asset Limits $9,430 (individual), $14,130 (couple).
MA

Three tiers; no waitlist; includes Extra Help for Part D.

Benefits
Covers Part B premiums ($174.70/month) Deductibles ($240/year) Copays (~20%)

National Family Caregiver Support Program (NFCSP) Respite

Massachusetts NFCSP Respite Care

Age
General Caregivers of 60+ needing care or 55+ caregivers of others; Massachusetts resident; functional needs (2+ ADLs).
Income Limits (2025) Prioritizes ~$24,980/year (individual); no strict cap.
Asset Limits Not assessed; need-based.
MA

27 ASAPs; prioritizes low-income, rural caregivers.

Benefits
Respite (4-6 hours/week or 5 days/year) Adult day care ($60/day) Caregiver training Supplies (~$500/year)

Prescription Advantage

Massachusetts Prescription Advantage

Age 65+ or disabled
General Massachusetts resident, enrolled in Medicare Part D (or ineligible for Medicare).
Income Limits (2025) No strict limit; copays vary by income ~$24,980-$75,000/year individual
Asset Limits Not assessed.
MA

Supplements Medicare Part D; no enrollment fee for low-income.

Benefits
Covers prescription copays ($5-$40/drug) Fills coverage gaps Catastrophic cost protection ($4,000+ covered)

VA Aid and Attendance (A&A) and Housebound Benefits

Massachusetts VA Aid and Attendance/Housebound

Age 65+ or disabled veteran/spouse
General Massachusetts resident, wartime service, need for ADL help (A&A) or homebound.
Income Limits (2025) Net income < ~$1,984/month (veteran with dependent, A&A); pension offsets income.
Asset Limits ~$155,356 net worth limit
MA

High veteran demand statewide.

Benefits
Cash (~$1,433-$2,642/month veteran, ~$951-$1,318 spouse) for care costs (e.g., in-home, assisted living)

Frequently Asked Questions about Andover Forest Post Acute Care Center

Is Andover Forest Post Acute Care Center in a walkable area?

Andover Forest Post Acute Care Center has a walk score of 23. Car-dependent. Most errands require a car, with limited nearby walkable options.

What is the occupancy rate at Andover Forest Post Acute Care Center?

Andover Forest Post Acute Care Center's occupancy is 84.2%.

Does Andover Forest Post Acute Care Center operate as a for-profit or non-profit?

Andover Forest Post Acute Care Center is registered as a for-profit.

Are there photos of Andover Forest Post Acute Care Center?

Yes — there are 4 photos of Andover Forest Post Acute Care Center in the photo gallery on this page.

What is the address of Andover Forest Post Acute Care Center?

Andover Forest Post Acute Care Center is located at 1801 Turnpike St, North Andover, MA 01845.

What is the phone number of Andover Forest Post Acute Care Center?

(978) 688-1212 will put you in contact with the team at Andover Forest Post Acute Care Center.

Is Andover Forest Post Acute Care Center Medicare or Medicaid certified?

Yes — Andover Forest Post Acute Care Center is a CMS-certified provider of Medicare and Medicaid.

Guides for Better Senior Living

Care Cost Calculator: See Prices in Your Area

Nursing Home Data Explorer

Don’t Wait Too Long: 7 Red Flag Signs Your Parent Needs Assisted Living Now

The True Cost of Assisted Living in 2025 – And How Families Are Paying For It

Understanding Senior Living Costs: Pricing Models, Discounts & Financial Assistance