Prescott House
Nursing Home, Memory Care & Respite Care · North Andover, MA
CMS overall rating Info CMS (the Centers for Medicare & Medicaid Services) is the federal agency that rates nursing home quality. Its Overall Rating runs from 1 to 5 stars, combining health inspections, staffing, and quality measures, with inspections weighted most heavily.

Prescott House

Nursing Home, Memory Care & Respite Care · North Andover, MA
CMS overall rating Info CMS (the Centers for Medicare & Medicaid Services) is the federal agency that rates nursing home quality. Its Overall Rating runs from 1 to 5 stars, combining health inspections, staffing, and quality measures, with inspections weighted most heavily.
Calculator: See prices in your area
Prescott House accepts Medicare, Medicaid, and private pay.

Overview of Prescott House

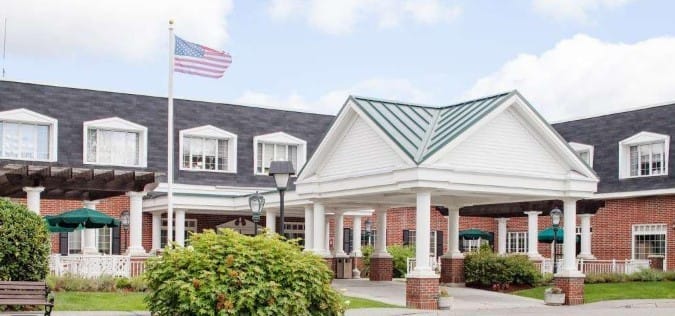
Prescott House is a nursing home in North Andover, MA, offering rehabilitation and skilled nursing. The community’s warm and nurturing environment ensures older adults are treated well throughout their stay. Social services, nutritious meals, and laundry services are also provided to enrich residents’ living experiences. The community also works closely with residents to get to know their needs and habits to provide the best possible care for their recovery.

Musical entertainment, weekly dog therapy visits, and various recreational activities encourage residents to maintain holistic wellness and gain meaningful experiences. Spacious dayrooms and a beauty salon also ensure residents can freely interact with friends and relax. Lake Cochichewick, Osgood Hill Trails, restaurants, and shops are also available in the peaceful residential area of North Andover, ensuring a laid-back lifestyle. This nursing home has excellent services for older adults’ welfare, making it one of the best options for senior living in Massachusetts.

(978) 685-8086

Quality ratings

Measured by Centers for Medicare & Medicaid Services (CMS)

Overall rating Info The Overall CMS Rating combines results from health inspections, staffing levels and quality measures. Health inspections carry the most weight. Staffing and quality scores can increase or decrease the final rating based on performance compared to state and national standards.
▼ 31.0% Below MA avg. ▼ 31.0% Below MA avg.Click the badge to see the full State ranking.Click here to see the full State ranking.
Health Inspection Info Based on the results of the facility's three most recent standard inspections and any complaint investigations. CMS reviews the number, scope, and severity of deficiencies, with more recent findings weighted more heavily.
▼ 29.7% Below MA avg. ▼ 29.7% Below MA avg.Click the badge to see the full State ranking.Click here to see the full State ranking.
Staffing Info Measures average nursing staff hours per resident per day, including Registered Nurses (RNs) and total nursing staff. Ratings are adjusted based on the level of care residents require and are compared to state and national benchmarks.
At MA avg. At MA avg.Click the badge to see the full State ranking.Click here to see the full State ranking.
Quality Measures Info Based on clinical and physical health indicators reported to CMS, such as hospital readmissions, falls, pressure ulcers, and improvements in mobility. These measures reflect how well residents' health needs are being managed.
▼ 5.6% Below MA avg. ▼ 5.6% Below MA avg.Click the badge to see the full State ranking.Click here to see the full State ranking.

Staffing hours breakdown

Info Daily nursing hours per resident by staff type, reported to CMS. Higher is generally better — compare this facility to state and national averages to see where staffing stands.

Hours per resident per day — compared to Massachusetts state averages

Total nursing care / resident Info This home is ranked 48th out of 89 homes in Massachusetts for nurse hours. Total adjusted nursing hours per resident per day, combining RN, LPN, and aide time. CMS adjusts this for case-mix so facilities can be fairly compared.
3h 50m per day
Rank #48 / 89Nurse hours — State benchmarkedThis home is ranked 48th out of 89 homes in Massachusetts. Shows adjusted nurse hours per resident per day benchmarked to the Massachusetts average, with a ranking across 89 Massachusetts facilities. More hours mean more direct care. The national average is about 3.5 hrs; below 3.0 is a red flag.Click the rank badge to see the full State ranking.Click here to see the full State ranking.
This facility Massachusetts avg (3h 56m per day)
vs Massachusetts avg
-2%

5 of 6 metrics below state avg

Standout metric LPN / LVN is +26% above state avg
Staff typeHours / Day / Residentvs state avg
Registered Nurse (RN) Info RNs hold the highest nursing license and can assess residents, interpret test results, and direct care plans. More RN hours per day often signals stronger clinical oversight and faster response to health changes. 21m per day ▼ 46% State avg: 39m per day · National avg: 41m per day
LPN / LVN Info Licensed Practical Nurses (LPNs) or Licensed Vocational Nurses (LVNs) deliver routine hands-on care — medication administration, wound dressing, and monitoring vital signs. They work under RN supervision and make up a large share of daily bedside care. 1h 13m per day ▲ 26% State avg: 57m per day · National avg: 52m per day
Nurse Aide Info Certified Nurse Aides (CNAs) provide the most direct day-to-day assistance: bathing, dressing, feeding, and mobility. Nurse aide hours are typically the largest staffing category and directly affect residents' quality of life. 2h 1m per day ▼ 11% State avg: 2h 16m per day · National avg: 2h 20m per day
Weekend Total Nursing Info Combined nursing hours (RN + LPN + Nurse Aide) per resident per day on weekends. Staffing often drops on weekends — this figure reveals whether the facility maintains adequate coverage outside of weekday hours. 3h 7m per day ▼ 10% State avg: 3h 29m per day · National avg: 3h 27m per day
Physical Therapist Info Hours per resident per day provided by licensed Physical Therapists (PTs) or PT Assistants. PT services help residents recover mobility after injury or illness and are especially important for post-acute (short-stay) rehabilitation. 3m per day ▼ 42% State avg: 5m per day · National avg: 4m per day
Weekend RN Info Registered nurse hours specifically on weekends. Facilities sometimes reduce RN presence on Saturdays and Sundays — a low weekend RN figure compared to weekday hours can indicate reduced clinical oversight when most administrative staff are absent. 10m per day ▼ 62% State avg: 27m per day · National avg: 29m per day

Capacity and availability

This home is often near full

Higher occupancy than the Massachusetts average: 82%
Occupancy rate
95.1% Rank #12 / 92Occupancy rate — State benchmarkedThis home is ranked 12th out of 92 homes in Massachusetts. Shows this facility's occupancy rate versus the Massachusetts average, with its Statewide rank out of 92. Higher occupancy signals strong local demand and financial stability.Click the rank badge to see the full State ranking.Click here to see the full State ranking.
Avg. Length of Stay
85 days
Walk Score
Walk Score: 46 / 100 Rank #281 / 499Walk Score — State benchmarkedThis home is ranked 281st out of 499 homes in Massachusetts. Shows how walkable this facility's neighborhood is compared to the average Walk Score across Massachusetts facilities. Higher scores benefit residents, families, and staff.Click the rank badge to see the full State ranking.Click here to see the full State ranking.
Somewhat walkable. A few nearby services may be reachable on foot, but most trips require transportation.

Contact Prescott House

Inspection History

In Massachusetts, the Executive Office of Elder Affairs (for assisted living facilities) and the Department of Public Health (for nursing homes) are the agencies authorized to inspect and report on facility safety.

Since 2021 · 5 years of data 18 citations

Inspection Scorecard Info This scorecard compares key inspection, citation, and complaint metrics at this facility against the Massachusetts state average. Metrics rated ≥15% worse than average are highlighted in red; those ≥15% better are highlighted in green.

Since 2021 vs. Massachusetts state average
Overall vs. MA average 0 Worse No metrics in this bucket. 0 Better No metrics in this bucket.
Latest Inspection January 23, 2025 Other An inspection that falls outside standard annual surveys and formal complaint investigations. May include administrative compliance checks, documentation reviews, focused surveys on specific concerns, or revisit surveys to verify prior corrections.

Citations Info Citations are formal regulatory issues recorded during state inspections.

This FacilityMA Averagevs. MA Avg
Total citations Info Formal regulatory issues recorded by inspectors across all inspection types. 18
Citations per year Info Average citations per year since 2021. 3.6

Health Inspection History

Inspections since 2022
Total health inspections 4

Massachusetts average 4.5


Last Health inspection on Nov 2025

Total health citations
34 Rank #59 / 89Health citations — State benchmarkedThis home is ranked 59th out of 89 homes in Massachusetts. Shows this facility's total health deficiency citations benchmarked to the Massachusetts State average, with a ranking across all 89 MA facilities. Lower citation counts earn a better rank.Click the rank badge to see the full State ranking.Click here to see the full State ranking.

Massachusetts average 32.7

Citations per inspection
8.5 Rank #66 / 89Citations per inspection — State benchmarkedThis home is ranked 66th out of 89 homes in Massachusetts. Shows average deficiency citations per CMS inspection for this facility versus the Massachusetts mean across 89 facilities with citation data. Lower is better.Click the rank badge to see the full State ranking.Click here to see the full State ranking.

Massachusetts average 7.24


Health citations are formal notices following inspections when they fail to comply with safety and care standards.

32 of 34 citations resulted from standard inspections; and 2 of 34 resulted from complaint investigations.

Breakdown of citation severity (last 4 years)
Critical health citations
0
100% better than Massachusetts average

Massachusetts average: 0.3


Serious health citations
0
100% better than Massachusetts average

Massachusetts average: 1.5

0 critical citations Massachusetts average: 0.3

0 serious citations Massachusetts average: 1.5

33 moderate citations Massachusetts average: 29.7

1 minor citation Massachusetts average: 1.3
Citations history (last 4 years)
Administration moderate citation Nov 17, 2025

Pharmacy moderate citation Nov 17, 2025

Environmental moderate citation Jan 23, 2025
Corrected

Environmental moderate citation Jan 23, 2025
Corrected

Staffing Data

Reporting period: October 1 – December 31, 2025 (Q4 2025). Source: CMS Payroll-Based Journal report.

Total staff 316
Employees 138
Contractors 178
Staff to resident ratio 2.59 : 1
56% more staff per resident than Massachusetts average
Massachusetts average ratio: 1.66 : 1 Massachusetts average ratio: 1.66 : 1See full Massachusetts ranking
Avg staff/day 75
Average shift 7.8 hours
0% compared with Massachusetts average
Massachusetts average: 7.9 hours Massachusetts average shift: 7.9 hoursSee full Massachusetts ranking
Total staff hours (quarter) 53,545

Nursing staff breakdown

Q4 2025 · Oct 1 – Dec 31 More info This data comes from the CMS Payroll-Based Journal report covering October 1 – December 31, 2025.
Registered Nurse

Manages medical care and health needs.

RN Staff Info 55 total: 9 full-time employees and 46 contractors. 55
Average shift length Info Average shift length. Calculated as total hours divided by days worked and average staff per day. 8.1 hours
Licensed Practical Nurse

Assists with medical care and medications.

LPN Staff Info 43 total: 22 full-time employees and 21 contractors. 43
Average shift length Info Average shift length. Calculated as total hours divided by days worked and average staff per day. 8.9 hours
Certified Nursing Assistant

Helps with daily care and mobility.

CNA Staff Info 150 total: 58 full-time employees and 92 contractors. 150
Average shift length Info Average shift length. Calculated as total hours divided by days worked and average staff per day. 7.5 hours

Contractor staffing

Q4 2025 · Oct 1 – Dec 31 More info This data comes from the CMS Payroll-Based Journal report covering October 1 – December 31, 2025.

Total hours from contractors

14.8%

7,939 contractor hours this quarter

Certified Nursing Assistant: 92 Registered Nurse: 46 Licensed Practical Nurse: 21 Physical Therapy Assistant: 6 Respiratory Therapy Technician: 3 Occupational Therapy Assistant: 3 Speech Language Pathologist: 2 Physical Therapy Aide: 2 Mental Health Service Worker: 1 Qualified Social Worker: 1 Medical Director: 1

Staff by category

Q4 2025 · Oct 1 – Dec 31 More info This data comes from the CMS Payroll-Based Journal report covering October 1 – December 31, 2025.
Certified Nursing Assistant589215022,32492100%7.5
Licensed Practical Nurse2221439,95192100%8.9
Physical Therapist200207,64092100%7.3
RN Director of Nursing150153,4278592%8.1
Registered Nurse946552,21092100%8.1
Other Dietary Services Staff5051,6139199%7.9
Clinical Nurse Specialist3031,2306470%7.9
Mental Health Service Worker2136846470%6.9
Physical Therapy Assistant0665787278%7
Physical Therapy Aide0225507683%6.8
Respiratory Therapy Technician0334916267%7.5
Occupational Therapy Aide1014856267%7.8
Other Social Services Staff1014756267%7.7
Speech Language Pathologist0224686672%6.8
Administrator1014596267%7.4
Nurse Practitioner1014395560%8
Qualified Social Worker0114296470%6.7
Occupational Therapy Assistant033491820%2.7
Medical Director0114533%15
150 Certified Nursing Assistant
% of Days 100%
43 Licensed Practical Nurse
% of Days 100%
20 Physical Therapist
% of Days 100%
15 RN Director of Nursing
% of Days 92%
55 Registered Nurse
% of Days 100%
5 Other Dietary Services Staff
% of Days 99%
3 Clinical Nurse Specialist
% of Days 70%
3 Mental Health Service Worker
% of Days 70%
6 Physical Therapy Assistant
% of Days 78%
2 Physical Therapy Aide
% of Days 83%
3 Respiratory Therapy Technician
% of Days 67%
1 Occupational Therapy Aide
% of Days 67%
1 Other Social Services Staff
% of Days 67%
2 Speech Language Pathologist
% of Days 72%
1 Administrator
% of Days 67%
1 Nurse Practitioner
% of Days 60%
1 Qualified Social Worker
% of Days 70%
3 Occupational Therapy Assistant
% of Days 20%
1 Medical Director
% of Days 3%

Penalties and fines

Federal penalties imposed by CMS for regulatory violations, including civil money penalties (fines) and denials of payment for new Medicare/Medicaid admissions.

Source: CMS Penalties Database

No penalties in the past 3 years

No civil money penalties or payment denials were reported in the last 3 years.

Quality of care over time

These measures show how residents usually do over time at this home, based on health outcomes and preventive care.

High-risk clinical events score Info A composite score based on pressure ulcers, falls with injury, weight loss, walking ability decline, and activities of daily living decline. 9.9
In line with Massachusetts average

Massachusetts average: 10.2

Functional decline score Info A composite score based on activities of daily living decline, walking ability decline, and incontinence. 22.7
13% worse than Massachusetts average

Massachusetts average: 20.0

Long-stay resident measures
Need for Help with Daily Activities Increased Info Percent of long-stay residents whose need for help with daily activities has increased 19.5%
In line with Massachusetts average

Massachusetts average: 18.7%

Walking Ability Worsened Info Percent of long-stay residents whose ability to move independently worsened 16.6%
14% better than Massachusetts average

Massachusetts average: 19.3%

Low Risk Residents with Bowel/Bladder Incontinence Info Percent of low risk long-stay residents who lose control of their bowels or bladder 31.8%
44% worse than Massachusetts average

Massachusetts average: 22.1%

Falls with Major Injury Info Percent of long-stay residents experiencing one or more falls with major injury 4.0%
12% worse than Massachusetts average

Massachusetts average: 3.6%

High Risk Residents with Pressure Ulcers Info Percent of long-stay high risk residents with pressure ulcers 5.0%
8% worse than Massachusetts average

Massachusetts average: 4.7%

Urinary Tract Infection Info Percent of long-stay residents with a urinary tract infection 1.6%
25% better than Massachusetts average

Massachusetts average: 2.1%

Lost Too Much Weight Info Percent of long-stay residents who lose too much weight 4.1%
21% better than Massachusetts average

Massachusetts average: 5.2%

Depressive Symptoms Info Percent of long-stay residents who have depressive symptoms 0.5%
95% better than Massachusetts average

Massachusetts average: 10.7%

Antipsychotic Use Info Percent of long-stay residents who received an antipsychotic medication 19.3%
5% better than Massachusetts average

Massachusetts average: 20.3%

Pneumococcal Vaccine Info Percent of long-stay residents assessed and appropriately given the pneumococcal vaccine 95.7%
In line with Massachusetts average

Massachusetts average: 91.9%

Influenza Vaccine Info Percent of long-stay residents assessed and appropriately given the seasonal influenza vaccine 96.2%
In line with Massachusetts average

Massachusetts average: 94.8%

Short-stay resident measures
Pneumococcal Vaccine Info Percent of short-stay residents assessed and appropriately given the pneumococcal vaccine 86.1%
12% better than Massachusetts average

Massachusetts average: 76.7%

Antipsychotic medication increase Info Percent of short-stay residents who newly received an antipsychotic medication 1.2%
10% better than Massachusetts average

Massachusetts average: 1.3%

Influenza Vaccine Info Percent of short-stay residents assessed and appropriately given the seasonal influenza vaccine 89.4%
15% better than Massachusetts average

Massachusetts average: 77.7%

Breakdown by payment type

Medicare

63% of new residents, usually for short-term rehab.

Typical stay 21 days

Private pay

32% of new residents, often for short stays.

Typical stay 2 - 3 months

Medicaid

5% of new residents, often for long-term daily care.

Typical stay 2 - 3 years

Facility Characteristics

Source: CMS Long-Term Care Facility Characteristics (Data as of Jan 2026)

Total residents 122
Medicare
15
12.3% of residents
Medicaid
81
66.4% of residents
Private pay or other
26
21.3% of residents
Programs & Services
Residents Group

Residents meet regularly to discuss policies, care quality, and activities

Active Resident Council

Organized group of residents that meets regularly to discuss facility policies, quality of life, and activities.

Finances and operations

Privately-owned community
Operated by a single business entity.
Home revenue
$23.9M
Profit
$813.5K
Privately-owned community Operated by a single business entity.
Home revenue
$23.9M Rank #31 / 92Revenue — State benchmarkedThis home is ranked 31st out of 92 homes in Massachusetts. Shows this facility's annual revenue compared to the Massachusetts average. Higher revenue generally means more resources for staffing and capital — read alongside Payroll %.Click the rank badge to see the full State ranking.Click here to see the full State ranking.
Profit
$813.5K
Payroll costs Info The portion of the home's budget spent on staff, including nurses, caregivers, and other employees who support care and operations. Rank #51 / 92Payroll — State benchmarkedThis home is ranked 51st out of 92 homes in Massachusetts. Shows total annual staff payroll benchmarked to the Massachusetts average. Higher payroll investment relative to peers often signals better staffing and less reliance on cheaper contract labor.Click the rank badge to see the full State ranking.Click here to see the full State ranking.
$10.0M
41.8% of revenue Rank #75 / 92Payroll % — State benchmarkedThis home is ranked 75th out of 92 homes in Massachusetts. Shows payroll as a percentage of revenue versus the Massachusetts average. Well-run Massachusetts facilities typically land around 54–65% — the top third Statewide. Below 25% may signal understaffing or heavy agency use — read with Staffing ratings.Click the rank badge to see the full State ranking.Click here to see the full State ranking.
Other operating costs Info All remaining costs needed to run the home, such as food, utilities, building maintenance, supplies and administrative expenses.
$13.1M
Total costs $23.1M

What does this home offer?

Building type icon
Building type icon

Building Type: 2-story

On-site medical care and health services icon

On-site Medical Care and Health Services

Rehabilitative support icon

Rehabilitative Support

Beauty services icon

Beauty Services

Social and recreational activities icon

Social and Recreational Activities

Who this home usually serves

TYPE OF STAY

Mostly short-term rehab stays

Most residents typically stay for a few weeks or months before returning home or moving on.

Places of interest near Prescott House

Address 1.4 miles from city center Info Estimated distance in miles from North Andover's city center to Prescott House's address, calculated via Google Maps.

Calculate Travel Distance to Prescott House

Add your location

Address

Financial Assistance for
Nursing Home in Massachusetts

Prescott House is located in North Andover, Massachusetts.
Here are the financial assistance programs available to residents in Massachusetts.

Get Financial aid guidance

Home Care Program

MassHealth Home Care

Age 60+
General Massachusetts resident, at risk of nursing home placement.
Income Limits (2025) ~$1,500/month individual, varies by region
Asset Limits $2,000 individual, excludes home, car
MA

Coordinated through Aging Services Access Points (ASAPs); high demand in urban areas.

Benefits
In-home care (3-5 hours/day) Homemaker services Respite care (up to 14 days/year) Adult day care (~$75/day)

Frail Elder Waiver

Massachusetts Medicaid FE Waiver

Age 65+
General Massachusetts resident, Medicaid-eligible, nursing home-level care need.
Income Limits (2025) ~$2,829/month 300% FBR, individual
Asset Limits $2,000 (individual), $3,000 (couple).
MA

Requires clinical eligibility determination.

Benefits
Personal care (5-7 hours/day) Respite care (240 hours/year) Adult day care (~$75/day) Home health services

Senior Care Options (SCO)

Massachusetts Senior Care Options

Age 65+
General Massachusetts resident, eligible for MassHealth (Medicare optional), nursing home-level care need.
Income Limits (2025) ~$2,829/month (300% FBR, individual); QIT allowed.
Asset Limits $2,000 (individual), $3,000 (couple) (excludes home up to $713,000, car).
MA

Not available in Dukes/Nantucket Counties; multiple SCO providers (e.g., CCA, Tufts).

Benefits
Personal care (5-7 hours/day) Medical care Respite (240 hours/year) Adult

Medicare Savings Program (MSP)

Massachusetts Medicare Savings Program (MassHealth Buy-In)

Age 65+ or disabled
General Massachusetts resident, Medicare Part A/B.
Income Limits (2025) ~$2,510/month (QMB), ~$3,380/month (SLMB), ~$3,598/month (QI)—individual.
Asset Limits $9,430 (individual), $14,130 (couple).
MA

Three tiers; no waitlist; includes Extra Help for Part D.

Benefits
Covers Part B premiums ($174.70/month) Deductibles ($240/year) Copays (~20%)

National Family Caregiver Support Program (NFCSP) Respite

Massachusetts NFCSP Respite Care

Age
General Caregivers of 60+ needing care or 55+ caregivers of others; Massachusetts resident; functional needs (2+ ADLs).
Income Limits (2025) Prioritizes ~$24,980/year (individual); no strict cap.
Asset Limits Not assessed; need-based.
MA

27 ASAPs; prioritizes low-income, rural caregivers.

Benefits
Respite (4-6 hours/week or 5 days/year) Adult day care ($60/day) Caregiver training Supplies (~$500/year)

Prescription Advantage

Massachusetts Prescription Advantage

Age 65+ or disabled
General Massachusetts resident, enrolled in Medicare Part D (or ineligible for Medicare).
Income Limits (2025) No strict limit; copays vary by income ~$24,980-$75,000/year individual
Asset Limits Not assessed.
MA

Supplements Medicare Part D; no enrollment fee for low-income.

Benefits
Covers prescription copays ($5-$40/drug) Fills coverage gaps Catastrophic cost protection ($4,000+ covered)

VA Aid and Attendance (A&A) and Housebound Benefits

Massachusetts VA Aid and Attendance/Housebound

Age 65+ or disabled veteran/spouse
General Massachusetts resident, wartime service, need for ADL help (A&A) or homebound.
Income Limits (2025) Net income < ~$1,984/month (veteran with dependent, A&A); pension offsets income.
Asset Limits ~$155,356 net worth limit
MA

High veteran demand statewide.

Benefits
Cash (~$1,433-$2,642/month veteran, ~$951-$1,318 spouse) for care costs (e.g., in-home, assisted living)

Compare Nursing Home around North Andover

The information below is reported by the Massachusetts Executive Office of Elder Affairs and Department of Public Health.

3 facilities compared · CMS & MA Dept. of Health data

The Meadows Health Center
NH

Nursing Home Licensed facility providing 24/7 skilled nursing care for residents with complex, ongoing medical needs. Staffed by RNs, LPNs, and CNAs. Inspected and star-rated annually by CMS. Accepts Medicare (short-term rehab) and Medicaid (long-term care).

North Andover
60
Facility 60
MA AVG 94
Rank #212 / 280
--
6.01
Facility 6.01
MA AVG 3.93
Rank #4 / 89
-45%+53%
$0
Facility $0
MA AVG $76.6k
Rank #1 / 90
---37
4
Facility 4
MA AVG 53
Rank #489 / 499
Edgewood Retirement Community, Inc.
$36.2M
Facility $36.2M
MA AVG $17.4M
Rank #7 / 92
$14.2M
Facility $14.2M
MA AVG $6.5M
Rank #17 / 92
39.3%
Facility 39.3%
MA AVG 43.6%
Rank #84 / 92
225724
Andover Forest Post Acute Care Center
NH

Nursing Home Licensed facility providing 24/7 skilled nursing care for residents with complex, ongoing medical needs. Staffed by RNs, LPNs, and CNAs. Inspected and star-rated annually by CMS. Accepts Medicare (short-term rehab) and Medicaid (long-term care).

North Andover
142
Facility 142
MA AVG 94
Rank #34 / 280
84.2%
Facility 84.2%
MA AVG 82%
Rank #50 / 92
+3%
3.74
Facility 3.74
MA AVG 3.93
Rank #55 / 89
-22%-5%
$44.3k
Facility $44.3k
MA AVG $76.6k
Rank #77 / 90
44
Facility 44
MA AVG 32.7
Rank #73 / 89
8.8
Facility 8.8
MA AVG 7.2
Rank #69 / 89
5106
23
Facility 23
MA AVG 53
Rank #395 / 499
-
$17.6M
Facility $17.6M
MA AVG $17.4M
Rank #58 / 92
$8.1M
Facility $8.1M
MA AVG $6.5M
Rank #64 / 92
46%
Facility 46%
MA AVG 43.6%
Rank #62 / 92
225530
Prescott House
NH

Nursing Home Licensed facility providing 24/7 skilled nursing care for residents with complex, ongoing medical needs. Staffed by RNs, LPNs, and CNAs. Inspected and star-rated annually by CMS. Accepts Medicare (short-term rehab) and Medicaid (long-term care).

MC

Memory Care Secured, specialized care for people living with Alzheimer's or dementia. Staff trained in cognitive impairment, with higher staff-to-resident ratios and an environment designed to reduce confusion and wandering risk.

RC

Respite Care Short-term temporary care — days to weeks — to give family caregivers a break. Full care provided during the stay. Often used after hospitalization or to trial a facility before a permanent placement decision.

North Andover
126
Facility 126
MA AVG 94
Rank #49 / 280
95.1%
Facility 95.1%
MA AVG 82%
Rank #12 / 92
+16%
3.84
Facility 3.84
MA AVG 3.93
Rank #48 / 89
+36%-2%
$0
Facility $0
MA AVG $76.6k
Rank #1 / 90
34
Facility 34
MA AVG 32.7
Rank #59 / 89
8.5
Facility 8.5
MA AVG 7.2
Rank #66 / 89
-120
46
Facility 46
MA AVG 53
Rank #281 / 499
Preswest Holding Company LLC
$23.9M
Facility $23.9M
MA AVG $17.4M
Rank #31 / 92
$10.0M
Facility $10.0M
MA AVG $6.5M
Rank #51 / 92
41.8%
Facility 41.8%
MA AVG 43.6%
Rank #75 / 92
225510

Frequently Asked Questions about Prescott House

Is Prescott House in a walkable area?

Prescott House has a walk score of 46. Somewhat walkable. A few nearby services may be reachable on foot, but most trips require transportation.

What is the occupancy rate at Prescott House?

Prescott House's occupancy is 95.1%.

Are there photos of Prescott House?

Yes — there is 1 photo of Prescott House in the photo gallery on this page.

What is the address of Prescott House?

Prescott House is located at 140 Prescott St, North Andover, MA 01845.

What is the phone number of Prescott House?

(978) 685-8086 will put you in contact with the team at Prescott House.

Is Prescott House Medicare or Medicaid certified?

Yes — Prescott House is a CMS-certified provider of Medicare and Medicaid.

Guides for Better Senior Living

Care Cost Calculator: See Prices in Your Area

Nursing Home Data Explorer

Don’t Wait Too Long: 7 Red Flag Signs Your Parent Needs Assisted Living Now

The True Cost of Assisted Living in 2025 – And How Families Are Paying For It

Understanding Senior Living Costs: Pricing Models, Discounts & Financial Assistance

Explore Open Rooms
1 Contact details
2 What type of senior care service are you looking for?
3 What budget do you have in mind for senior care?
4 How soon do you need to find care?
5 Additional details

Thank you for your interest!

Our team will be in touch shortly to help with next steps.