Arroyo Vista Nursing Center
CMS overall rating Info CMS (the Centers for Medicare & Medicaid Services) is the federal agency that rates nursing home quality. Its Overall Rating runs from 1 to 5 stars, combining health inspections, staffing, and quality measures, with inspections weighted most heavily.

Arroyo Vista Nursing Center

CMS overall rating Info CMS (the Centers for Medicare & Medicaid Services) is the federal agency that rates nursing home quality. Its Overall Rating runs from 1 to 5 stars, combining health inspections, staffing, and quality measures, with inspections weighted most heavily.
Calculator: See prices in your area
Arroyo Vista Nursing Center accepts Medicare, Medicaid, and private pay.

Overview of Arroyo Vista Nursing Center

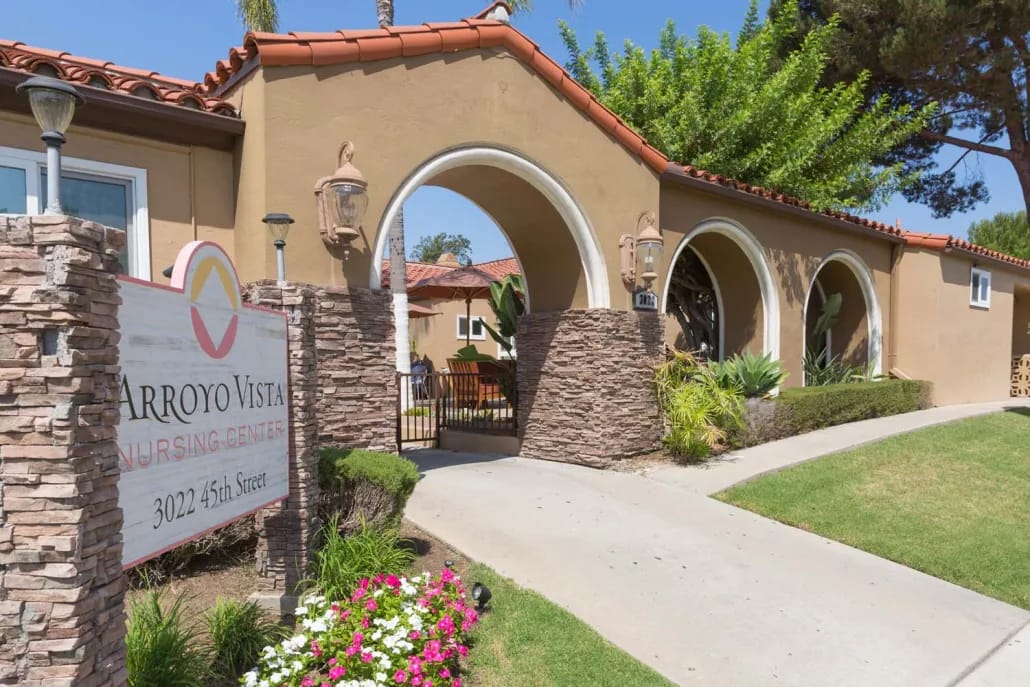
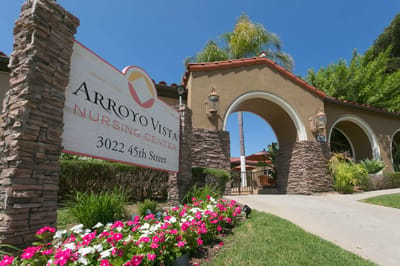
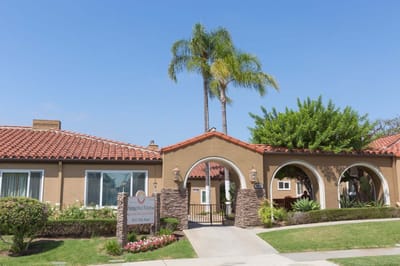
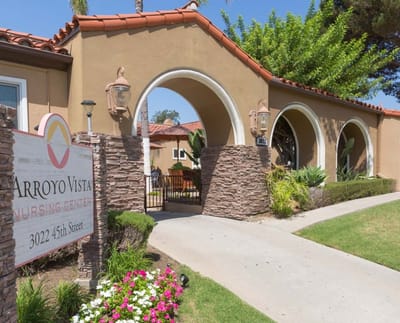
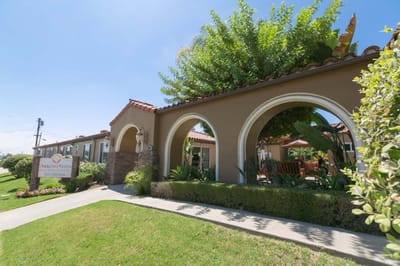
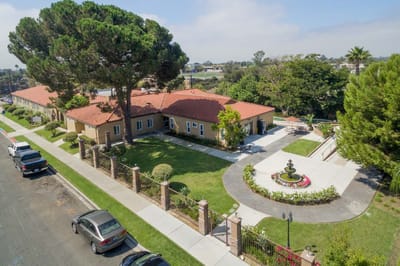
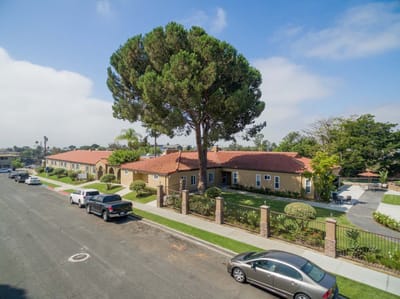
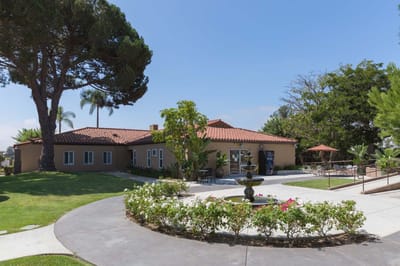
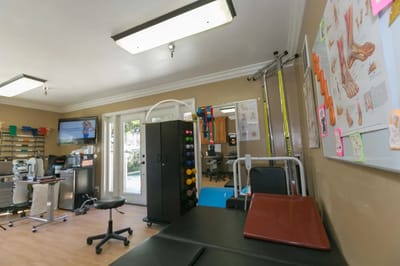
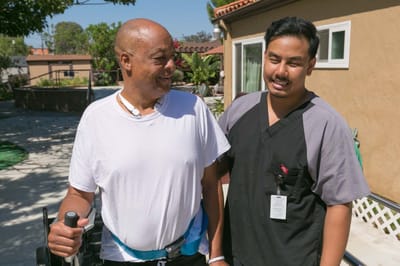
Arroyo Vista Nursing Center in San Diego, California is a welcoming and lively community that provides exceptional care to its residents. Cleanliness is a top priority at Arroyo Vista Nursing Center, as it plays a vital role in the residents’ overall health and well-being. The team includes physical therapists, occupational therapists, physical therapy assistants, speech pathologists, and other skilled professionals. Rehab therapists work on-site, allowing them to develop meaningful relationships with the residents. 
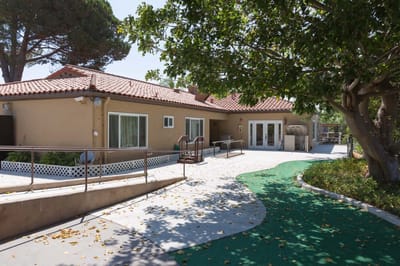
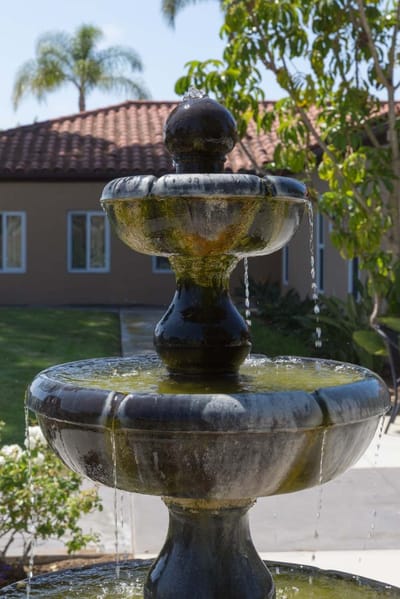
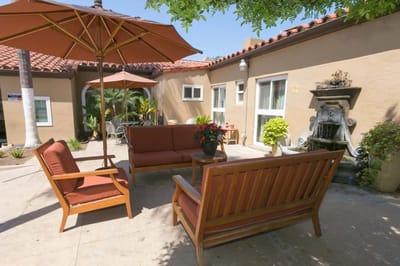
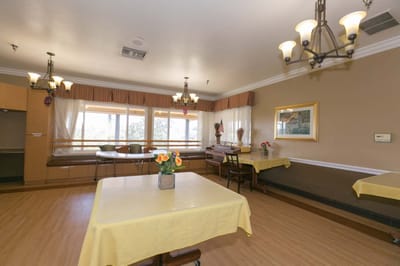
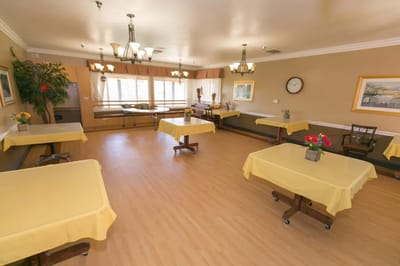
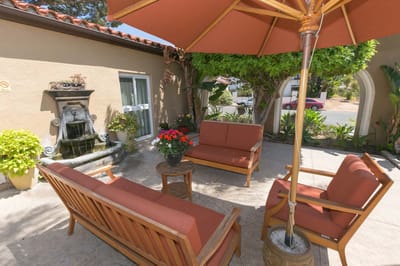
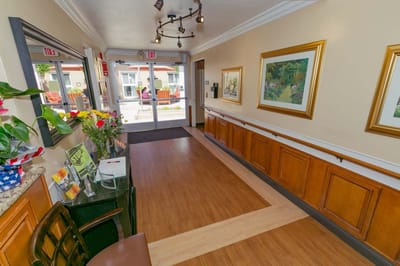
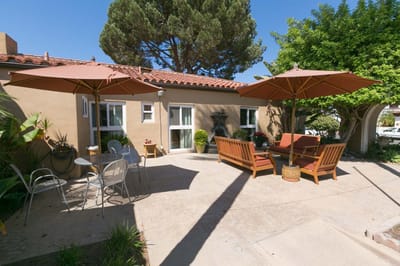
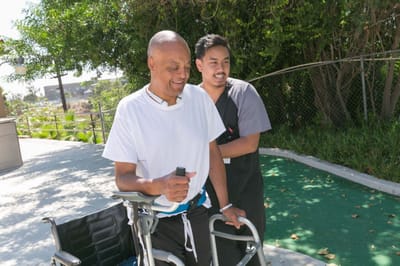
They feature a state-of-the-art therapy gym, where highly skilled therapists utilize both cutting-edge technology and hands-on techniques to ensure the best possible outcomes for the residents. The facility also boasts outdoor spaces, including a lovely patio area, that provides a serene and lush environment to relax and unwind. The dining room is filled with natural light and the interior is adorned with beautiful artwork, creating an ambiance of comfort and elegance.

(619) 283-5855

Quality ratings

Measured by Centers for Medicare & Medicaid Services (CMS)

Overall rating Info The Overall CMS Rating combines results from health inspections, staffing levels and quality measures. Health inspections carry the most weight. Staffing and quality scores can increase or decrease the final rating based on performance compared to state and national standards.
▲ 27.0% Above CA avg. ▲ 27.0% Above CA avg.CA average: 3.1Click the badge to see the full State ranking.Click here to see the full State ranking.
Health Inspection Info Based on the results of the facility's three most recent standard inspections and any complaint investigations. CMS reviews the number, scope, and severity of deficiencies, with more recent findings weighted more heavily.
▲ 43.0% Above CA avg. ▲ 43.0% Above CA avg.CA average: 2.8Click the badge to see the full State ranking.Click here to see the full State ranking.
Staffing Info Measures average nursing staff hours per resident per day, including Registered Nurses (RNs) and total nursing staff. Ratings are adjusted based on the level of care residents require and are compared to state and national benchmarks.
▼ 68.1% Below CA avg. ▼ 68.1% Below CA avg.CA average: 3.1Click the badge to see the full State ranking.Click here to see the full State ranking.
Quality Measures Info Based on clinical and physical health indicators reported to CMS, such as hospital readmissions, falls, pressure ulcers, and improvements in mobility. These measures reflect how well residents' health needs are being managed.
▲ 22.4% Above CA avg. ▲ 22.4% Above CA avg.CA average: 4.1Click the badge to see the full State ranking.Click here to see the full State ranking.

Staffing hours breakdown

Info Daily nursing hours per resident by staff type, reported to CMS. Higher is generally better — compare this facility to state and national averages to see where staffing stands.

Hours per resident per day — compared to California state averages

Total nursing care / resident Info This home is ranked 316th out of 354 homes in California for nurse hours. Total adjusted nursing hours per resident per day, combining RN, LPN, and aide time. CMS adjusts this for case-mix so facilities can be fairly compared.
3h 23m per day
Rank #316 / 354Nurse hours — State benchmarkedThis home is ranked 316th out of 354 homes in California. Shows adjusted nurse hours per resident per day benchmarked to the California average, with a ranking across 354 California facilities. More hours mean more direct care. The national average is about 3.5 hrs; below 3.0 is a red flag.Ranking totals vary by category as each rank only includes facilities that report data for that metric. Homes missing that data point aren't included in the ranking.Click the rank badge to see the full State ranking.Click here to see the full State ranking.
This facility California avg (4h 13m per day)
vs California avg
-20%

4 of 6 metrics below state avg

Standout metric Physical Therapist is +160% above state avg
Staff typeHours / Day / Residentvs state avg
Registered Nurse (RN) Info RNs hold the highest nursing license and can assess residents, interpret test results, and direct care plans. More RN hours per day often signals stronger clinical oversight and faster response to health changes. 34m per day ▼ 13% State avg: 39m per day · National avg: 41m per day
LPN / LVN Info Licensed Practical Nurses (LPNs) or Licensed Vocational Nurses (LVNs) deliver routine hands-on care — medication administration, wound dressing, and monitoring vital signs. They work under RN supervision and make up a large share of daily bedside care. 1h 5m per day ▼ 11% State avg: 1h 13m per day · National avg: 52m per day
Nurse Aide Info Certified Nurse Aides (CNAs) provide the most direct day-to-day assistance: bathing, dressing, feeding, and mobility. Nurse aide hours are typically the largest staffing category and directly affect residents' quality of life. 2h 30m per day ▼ 6% State avg: 2h 39m per day · National avg: 2h 21m per day
Weekend Total Nursing Info Combined nursing hours (RN + LPN + Nurse Aide) per resident per day on weekends. Staffing often drops on weekends — this figure reveals whether the facility maintains adequate coverage outside of weekday hours. 3h 49m per day ▼ 7% State avg: 4h 5m per day · National avg: 3h 26m per day
Physical Therapist Info Hours per resident per day provided by licensed Physical Therapists (PTs) or PT Assistants. PT services help residents recover mobility after injury or illness and are especially important for post-acute (short-stay) rehabilitation. 13m per day ▲ 160% State avg: 5m per day · National avg: 4m per day
Weekend RN Info Registered nurse hours specifically on weekends. Facilities sometimes reduce RN presence on Saturdays and Sundays — a low weekend RN figure compared to weekday hours can indicate reduced clinical oversight when most administrative staff are absent. 31m per day ▲ 3% State avg: 30m per day · National avg: 29m per day

Capacity and availability

This home usually has limited availability

Higher occupancy than the California average: 84.7%
Occupancy rate
89.7% Rank #329 / 1537Occupancy rate — State benchmarkedThis home is ranked 329th out of 1537 homes in California. Shows this facility's occupancy rate versus the California average, with its Statewide rank out of 1537. Higher occupancy signals strong local demand and financial stability.Ranking totals vary by category as each rank only includes facilities that report data for that metric. Homes missing that data point aren't included in the ranking.Click the rank badge to see the full State ranking.Click here to see the full State ranking.
Avg. Length of Stay
46 days
Bed community size
53-bed community Rank #1127 / 1657Bed count — State benchmarkedThis home is ranked 1127th out of 1657 homes in California. Shows this facility's certified or reported bed count compared to other California facilities. Larger communities may offer more amenities, programs, and on-site services for residents and families.Ranking totals vary by category as each rank only includes facilities that report data for that metric. Homes missing that data point aren't included in the ranking.Click the rank badge to see the full State ranking.Click here to see the full State ranking.
A moderately sized community that may balance personal attention with shared amenities and social activities.
Walk Score
Walk Score: 49 / 100 Rank #1370 / 2092Walk Score — State benchmarkedThis home is ranked 1370th out of 2092 homes in California. Shows how walkable this facility's neighborhood is compared to the average Walk Score across California facilities. Higher scores benefit residents, families, and staff.Ranking totals vary by category as each rank only includes facilities that report data for that metric. Homes missing that data point aren't included in the ranking.Click the rank badge to see the full State ranking.Click here to see the full State ranking.
Somewhat walkable. A few nearby services may be reachable on foot, but most trips require transportation.

About this community

Therapy & Rehabilitation

1 service
Rehabilitation Services

Amenities & Lifestyle

Specific ProgramsState-of-the-Art, At Your Service, Things To Do
Touring HoursVisits are available everyday from 8:30am-8:30pm.

Contact Arroyo Vista Nursing Center

Staffing Data

Reporting period: October 1 – December 31, 2025 (Q4 2025). Source: CMS Payroll-Based Journal report.

Total staff 122
Employees 100
Contractors 22
Staff to resident ratio 2.30 : 1
27% more staff per resident than California average
California average ratio: 1.81 : 1 California average ratio: 1.81 : 1See full California ranking
Avg staff/day 39
Average shift 7.2 hours
6% worse than California average
California average: 7.7 hours California average shift: 7.7 hoursSee full California ranking
Total staff hours (quarter) 26,007

Nursing staff breakdown

Q4 2025 · Oct 1 – Dec 31 More info This data comes from the CMS Payroll-Based Journal report covering October 1 – December 31, 2025.
Registered Nurse

Manages medical care and health needs.

RN Staff Info 13 total: 11 full-time employees and 2 contractors. 13
Average shift length Info Average shift length. Calculated as total hours divided by days worked and average staff per day. 7.2 hours
Licensed Practical Nurse

Assists with medical care and medications.

LPN Staff Info 15 total: 13 full-time employees and 2 contractors. 15
Average shift length Info Average shift length. Calculated as total hours divided by days worked and average staff per day. 7.9 hours
Certified Nursing Assistant

Helps with daily care and mobility.

CNA Staff Info 52 total: 37 full-time employees and 15 contractors. 52
Average shift length Info Average shift length. Calculated as total hours divided by days worked and average staff per day. 7.1 hours

Contractor staffing

Q4 2025 · Oct 1 – Dec 31 More info This data comes from the CMS Payroll-Based Journal report covering October 1 – December 31, 2025.

Total hours from contractors

0.8%

218 contractor hours this quarter

Certified Nursing Assistant: 15 Medical Director: 3 Licensed Practical Nurse: 2 Registered Nurse: 2

Staff by category

Q4 2025 · Oct 1 – Dec 31 More info This data comes from the CMS Payroll-Based Journal report covering October 1 – December 31, 2025.
Certified Nursing Assistant37155211,08492100%7.1
Licensed Practical Nurse132153,96292100%7.9
Registered Nurse112132,72892100%7.2
Dental Services Staff6062,4777885%7.9
Respiratory Therapy Technician4041,0247480%6.9
Speech Language Pathologist4046596166%7
Physical Therapy Aide4046578491%5.2
Physical Therapy Assistant5056397379%6.4
RN Director of Nursing2025146065%8.6
Qualified Social Worker7074905964%6.4
Administrator1014806065%8
Occupational Therapy Aide1014646166%7.6
Nurse Practitioner2024554953%8.6
Dietitian1013324246%7.9
Medical Director033341617%2
Clinical Nurse Specialist101611%5.5
Other Dietary Services Staff101411%4.1
52 Certified Nursing Assistant
% of Days 100%
15 Licensed Practical Nurse
% of Days 100%
13 Registered Nurse
% of Days 100%
6 Dental Services Staff
% of Days 85%
4 Respiratory Therapy Technician
% of Days 80%
4 Speech Language Pathologist
% of Days 66%
4 Physical Therapy Aide
% of Days 91%
5 Physical Therapy Assistant
% of Days 79%
2 RN Director of Nursing
% of Days 65%
7 Qualified Social Worker
% of Days 64%
1 Administrator
% of Days 65%
1 Occupational Therapy Aide
% of Days 66%
2 Nurse Practitioner
% of Days 53%
1 Dietitian
% of Days 46%
3 Medical Director
% of Days 17%
1 Clinical Nurse Specialist
% of Days 1%
1 Other Dietary Services Staff
% of Days 1%

Penalties and fines

Federal penalties imposed by CMS for regulatory violations, including civil money penalties (fines) and denials of payment for new Medicare/Medicaid admissions.

Source: CMS Penalties Database

No penalties in the past 3 years

No civil money penalties or payment denials were reported in the last 3 years.

Quality of care over time

These measures show how residents usually do over time at this home, based on health outcomes and preventive care.

High-risk clinical events score Info A composite score based on pressure ulcers, falls with injury, weight loss, walking ability decline, and activities of daily living decline. 3.2
52% better than California average

California average: 6.6

Functional decline score Info A composite score based on activities of daily living decline, walking ability decline, and incontinence. 5.6
51% better than California average

California average: 11.3

Long-stay resident measures
Significantly above average California avg: 4.2 Info CMS star rating based on long-stay quality measure performance. 5 stars = significantly above average, 1 star = significantly below average.
Need for Help with Daily Activities Increased Info Percent of long-stay residents whose need for help with daily activities has increased 3.0%
73% better than California average

California average: 11.1%

Walking Ability Worsened Info Percent of long-stay residents whose ability to move independently worsened 8.1%
32% better than California average

California average: 12.0%

Low Risk Residents with Bowel/Bladder Incontinence Info Percent of low risk long-stay residents who lose control of their bowels or bladder 5.6%
51% better than California average

California average: 11.3%

Falls with Major Injury Info Percent of long-stay residents experiencing one or more falls with major injury 0.0%
100% better than California average

California average: 1.7%

High Risk Residents with Pressure Ulcers Info Percent of long-stay high risk residents with pressure ulcers 4.9%
In line with California average

California average: 5.0%

Urinary Tract Infection Info Percent of long-stay residents with a urinary tract infection 0.0%
100% better than California average

California average: 1.2%

Lost Too Much Weight Info Percent of long-stay residents who lose too much weight 0.0%
100% better than California average

California average: 4.2%

Depressive Symptoms Info Percent of long-stay residents who have depressive symptoms 14.5%
116% worse than California average

California average: 6.7%

Antipsychotic Use Info Percent of long-stay residents who received an antipsychotic medication 0.0%
100% better than California average

California average: 10.1%

Pneumococcal Vaccine Info Percent of long-stay residents assessed and appropriately given the pneumococcal vaccine 100.0%
In line with California average

California average: 98.5%

Influenza Vaccine Info Percent of long-stay residents assessed and appropriately given the seasonal influenza vaccine 100.0%
In line with California average

California average: 98.2%

Short-stay resident measures
Above average California avg: 3.5 Info CMS star rating based on short-stay quality measure performance. 5 stars = much above average, 1 star = much below average.
Pneumococcal Vaccine Info Percent of short-stay residents assessed and appropriately given the pneumococcal vaccine 100.0%
6% better than California average

California average: 94.0%

Antipsychotic medication increase Info Percent of short-stay residents who newly received an antipsychotic medication 1.0%
34% better than California average

California average: 1.5%

Influenza Vaccine Info Percent of short-stay residents assessed and appropriately given the seasonal influenza vaccine 98.8%
6% better than California average

California average: 93.2%

Re-hospitalized after SNF stay Info Percentage of short-stay residents who were re-hospitalized after their nursing home admission. 20.3%
13% better than California average

California average: 23.2%

Emergency department visits Info Percentage of short-stay residents who had an outpatient emergency department visit. 17.7%
58% worse than California average

California average: 11.2%

Falls with major injury Info Percentage of SNF residents who experience falls with major injury during their stay. 0.0%
100% better than California average

California average: 0.8%

Ability to care for self at discharge Info Percentage of residents at or above expected ability to care for themselves at discharge. 65.6%
22% better than California average

California average: 53.7%

Successful return to home or community Info Rate of successful return to home or community from a skilled nursing facility. 70.8%
40% better than California average

California average: 50.6%

Breakdown by payment type

Medicare

37% of new residents, usually for short-term rehab.

Typical stay 1 - 2 months

Private pay

62% of new residents, often for short stays.

Typical stay 30 days

Medicaid

1% of new residents, often for long-term daily care.

Typical stay 3 - 4 years

Facility Characteristics

Source: CMS Long-Term Care Facility Characteristics (Data as of Jan 2026)

Total residents 53
Medicare
53
100% of residents
Programs & Services
Residents Group

Residents meet regularly to discuss policies, care quality, and activities

Nurse Aide Training

State-approved Nurse Aide Training and Competency Evaluation Program on-site

Active Resident Council

Organized group of residents that meets regularly to discuss facility policies, quality of life, and activities.

Finances and operations

Based on CMS SNF Cost Report for fiscal year ending in 12/2023.

Voluntary non-profit community
Operated by a church.
Net patient revenue Info Net patient revenue — what the home actually collects for resident care, after contractual allowances, bad debt and discounts are subtracted from its gross charges (CMS cost report, Worksheet G-3). It covers resident care only; money the home earns from other sources is shown separately as "Other income."
$10.5M
Net patient income Info Net patient income: net patient revenue minus the home's total operating expenses. A positive figure means it earns more from resident care than it spends to deliver it; a negative figure means the opposite. It excludes non-operating "other income."
$2.2M
Voluntary non-profit community Operated by a church.
Net patient revenue Info Net patient revenue — what the home actually collects for resident care, after contractual allowances, bad debt and discounts are subtracted from its gross charges (CMS cost report, Worksheet G-3). It covers resident care only; money the home earns from other sources is shown separately as "Other income."
$10.5M Rank #278 / 355Revenue — State benchmarkedThis home is ranked 278th out of 355 homes in California. Shows this facility's annual revenue compared to the California average. Higher revenue generally means more resources for staffing and capital — read alongside Payroll %.Ranking totals vary by category as each rank only includes facilities that report data for that metric. Homes missing that data point aren't included in the ranking.Click the rank badge to see the full State ranking.Click here to see the full State ranking.
Net patient income Info Net patient income: net patient revenue minus the home's total operating expenses. A positive figure means it earns more from resident care than it spends to deliver it; a negative figure means the opposite. It excludes non-operating "other income."
$2.2M
Other income Info Money the home earns outside of resident care — such as investments, grants, rentals and other non-operating sources (CMS cost report, Worksheet G-3). It is tracked separately from net patient revenue: it is not part of that figure, and it is not included in net patient income.
$2.2K
Payroll costs Info Staff salaries plus wage-related costs — benefits such as payroll taxes, health insurance and retirement — from the home's own accounting records (CMS cost report, Worksheet A). Contract or agency labor is counted separately, under other operating costs. Rank #274 / 355Payroll — State benchmarkedThis home is ranked 274th out of 355 homes in California. Shows total annual staff payroll benchmarked to the California average. Higher payroll investment relative to peers often signals better staffing and less reliance on cheaper contract labor.Ranking totals vary by category as each rank only includes facilities that report data for that metric. Homes missing that data point aren't included in the ranking.Click the rank badge to see the full State ranking.Click here to see the full State ranking.
$5.5M 52.3% of net patient revenue Info Payroll as a share of revenue: staff salaries and wage-related benefits divided by net patient revenue. A higher figure means more of each revenue dollar goes to staff pay. Rank #136 / 355Payroll % — State benchmarkedThis home is ranked 136th out of 355 homes in California. Shows payroll as a percentage of revenue versus the California average. Well-run California facilities typically land around 56–67% — the top third Statewide. Below 25% may signal understaffing or heavy agency use — read with Staffing ratings.Ranking totals vary by category as each rank only includes facilities that report data for that metric. Homes missing that data point aren't included in the ranking.Click the rank badge to see the full State ranking.Click here to see the full State ranking.
Other operating costs Info Everything it costs to run the home apart from payroll — food, utilities, supplies, maintenance, contract labor and administration. Calculated as total operating expense minus payroll (staff salaries and wage-related benefits).
$2.8M
Total costs Info The home's total operating expense for the year — all the costs of running it, salaries included (CMS cost report, Worksheet G-3).
$8.3M

Who this home usually serves

TYPE OF STAY

Primarily short stays

Residents typically stay for brief periods, with frequent admissions and discharges throughout the year.

Most new residents arrive under private pay (62% of admissions), and a typical private pay stay runs around 30 days.

Admissions
381 total

Coverage residents most often arrive under.

Medicare 37%
Private pay 62%
Medicaid 1%
Discharges
377 total

Coverage residents most often leave under.

Medicare 38%
Private pay 61%
Medicaid 1%

Places of interest near Arroyo Vista Nursing Center

Address 4.1 miles from city center Info Estimated distance in miles from San Diego's city center to Arroyo Vista Nursing Center's address, calculated via Google Maps. — 3.03 miles to nearest hospital (US Navy Med Center-Orthopedics)

Calculate Travel Distance to Arroyo Vista Nursing Center

Add your location

Address

Compare Nursing Home around San Diego

The information below is reported by the California Department of Social Services and Department of Public Health.

5 facilities compared · CMS & CA Dept. of Health data

Vi at La Jolla Village
NH
AL
IL
MC
San Diego (University City)
783
Facility 783
CA AVG 103
Rank #5 / 1657
69.3%
Facility 69.3%
CA AVG 84.7%
Rank #974 / 1537
-18%
5.26
Facility 5.26
CA AVG 4.22
Rank #27 / 354
+43%+25%
$0
Facility $0
CA AVG $56.5k
Rank #1 / 362
84
Facility 84
CA AVG 81
Rank #731 / 1401
15
Facility 15
CA AVG 50.2
Rank #22 / 361
2.1
Facility 2.1
CA AVG 4.6
Rank #11 / 361
-543-
88
Facility 88
CA AVG 57
Rank #218 / 2092
Cc-La Jolla, Inc.
$10.6M
Facility $10.6M
CA AVG $17.0M
Rank #5 / 355
$9.6M
Facility $9.6M
CA AVG $7.0M
Rank #117 / 355
91.3%
Facility 91.3%
CA AVG 45.2%
Rank #354 / 355
555793
Ridgeview Health Center
NH
AL
MC
San Diego (Scripps Ranch)
68
Facility 68
CA AVG 103
Rank #1017 / 1657
85.3%
Facility 85.3%
CA AVG 84.7%
Rank #452 / 1537
+1%
5.54
Facility 5.54
CA AVG 4.22
Rank #21 / 354
-21%+31%
$33.2k
Facility $33.2k
CA AVG $56.5k
Rank #286 / 362
92
Facility 92
CA AVG 81
Rank #308 / 1401
17
Facility 17
CA AVG 50.2
Rank #26 / 361
2.8
Facility 2.8
CA AVG 4.6
Rank #50 / 361
-58-
11
Facility 11
CA AVG 57
Rank #1946 / 2092
Crestview Hc LLC
$8.3M
Facility $8.3M
CA AVG $17.0M
Rank #302 / 355
$4.7M
Facility $4.7M
CA AVG $7.0M
Rank #297 / 355
56.5%
Facility 56.5%
CA AVG 45.2%
Rank #74 / 355
555928
Bayshire Torrey Pines
NH
AL
IL
MC
San Diego (Carmel Valley)
125
Facility 125
CA AVG 103
Rank #526 / 1657
84.8%
Facility 84.8%
CA AVG 84.7%
Rank #463 / 1537
0%
3.32
Facility 3.32
CA AVG 4.22
Rank #327 / 354
-2%-21%
$110.1k
Facility $110.1k
CA AVG $56.5k
Rank #351 / 362
95
Facility 95
CA AVG 81
Rank #108 / 1401
52
Facility 52
CA AVG 50.2
Rank #235 / 361
5.8
Facility 5.8
CA AVG 4.6
Rank #289 / 361
1106A+
81
Facility 81
CA AVG 57
Rank #384 / 2092
Jeremy Danenhauer
$4.6M
Facility $4.6M
CA AVG $17.0M
Rank #334 / 355
$2.9M
Facility $2.9M
CA AVG $7.0M
Rank #336 / 355
64%
Facility 64%
CA AVG 45.2%
Rank #147 / 355
555746
Jacob Health Care Center
NH
San Diego (City Heights)
40
Facility 40
CA AVG 103
Rank #1209 / 1657
77.5%
Facility 77.5%
CA AVG 84.7%
Rank #744 / 1537
-8%
3.29
Facility 3.29
CA AVG 4.22
Rank #327 / 354
+11%-22%
$0
Facility $0
CA AVG $56.5k
Rank #1 / 362
87
Facility 87
CA AVG 81
Rank #568 / 1401
30
Facility 30
CA AVG 50.2
Rank #115 / 361
5.0
Facility 5.0
CA AVG 4.6
Rank #243 / 361
-31C+
49
Facility 49
CA AVG 57
Rank #1370 / 2092
Utah Lake Holdings, LLC
$14.2M
Facility $14.2M
CA AVG $17.0M
Rank #208 / 355
$9.4M
Facility $9.4M
CA AVG $7.0M
Rank #137 / 355
66.6%
Facility 66.6%
CA AVG 45.2%
Rank #51 / 355
55508
Arroyo Vista Nursing Center
NH
San Diego (City Heights)
53
Facility 53
CA AVG 103
Rank #1127 / 1657
89.7%
Facility 89.7%
CA AVG 84.7%
Rank #329 / 1537
+6%
3.39
Facility 3.39
CA AVG 4.22
Rank #316 / 354
+20%-20%
$0
Facility $0
CA AVG $56.5k
Rank #1 / 362
-
25
Facility 25
CA AVG 50.2
Rank #78 / 361
4.2
Facility 4.2
CA AVG 4.6
Rank #188 / 361
-48-
49
Facility 49
CA AVG 57
Rank #1370 / 2092
Ome Moore
$10.5M
Facility $10.5M
CA AVG $17.0M
Rank #278 / 355
$5.5M
Facility $5.5M
CA AVG $7.0M
Rank #274 / 355
52.3%
Facility 52.3%
CA AVG 45.2%
Rank #136 / 355
55505

Financial Assistance for
Nursing Home in California

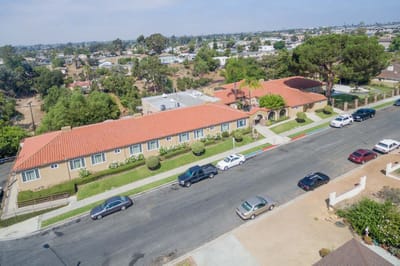
Arroyo Vista Nursing Center is located in San Diego, California.
Here are the financial assistance programs available to residents in California.

Get Financial aid guidance

Multipurpose Senior Services Program

MSSP (Medi-Cal Waiver)

Age 65+
General California resident, Medi-Cal eligible, nursing home risk.
Income Limits (2025) ~$2,829/month 300% FBR, individual
Asset Limits $2,000 (individual), $3,000 (couple).
CA

County-managed; waitlists possible.

Benefits
In-home support (4-6 hours/day) Respite care (14 days/year) Meals (~$6/meal) Transportation (8 trips/month) Care management

In-Home Supportive Services (IHSS)

California IHSS

Age 65+
General California resident, Medicaid-eligible or low-income.
Income Limits ~$1,732/month individual, Medi-Cal threshold
Asset Limits $2,000 individual
CA

Can hire family as caregivers.

Benefits
Personal care (up to 283 hours/month) Homemaker services Respite (varies)

Multipurpose Senior Services Program (MSSP)

CA MSSP

Age 65+
General California resident, Medi-Cal-eligible, nursing home-eligible but community-capable.
Income Limits ~$2,829/month 300% FBR, individual
Asset Limits $2,000 individual
CA

Available in 38 counties; waitlists common.

Benefits
Case management Respite care (up to 10 days/year) Minor home mods (avg. $500) Adult day care (~$50/day)

Property Tax Postponement Program (PTP)

CA PTP

Age 62+
General California resident, own and live in home, 40% equity.
Income Limits (2025) ~$51,500/year household, adjusted annually
Asset Limits Equity-based; no strict asset cap.
CA

Deferred taxes accrue interest (5% as of 2024); repaid upon sale/death.

Benefits
Property tax deferral (avg. $1,000-$3,000/year, varies by county)

Assisted Living Waiver (ALW)

CA ALW

Age 65+ or disabled
General California resident, Medi-Cal-eligible, nursing home-eligible.
Income Limits ~$2,829/month 300% FBR, individual
Asset Limits $2,000 individual
CA

Available in 15 counties (e.g., LA, Sacramento); waitlists common.

Benefits
Personal care in ALFs (5-7 hours/day) Medication management Social services

California CARES Program

CA CARES

Age
General Caregivers of California residents 60+ needing help with 3+ daily activities; no caregiver age limit.
Income Limits No strict limit; cost-sharing above ~$2,500/month threshold.
Asset Limits Not applicable; need-based.
CA

High demand in urban areas; complements IHSS respite.

Benefits
Respite care (up to 10 days/year) Counseling (4-6 sessions/year) Training (2-3 workshops/year) Supplies (~$200/year)

Frequently Asked Questions about Arroyo Vista Nursing Center

What neighborhood is Arroyo Vista Nursing Center in?

Arroyo Vista Nursing Center is in the City Heights neighborhood.

Is Arroyo Vista Nursing Center in a walkable area?

Arroyo Vista Nursing Center has a walk score of 49. Somewhat walkable. A few nearby services may be reachable on foot, but most trips require transportation.

What is the occupancy rate at Arroyo Vista Nursing Center?

Arroyo Vista Nursing Center's occupancy is 89.7%.

Are there photos of Arroyo Vista Nursing Center?

Yes — there are 27 photos of Arroyo Vista Nursing Center in the photo gallery on this page.
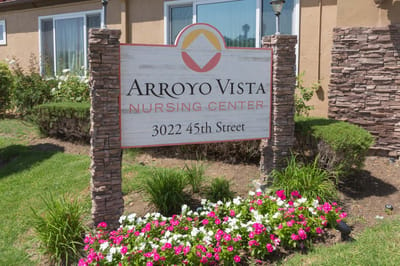
What is the phone number of Arroyo Vista Nursing Center?

(619) 283-5855 will put you in contact with the team at Arroyo Vista Nursing Center.

Is Arroyo Vista Nursing Center Medicare or Medicaid certified?

Yes — Arroyo Vista Nursing Center is a CMS-certified provider of Medicare and Medicaid.

Guides for Better Senior Living

Care Cost Calculator: See Prices in Your Area

Nursing Home Data Explorer

Don’t Wait Too Long: 7 Red Flag Signs Your Parent Needs Assisted Living Now

The True Cost of Assisted Living in 2025 – And How Families Are Paying For It

Understanding Senior Living Costs: Pricing Models, Discounts & Financial Assistance