Woodside Healthcare Center
Nursing Home, Nursing Care & Respite Care · Sacramento, CA
CMS overall rating Info CMS (the Centers for Medicare & Medicaid Services) is the federal agency that rates nursing home quality. Its Overall Rating runs from 1 to 5 stars, combining health inspections, staffing, and quality measures, with inspections weighted most heavily.

Woodside Healthcare Center

Nursing Home, Nursing Care & Respite Care · Sacramento, CA
CMS overall rating Info CMS (the Centers for Medicare & Medicaid Services) is the federal agency that rates nursing home quality. Its Overall Rating runs from 1 to 5 stars, combining health inspections, staffing, and quality measures, with inspections weighted most heavily.
Calculator: See prices in your area
Woodside Healthcare Center accepts Medicaid, Medicare, and private pay.

Overview of Woodside Healthcare Center

Woodside Healthcare Center is committed to helping residents achieve their highest practical level of functioning by integrating their lifestyle preferences with comprehensive medical treatment. Located in Sacramento, California, This assisted living community’s care team collaborates with senior residents and their families, guided by the resident’s physician, to develop personalized care plans tailored to their individual needs.
Woodside Healthcare Center offers a wide range of services, including 24-hour nursing care, intravenous therapy, wound management programs, restorative nursing, pain management, hospice and respite care. For those transitioning back home after hospitalization, the center also provides post-hospitalization medical assistance. The facility’s caring activity staff curates a diverse calendar of social, cultural, and recreational activities to enhance the residents’ well-being. Additionally, a full-service beauty/barber shop is available, and the center’s full-time Dietitian provides nutritional counseling to promote overall health and wellness.

Quality ratings

Measured by Centers for Medicare & Medicaid Services (CMS)

Overall rating Info The Overall CMS Rating combines results from health inspections, staffing levels and quality measures. Health inspections carry the most weight. Staffing and quality scores can increase or decrease the final rating based on performance compared to state and national standards.
▲ 27.0% Above CA avg. ▲ 27.0% Above CA avg.CA average: 3.1Click the badge to see the full State ranking.Click here to see the full State ranking.
Health Inspection Info Based on the results of the facility's three most recent standard inspections and any complaint investigations. CMS reviews the number, scope, and severity of deficiencies, with more recent findings weighted more heavily.
▲ 43.0% Above CA avg. ▲ 43.0% Above CA avg.CA average: 2.8Click the badge to see the full State ranking.Click here to see the full State ranking.
Staffing Info Measures average nursing staff hours per resident per day, including Registered Nurses (RNs) and total nursing staff. Ratings are adjusted based on the level of care residents require and are compared to state and national benchmarks.
▲ 27.5% Above CA avg. ▲ 27.5% Above CA avg.CA average: 3.1Click the badge to see the full State ranking.Click here to see the full State ranking.
Quality Measures Info Based on clinical and physical health indicators reported to CMS, such as hospital readmissions, falls, pressure ulcers, and improvements in mobility. These measures reflect how well residents' health needs are being managed.
▼ 2.1% Below CA avg. ▼ 2.1% Below CA avg.CA average: 4.1Click the badge to see the full State ranking.Click here to see the full State ranking.

Staffing hours breakdown

Info Daily nursing hours per resident by staff type, reported to CMS. Higher is generally better — compare this facility to state and national averages to see where staffing stands.

Hours per resident per day — compared to California state averages

Total nursing care / resident Info This home is ranked 92nd out of 354 homes in California for nurse hours. Total adjusted nursing hours per resident per day, combining RN, LPN, and aide time. CMS adjusts this for case-mix so facilities can be fairly compared.
4h 28m per day
Rank #92 / 354Nurse hours — State benchmarkedThis home is ranked 92nd out of 354 homes in California. Shows adjusted nurse hours per resident per day benchmarked to the California average, with a ranking across 354 California facilities. More hours mean more direct care. The national average is about 3.5 hrs; below 3.0 is a red flag.Rankings are based only on facilities in California that report data for that category. Facilities without available data are excluded from the ranking.Click the rank badge to see the full State ranking.Click here to see the full State ranking.
This facility California avg (4h 13m per day)
vs California avg
+6%

3 of 6 metrics below state avg

Staff type Hours / Day / Resident vs state avg
Registered Nurse (RN) Info RNs hold the highest nursing license and can assess residents, interpret test results, and direct care plans. More RN hours per day often signals stronger clinical oversight and faster response to health changes. 38m per day ■ Avg State avg: 39m per day · National avg: 41m per day
LPN / LVN Info Licensed Practical Nurses (LPNs) or Licensed Vocational Nurses (LVNs) deliver routine hands-on care — medication administration, wound dressing, and monitoring vital signs. They work under RN supervision and make up a large share of daily bedside care. 1h 10m per day ▼ 4% State avg: 1h 13m per day · National avg: 52m per day
Nurse Aide Info Certified Nurse Aides (CNAs) provide the most direct day-to-day assistance: bathing, dressing, feeding, and mobility. Nurse aide hours are typically the largest staffing category and directly affect residents' quality of life. 2h 38m per day ■ Avg State avg: 2h 39m per day · National avg: 2h 21m per day
Weekend Total Nursing Info Combined nursing hours (RN + LPN + Nurse Aide) per resident per day on weekends. Staffing often drops on weekends — this figure reveals whether the facility maintains adequate coverage outside of weekday hours. 4h 8m per day ■ Avg State avg: 4h 5m per day · National avg: 3h 26m per day
Physical Therapist Info Hours per resident per day provided by licensed Physical Therapists (PTs) or PT Assistants. PT services help residents recover mobility after injury or illness and are especially important for post-acute (short-stay) rehabilitation. 3m per day ▼ 46% State avg: 5m per day · National avg: 4m per day
Weekend RN Info Registered nurse hours specifically on weekends. Facilities sometimes reduce RN presence on Saturdays and Sundays — a low weekend RN figure compared to weekday hours can indicate reduced clinical oversight when most administrative staff are absent. 28m per day ▼ 8% State avg: 30m per day · National avg: 29m per day

Capacity and availability

This home usually has limited availability

Higher occupancy than the California average: 84.7%
Occupancy rate
94.8% Rank #202 / 1537Occupancy rate — State benchmarkedThis home is ranked 202nd out of 1537 homes in California. Shows this facility's occupancy rate versus the California average, with its Statewide rank out of 1537. Higher occupancy signals strong local demand and financial stability.Rankings are based only on facilities in California that report data for that category. Facilities without available data are excluded from the ranking.Click the rank badge to see the full State ranking.Click here to see the full State ranking.
Avg. Length of Stay
50 days
Bed community size
58-bed community Rank #1102 / 1657Bed count — State benchmarkedThis home is ranked 1102nd out of 1657 homes in California. Shows this facility's certified or reported bed count compared to other California facilities. Larger communities may offer more amenities, programs, and on-site services for residents and families.Rankings are based only on facilities in California that report data for that category. Facilities without available data are excluded from the ranking.Click the rank badge to see the full State ranking.Click here to see the full State ranking.
A moderately sized community that may balance personal attention with shared amenities and social activities.
Years in operation
23 years in operation Rank #289 / 1487Years in operation — State benchmarkedThis home is ranked 289th out of 1487 homes in California. Shows how long this facility has been in operation compared to other California facilities. Longer operating histories may benefit residents, families, and staff.Rankings are based only on facilities in California that report data for that category. Facilities without available data are excluded from the ranking.Click the rank badge to see the full State ranking.Click here to see the full State ranking.
A longer operating history, which may indicate experience navigating regulations and delivering ongoing care.
Walk Score
Walk Score: 78 / 100 Rank #486 / 2092Walk Score — State benchmarkedThis home is ranked 486th out of 2092 homes in California. Shows how walkable this facility's neighborhood is compared to the average Walk Score across California facilities. Higher scores benefit residents, families, and staff.Rankings are based only on facilities in California that report data for that category. Facilities without available data are excluded from the ranking.Click the rank badge to see the full State ranking.Click here to see the full State ranking.
Very walkable. Most errands can be accomplished on foot, and many essentials are within a short walk.

About this community

License Details

CMS Certification Number555798
AccreditationsMedicare and Medi-Cal provider
Inspection Rating5-star

Staffing

Key information about the people who lead and staff this community.

Leadership

ContactMr. John Lund, Managing Officer

Payment & Insurance

2 services
Accept Medicaid
Accept Medicare

Therapy & Rehabilitation

2 services
Rehabilitation Services
Respite Care

Amenities & Lifestyle

Grooming Services
Life Enrichment And Entertainment
Spiritual Support
Patient And Family Support
Direct Tv

Contact Woodside Healthcare Center

Inspection History

In California, the Department of Social Services (for assisted living facilities) and the Department of Public Health (for nursing homes) conduct inspections to ensure resident safety and regulatory compliance.

Health Inspection History

Inspections since 2021
Total health inspections 3

California average 12.5


Last Health inspection on Nov 2024
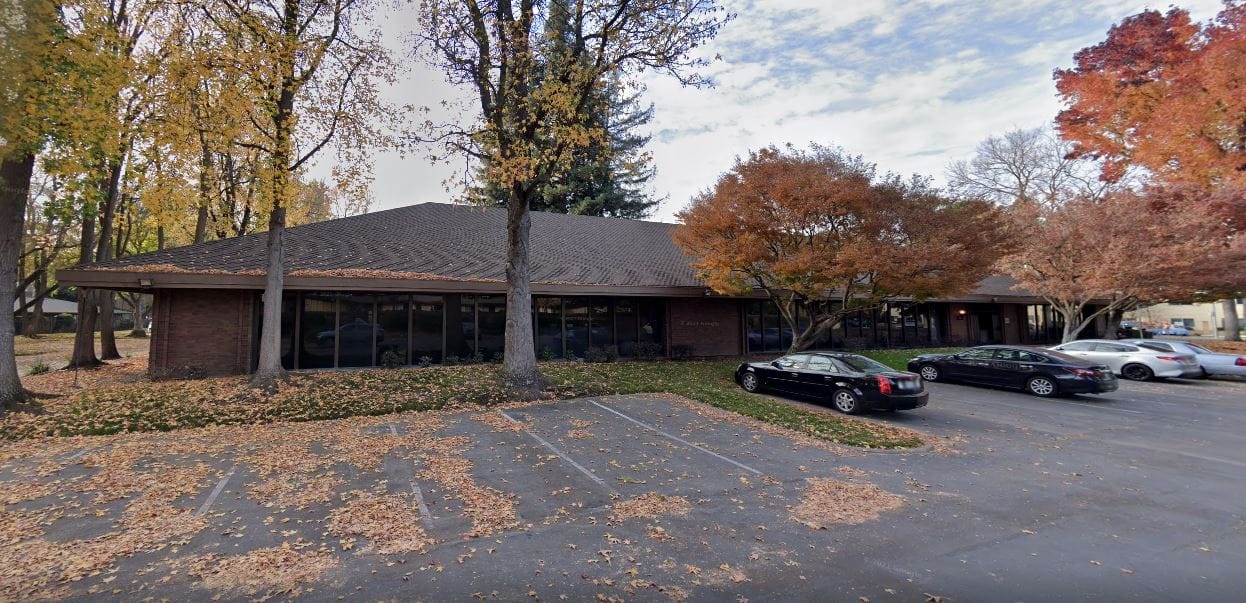
Total health citations
21 Rank #47 / 361Health citations — State benchmarkedThis home is ranked 47th out of 361 homes in California. Shows this facility's total health deficiency citations benchmarked to the California State average, with a ranking across all 361 CA facilities. Lower citation counts earn a better rank.Rankings are based only on facilities in California that report data for that category. Facilities without available data are excluded from the ranking.Click the rank badge to see the full State ranking.Click here to see the full State ranking.

California average 50.2

Citations per inspection
7 Rank #328 / 361Citations per inspection — State benchmarkedThis home is ranked 328th out of 361 homes in California. Shows average deficiency citations per CMS inspection for this facility versus the California mean across 361 facilities with citation data. Lower is better.Rankings are based only on facilities in California that report data for that category. Facilities without available data are excluded from the ranking.Click the rank badge to see the full State ranking.Click here to see the full State ranking.

California average 4.65


Health citations are formal notices following inspections when they fail to comply with safety and care standards.

All 21 citations resulted from standard inspections.

Breakdown of citation severity (last 5 years)
Critical health citations
0
100% better than California average

California average: 0.4


Serious health citations
0
100% better than California average

California average: 1

0 critical citations California average: 0.4

0 serious citations California average: 1

21 moderate citations California average: 47.2

0 minor citations California average: 1.5
Citations history (last 5 years)
Environmental moderate citation Nov 22, 2024
Corrected

Infection Control moderate citation Nov 22, 2024
Corrected

Nutrition moderate citation Nov 22, 2024
Corrected

Pharmacy moderate citation Nov 22, 2024
Corrected

Staffing Data

Reporting period: October 1 – December 31, 2025 (Q4 2025). Source: CMS Payroll-Based Journal report.

Total staff 134
Employees 93
Contractors 41
Staff to resident ratio 2.53 : 1
40% more staff per resident than California average
California average ratio: 1.81 : 1 California average ratio: 1.81 : 1See full California ranking
Avg staff/day 41
Average shift 7.2 hours
6% worse than California average
California average: 7.7 hours California average shift: 7.7 hoursSee full California ranking
Total staff hours (quarter) 27,060

Nursing staff breakdown

Q4 2025 · Oct 1 – Dec 31 More info This data comes from the CMS Payroll-Based Journal report covering October 1 – December 31, 2025.
Registered Nurse

Manages medical care and health needs.

RN Staff Info All 10 RN Staff are full-time employees. No contractors work on this role. 10
Average shift length Info Average shift length. Calculated as total hours divided by days worked and average staff per day. 7.6 hours
Licensed Practical Nurse

Assists with medical care and medications.

LPN Staff Info 42 total: 14 full-time employees and 28 contractors. 42
Average shift length Info Average shift length. Calculated as total hours divided by days worked and average staff per day. 7.9 hours
Certified Nursing Assistant

Helps with daily care and mobility.

CNA Staff Info 61 total: 48 full-time employees and 13 contractors. 61
Average shift length Info Average shift length. Calculated as total hours divided by days worked and average staff per day. 7.3 hours

Contractor staffing

Q4 2025 · Oct 1 – Dec 31 More info This data comes from the CMS Payroll-Based Journal report covering October 1 – December 31, 2025.

Total hours from contractors

1.6%

432 contractor hours this quarter

Licensed Practical Nurse: 28 Certified Nursing Assistant: 13

Staff by category

Q4 2025 · Oct 1 – Dec 31 More info This data comes from the CMS Payroll-Based Journal report covering October 1 – December 31, 2025.
Certified Nursing Assistant 48 13 61 13,535 92 100% 7.3
Licensed Practical Nurse 14 28 42 5,524 92 100% 7.9
Registered Nurse 10 0 10 2,276 92 100% 7.6
Speech Language Pathologist 3 0 3 1,001 70 76% 8.1
Physical Therapy Aide 2 0 2 676 77 84% 8
Nurse Practitioner 1 0 1 512 64 70% 8
RN Director of Nursing 1 0 1 512 64 70% 8
Dietitian 1 0 1 496 62 67% 8
Clinical Nurse Specialist 1 0 1 488 61 66% 8
Other Social Services Staff 1 0 1 454 62 67% 7.3
Physical Therapy Assistant 2 0 2 386 81 88% 3.6
Mental Health Service Worker 1 0 1 300 49 53% 6.1
Respiratory Therapy Technician 2 0 2 233 71 77% 2.7
Other Dietary Services Staff 2 0 2 222 29 32% 4.9
Administrator 1 0 1 205 64 70% 3.2
Qualified Social Worker 2 0 2 174 45 49% 3.6
Occupational Therapy Aide 1 0 1 67 21 23% 3.2
61 Certified Nursing Assistant
% of Days 100%
42 Licensed Practical Nurse
% of Days 100%
10 Registered Nurse
% of Days 100%
3 Speech Language Pathologist
% of Days 76%
2 Physical Therapy Aide
% of Days 84%
1 Nurse Practitioner
% of Days 70%
1 RN Director of Nursing
% of Days 70%
1 Dietitian
% of Days 67%
1 Clinical Nurse Specialist
% of Days 66%
1 Other Social Services Staff
% of Days 67%
2 Physical Therapy Assistant
% of Days 88%
1 Mental Health Service Worker
% of Days 53%
2 Respiratory Therapy Technician
% of Days 77%
2 Other Dietary Services Staff
% of Days 32%
1 Administrator
% of Days 70%
2 Qualified Social Worker
% of Days 49%
1 Occupational Therapy Aide
% of Days 23%

Penalties and fines

Federal penalties imposed by CMS for regulatory violations, including civil money penalties (fines) and denials of payment for new Medicare/Medicaid admissions.

Source: CMS Penalties Database

No penalties in the past 3 years

No civil money penalties or payment denials were reported in the last 3 years.

Quality of care over time

These measures show how residents usually do over time at this home, based on health outcomes and preventive care.

High-risk clinical events score Info A composite score based on pressure ulcers, falls with injury, weight loss, walking ability decline, and activities of daily living decline. 7.1
7% worse than California average

California average: 6.6

Functional decline score Info A composite score based on activities of daily living decline, walking ability decline, and incontinence. 13.7
21% worse than California average

California average: 11.3

Long-stay resident measures
Significantly above average California avg: 4.2 Info CMS star rating based on long-stay quality measure performance. 5 stars = significantly above average, 1 star = significantly below average.
Need for Help with Daily Activities Increased Info Percent of long-stay residents whose need for help with daily activities has increased 11.9%
7% worse than California average

California average: 11.1%

Walking Ability Worsened Info Percent of long-stay residents whose ability to move independently worsened 14.2%
19% worse than California average

California average: 12.0%

Low Risk Residents with Bowel/Bladder Incontinence Info Percent of low risk long-stay residents who lose control of their bowels or bladder 15.1%
34% worse than California average

California average: 11.3%

Falls with Major Injury Info Percent of long-stay residents experiencing one or more falls with major injury 1.6%
In line with California average

California average: 1.7%

High Risk Residents with Pressure Ulcers Info Percent of long-stay high risk residents with pressure ulcers 3.2%
35% better than California average

California average: 5.0%

Urinary Tract Infection Info Percent of long-stay residents with a urinary tract infection 0.0%
100% better than California average

California average: 1.2%

Lost Too Much Weight Info Percent of long-stay residents who lose too much weight 4.6%
8% worse than California average

California average: 4.2%

Depressive Symptoms Info Percent of long-stay residents who have depressive symptoms 4.2%
37% better than California average

California average: 6.7%

Antipsychotic Use Info Percent of long-stay residents who received an antipsychotic medication 0.0%
100% better than California average

California average: 10.1%

Pneumococcal Vaccine Info Percent of long-stay residents assessed and appropriately given the pneumococcal vaccine 100.0%
In line with California average

California average: 98.5%

Influenza Vaccine Info Percent of long-stay residents assessed and appropriately given the seasonal influenza vaccine 100.0%
In line with California average

California average: 98.2%

Short-stay resident measures
Below average California avg: 3.5 Info CMS star rating based on short-stay quality measure performance. 5 stars = much above average, 1 star = much below average.
Pneumococcal Vaccine Info Percent of short-stay residents assessed and appropriately given the pneumococcal vaccine 100.0%
6% better than California average

California average: 94.0%

Antipsychotic medication increase Info Percent of short-stay residents who newly received an antipsychotic medication 1.4%
6% better than California average

California average: 1.5%

Influenza Vaccine Info Percent of short-stay residents assessed and appropriately given the seasonal influenza vaccine 100.0%
7% better than California average

California average: 93.2%

Re-hospitalized after SNF stay Info Percentage of short-stay residents who were re-hospitalized after their nursing home admission. 24.1%
In line with California average

California average: 23.2%

Emergency department visits Info Percentage of short-stay residents who had an outpatient emergency department visit. 13.9%
24% worse than California average

California average: 11.2%

Falls with major injury Info Percentage of SNF residents who experience falls with major injury during their stay. 0.0%
100% better than California average

California average: 0.8%

Ability to care for self at discharge Info Percentage of residents at or above expected ability to care for themselves at discharge. 49.5%
8% worse than California average

California average: 53.7%

Successful return to home or community Info Rate of successful return to home or community from a skilled nursing facility. 33.0%
35% worse than California average

California average: 50.6%

Breakdown by payment type

Medicare

33% of new residents, usually for short-term rehab.

Typical stay 1 - 2 months

Private pay

66% of new residents, often for short stays.

Typical stay 25 days

Medicaid

1% of new residents, often for long-term daily care.

Typical stay 6 years

Facility Characteristics

Source: CMS Long-Term Care Facility Characteristics (Data as of Jan 2026)

Total residents 53
Medicare
14
26.4% of residents
Medicaid
39
73.6% of residents
Programs & Services
Residents Group

Residents meet regularly to discuss policies, care quality, and activities

Active Resident Council

Organized group of residents that meets regularly to discuss facility policies, quality of life, and activities.

Finances and operations

Based on CMS SNF Cost Report for fiscal year ending in 12/2023.

For-profit
Corporation
Net patient revenue Info Net patient revenue — what the home actually collects for resident care, after contractual allowances, bad debt and discounts are subtracted from its gross charges (CMS cost report, Worksheet G-3). It covers resident care only; money the home earns from other sources is shown separately as "Other income."
$10.3M
Net patient income Info Net patient income: net patient revenue minus the home's total operating expenses. A positive figure means it earns more from resident care than it spends to deliver it; a negative figure means the opposite. It excludes non-operating "other income."
$937.5K
For-profit Corporation
Net patient revenue Info Net patient revenue — what the home actually collects for resident care, after contractual allowances, bad debt and discounts are subtracted from its gross charges (CMS cost report, Worksheet G-3). It covers resident care only; money the home earns from other sources is shown separately as "Other income."
$10.3M Rank #310 / 355Revenue — State benchmarkedThis home is ranked 310th out of 355 homes in California. Shows this facility's annual revenue compared to the California average. Higher revenue generally means more resources for staffing and capital — read alongside Payroll %.Rankings are based only on facilities in California that report data for that category. Facilities without available data are excluded from the ranking.Click the rank badge to see the full State ranking.Click here to see the full State ranking.
Net patient income Info Net patient income: net patient revenue minus the home's total operating expenses. A positive figure means it earns more from resident care than it spends to deliver it; a negative figure means the opposite. It excludes non-operating "other income."
$937.5K
Other income Info Money the home earns outside of resident care — such as investments, grants, rentals and other non-operating sources (CMS cost report, Worksheet G-3). It is tracked separately from net patient revenue: it is not part of that figure, and it is not included in net patient income.
$1.4K
Payroll costs Info Staff salaries plus wage-related costs — benefits such as payroll taxes, health insurance and retirement — from the home's own accounting records (CMS cost report, Worksheet A). Contract or agency labor is counted separately, under other operating costs. Rank #271 / 355Payroll — State benchmarkedThis home is ranked 271st out of 355 homes in California. Shows total annual staff payroll benchmarked to the California average. Higher payroll investment relative to peers often signals better staffing and less reliance on cheaper contract labor.Rankings are based only on facilities in California that report data for that category. Facilities without available data are excluded from the ranking.Click the rank badge to see the full State ranking.Click here to see the full State ranking.
$5.2M 51% of net patient revenue Info Payroll as a share of revenue: staff salaries and wage-related benefits divided by net patient revenue. A higher figure means more of each revenue dollar goes to staff pay. Rank #23 / 355Payroll % — State benchmarkedThis home is ranked 23rd out of 355 homes in California. Shows payroll as a percentage of revenue versus the California average. Well-run California facilities typically land around 55–67% — the top third Statewide. Below 25% may signal understaffing or heavy agency use — read with Staffing ratings.Rankings are based only on facilities in California that report data for that category. Facilities without available data are excluded from the ranking.Click the rank badge to see the full State ranking.Click here to see the full State ranking.
Other operating costs Info Everything it costs to run the home apart from payroll — food, utilities, supplies, maintenance, contract labor and administration. Calculated as total operating expense minus payroll (staff salaries and wage-related benefits).
$4.1M
Total costs Info The home's total operating expense for the year — all the costs of running it, salaries included (CMS cost report, Worksheet G-3).
$9.3M

Who this home usually serves

TYPE OF STAY

Primarily short stays

Residents typically stay for brief periods, with frequent admissions and discharges throughout the year.

Most new residents arrive under private pay (66% of admissions), and a typical private pay stay runs around 25 days.

Admissions
398 total

Coverage residents most often arrive under.

Medicare 33%
Private pay 66%
Medicaid 1%
Discharges
388 total

Coverage residents most often leave under.

Medicare 34%
Private pay 65%
Medicaid 1%

Managed by Alicia Portela

Administrator

Places of interest near Woodside Healthcare Center

Address 4.4 miles from city center Info Estimated distance in miles from Sacramento's city center to Woodside Healthcare Center's address, calculated via Google Maps.

Calculate Travel Distance to Woodside Healthcare Center

Add your location

Address

Compare Nursing Homes around Sacramento

The information below is reported by the California Department of Social Services and Department of Public Health.

5 facilities compared · CMS & CA Dept. of Health data

Advanced Health Care of Sacramento
NH
Sacramento (North Sacramento)
40
Facility 40
CA AVG 103
Rank #1209 / 1657
96.1%
Facility 96.1%
CA AVG 84.7%
Rank #176 / 1537
+13%
4.52
Facility 4.52
CA AVG 4.22
Rank #92 / 354
+54% +7%
$7.4k
Facility $7.4k
CA AVG $56.5k
Rank #220 / 362
-
26
Facility 26
CA AVG 50.2
Rank #86 / 361
2.4
Facility 2.4
CA AVG 4.6
Rank #25 / 361
1 39 -
55
Facility 55
CA AVG 57
Rank #1215 / 2092
Ashkan Javaheri
$13.8M
Facility $13.8M
CA AVG $17.0M
Rank #185 / 355
$5.9M
Facility $5.9M
CA AVG $7.0M
Rank #257 / 355
42.9%
Facility 42.9%
CA AVG 45.2%
Rank #303 / 355
555913
Woodside Healthcare Center
NH
NC
RC
Sacramento (Arden-Arcade)
58
Facility 58
CA AVG 103
Rank #1102 / 1657
94.8%
Facility 94.8%
CA AVG 84.7%
Rank #202 / 1537
+12%
4.46
Facility 4.46
CA AVG 4.22
Rank #92 / 354
-16% +6%
$0
Facility $0
CA AVG $56.5k
Rank #1 / 362
-
21
Facility 21
CA AVG 50.2
Rank #47 / 361
7.0
Facility 7.0
CA AVG 4.6
Rank #328 / 361
- 56 -
78
Facility 78
CA AVG 57
Rank #486 / 2092
-
$10.3M
Facility $10.3M
CA AVG $17.0M
Rank #310 / 355
$5.2M
Facility $5.2M
CA AVG $7.0M
Rank #271 / 355
51%
Facility 51%
CA AVG 45.2%
Rank #23 / 355
555798
Eskaton Care Center Greenhaven
NH
RC
Sacramento (Southwestern Sacramento)
148
Facility 148
CA AVG 103
Rank #382 / 1657
86.6%
Facility 86.6%
CA AVG 84.7%
Rank #421 / 1537
+2%
4.75
Facility 4.75
CA AVG 4.22
Rank #69 / 354
-6% +13%
$0
Facility $0
CA AVG $56.5k
Rank #1 / 362
-
61
Facility 61
CA AVG 50.2
Rank #273 / 361
2.2
Facility 2.2
CA AVG 4.6
Rank #14 / 361
- 140 -
70
Facility 70
CA AVG 57
Rank #740 / 2092
-
$5.2M
Facility $5.2M
CA AVG $17.0M
Rank #333 / 355
$3.6M
Facility $3.6M
CA AVG $7.0M
Rank #325 / 355
68.7%
Facility 68.7%
CA AVG 45.2%
Rank #58 / 355
555098
Asbury Park Nursing and Rehabilitation Center
NH
Sacramento
139
Facility 139
CA AVG 103
Rank #444 / 1657
96.4%
Facility 96.4%
CA AVG 84.7%
Rank #173 / 1537
+14%
4.29
Facility 4.29
CA AVG 4.22
Rank #122 / 354
-10% +2%
$0
Facility $0
CA AVG $56.5k
Rank #1 / 362
-
50
Facility 50
CA AVG 50.2
Rank #226 / 361
2.9
Facility 2.9
CA AVG 4.6
Rank #60 / 361
1 133 -
77
Facility 77
CA AVG 57
Rank #510 / 2092
Doug Hawkins
$23.8M
Facility $23.8M
CA AVG $17.0M
Rank #116 / 355
$12.0M
Facility $12.0M
CA AVG $7.0M
Rank #44 / 355
50.5%
Facility 50.5%
CA AVG 45.2%
Rank #64 / 355
555673
McKinley Park Care Center
NH
HC
MC
PC
RC
Sacramento (East Sacramento)
86
Facility 86
CA AVG 103
Rank #879 / 1657
93.0%
Facility 93.0%
CA AVG 84.7%
Rank #244 / 1537
+10%
3.51
Facility 3.51
CA AVG 4.22
Rank #296 / 354
-2% -17%
$0
Facility $0
CA AVG $56.5k
Rank #1 / 362
-
52
Facility 52
CA AVG 50.2
Rank #235 / 361
2.7
Facility 2.7
CA AVG 4.6
Rank #45 / 361
- 76 -
85
Facility 85
CA AVG 57
Rank #290 / 2092
-
$13.1M
Facility $13.1M
CA AVG $17.0M
Rank #177 / 355
$7.3M
Facility $7.3M
CA AVG $7.0M
Rank #184 / 355
55.7%
Facility 55.7%
CA AVG 45.2%
Rank #165 / 355
555122

Financial Assistance for
Nursing Home in California

Woodside Healthcare Center is located in Sacramento, California.
Here are the financial assistance programs available to residents in California.

Get Financial aid guidance

Multipurpose Senior Services Program

MSSP (Medi-Cal Waiver)

Age 65+
General California resident, Medi-Cal eligible, nursing home risk.
Income Limits (2025) ~$2,829/month 300% FBR, individual
Asset Limits $2,000 (individual), $3,000 (couple).
CA

County-managed; waitlists possible.

Benefits
In-home support (4-6 hours/day) Respite care (14 days/year) Meals (~$6/meal) Transportation (8 trips/month) Care management

In-Home Supportive Services (IHSS)

California IHSS

Age 65+
General California resident, Medicaid-eligible or low-income.
Income Limits ~$1,732/month individual, Medi-Cal threshold
Asset Limits $2,000 individual
CA

Can hire family as caregivers.

Benefits
Personal care (up to 283 hours/month) Homemaker services Respite (varies)

Multipurpose Senior Services Program (MSSP)

CA MSSP

Age 65+
General California resident, Medi-Cal-eligible, nursing home-eligible but community-capable.
Income Limits ~$2,829/month 300% FBR, individual
Asset Limits $2,000 individual
CA

Available in 38 counties; waitlists common.

Benefits
Case management Respite care (up to 10 days/year) Minor home mods (avg. $500) Adult day care (~$50/day)

Property Tax Postponement Program (PTP)

CA PTP

Age 62+
General California resident, own and live in home, 40% equity.
Income Limits (2025) ~$51,500/year household, adjusted annually
Asset Limits Equity-based; no strict asset cap.
CA

Deferred taxes accrue interest (5% as of 2024); repaid upon sale/death.

Benefits
Property tax deferral (avg. $1,000-$3,000/year, varies by county)

Assisted Living Waiver (ALW)

CA ALW

Age 65+ or disabled
General California resident, Medi-Cal-eligible, nursing home-eligible.
Income Limits ~$2,829/month 300% FBR, individual
Asset Limits $2,000 individual
CA

Available in 15 counties (e.g., LA, Sacramento); waitlists common.

Benefits
Personal care in ALFs (5-7 hours/day) Medication management Social services

California CARES Program

CA CARES

Age
General Caregivers of California residents 60+ needing help with 3+ daily activities; no caregiver age limit.
Income Limits No strict limit; cost-sharing above ~$2,500/month threshold.
Asset Limits Not applicable; need-based.
CA

High demand in urban areas; complements IHSS respite.

Benefits
Respite care (up to 10 days/year) Counseling (4-6 sessions/year) Training (2-3 workshops/year) Supplies (~$200/year)

Frequently Asked Questions about Woodside Healthcare Center

What neighborhood is Woodside Healthcare Center in?

Woodside Healthcare Center is in the Arden-Arcade neighborhood of Sacramento.

Is Woodside Healthcare Center in a walkable area?

Woodside Healthcare Center has a walk score of 78. Very walkable. Most errands can be accomplished on foot, and many essentials are within a short walk.

What is the occupancy rate at Woodside Healthcare Center?

Woodside Healthcare Center's occupancy is 90.6%.

Does Woodside Healthcare Center operate as a for-profit or non-profit?

Woodside Healthcare Center is registered as a for-profit in CA.

Are there photos of Woodside Healthcare Center?

Yes — there is 1 photo of Woodside Healthcare Center in the photo gallery on this page.

What is the address of Woodside Healthcare Center?

Woodside Healthcare Center is located at 2240 Northrop Ave, Sacramento, CA 95825.

What is the phone number of Woodside Healthcare Center?

(916) 927-9300 will put you in contact with the team at Woodside Healthcare Center.

Guides for Better Senior Living

Care Cost Calculator: See Prices in Your Area

Nursing Home Data Explorer

Don’t Wait Too Long: 7 Red Flag Signs Your Parent Needs Assisted Living Now

The True Cost of Assisted Living in 2025 – And How Families Are Paying For It

Understanding Senior Living Costs: Pricing Models, Discounts & Financial Assistance