Asst Lvg In Heritage Hall
Nursing Home & Assisted Living · Bloomington, MN
CMS overall rating Info CMS (the Centers for Medicare & Medicaid Services) is the federal agency that rates nursing home quality. Its Overall Rating runs from 1 to 5 stars, combining health inspections, staffing, and quality measures, with inspections weighted most heavily.

Asst Lvg In Heritage Hall

Nursing Home & Assisted Living · Bloomington, MN
CMS overall rating Info CMS (the Centers for Medicare & Medicaid Services) is the federal agency that rates nursing home quality. Its Overall Rating runs from 1 to 5 stars, combining health inspections, staffing, and quality measures, with inspections weighted most heavily.
Calculator: See prices in your area
Asst Lvg In Heritage Hall accepts Medicare, Medicaid, and private pay.

Overview of Asst Lvg in Heritage Hall

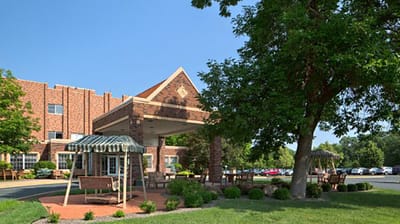
Operated under MN Masonic Elder Services, Asst Lvg in Heritage Hall is a 52-bed short-term rehabilitation and respite care facility in Bloomington, Minnesota. The facility on Masonic Home Drive serves residents in transition from hospital or home settings who need intensive rehabilitative care and monitoring. It welcomes Medicare, Medicaid, and private pay, which gives families flexibility in funding post-acute care or temporary respite stays.

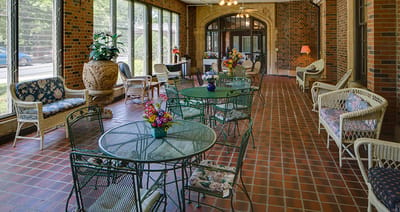
The facility runs at full census and is tailored to supply short-term care, with residents typically staying about 70 days on average. This focus on transitional care implies that the setting attracts patients working through recovery from surgery, illness, or injury with a goal toward eventual discharge home or to another setting. Total nursing care averages around 5 hours 9 minutes per resident day, distributed among registered nurses, nurse aides, and licensed practical nurses working across the community. Staffing includes registered nurses providing an average of 1 hour 34 minutes per resident daily, nurse aides at 2 hours 26 minutes, and licensed practical nurses at 40 minutes per day. This composition reflects a clinically focused environment where nursing assessment and hands-on personal care are core to daily operations. The home is situated in a moderately walkable area of Bloomington, where some nearby errands and services are reachable on foot. Occupants eat two meals daily, prepared on-site, with service designed around the community’s rehabilitative focus.

State inspections have found patterns highlighting care planning detail, individual resident assessment, and safety protocols. Asst Lvg in Heritage Hall has worked to address these themes and has shown improvement over time in its responses to regulatory findings.

Families touring the community can ask about the specific protocols for care planning and how the team ensures each resident’s individual needs are documented and monitored.

Quality ratings

Measured by Centers for Medicare & Medicaid Services (CMS)

Overall rating Info The Overall CMS Rating combines results from health inspections, staffing levels and quality measures. Health inspections carry the most weight. Staffing and quality scores can increase or decrease the final rating based on performance compared to state and national standards.
▲ 57.2% Above MN avg. ▲ 57.2% Above MN avg.MN average: 3.2Click the badge to see the full State ranking.Click here to see the full State ranking.
Health Inspection Info Based on the results of the facility's three most recent standard inspections and any complaint investigations. CMS reviews the number, scope, and severity of deficiencies, with more recent findings weighted more heavily.
▲ 42.3% Above MN avg. ▲ 42.3% Above MN avg.MN average: 2.8Click the badge to see the full State ranking.Click here to see the full State ranking.
Staffing Info Measures average nursing staff hours per resident per day, including Registered Nurses (RNs) and total nursing staff. Ratings are adjusted based on the level of care residents require and are compared to state and national benchmarks.
▲ 22.1% Above MN avg. ▲ 22.1% Above MN avg.MN average: 4.1Click the badge to see the full State ranking.Click here to see the full State ranking.
Quality Measures Info Based on clinical and physical health indicators reported to CMS, such as hospital readmissions, falls, pressure ulcers, and improvements in mobility. These measures reflect how well residents' health needs are being managed.
▲ 27.9% Above MN avg. ▲ 27.9% Above MN avg.MN average: 3.1Click the badge to see the full State ranking.Click here to see the full State ranking.

Staffing hours breakdown

Info Daily nursing hours per resident by staff type, reported to CMS. Higher is generally better — compare this facility to state and national averages to see where staffing stands.

Hours per resident per day — compared to Minnesota state averages

Total nursing care / resident Info This home is ranked 20th out of 89 homes in Minnesota for nurse hours. Total adjusted nursing hours per resident per day, combining RN, LPN, and aide time. CMS adjusts this for case-mix so facilities can be fairly compared.
5h 9m per day
Rank #20 / 89Nurse hours — State benchmarkedThis home is ranked 20th out of 89 homes in Minnesota. Shows adjusted nurse hours per resident per day benchmarked to the Minnesota average, with a ranking across 89 Minnesota facilities. More hours mean more direct care. The national average is about 3.5 hrs; below 3.0 is a red flag.Rankings are based only on facilities in Minnesota that report data for that category. Facilities without available data are excluded from the ranking.Click the rank badge to see the full State ranking.Click here to see the full State ranking.
This facility Minnesota avg (4h 46m per day)
vs Minnesota avg
+8%

1 of 6 metrics below state avg

Standout metric Physical Therapist is +289% above state avg
Staff typeHours / Day / Residentvs state avg
Registered Nurse (RN) Info RNs hold the highest nursing license and can assess residents, interpret test results, and direct care plans. More RN hours per day often signals stronger clinical oversight and faster response to health changes. 1h 34m per day ▲ 46% State avg: 1h 4m per day · National avg: 41m per day
LPN / LVN Info Licensed Practical Nurses (LPNs) or Licensed Vocational Nurses (LVNs) deliver routine hands-on care — medication administration, wound dressing, and monitoring vital signs. They work under RN supervision and make up a large share of daily bedside care. 40m per day ▲ 7% State avg: 37m per day · National avg: 52m per day
Nurse Aide Info Certified Nurse Aides (CNAs) provide the most direct day-to-day assistance: bathing, dressing, feeding, and mobility. Nurse aide hours are typically the largest staffing category and directly affect residents' quality of life. 2h 26m per day ▼ 3% State avg: 2h 30m per day · National avg: 2h 20m per day
Weekend Total Nursing Info Combined nursing hours (RN + LPN + Nurse Aide) per resident per day on weekends. Staffing often drops on weekends — this figure reveals whether the facility maintains adequate coverage outside of weekday hours. 4h 7m per day ▲ 12% State avg: 3h 40m per day · National avg: 3h 27m per day
Physical Therapist Info Hours per resident per day provided by licensed Physical Therapists (PTs) or PT Assistants. PT services help residents recover mobility after injury or illness and are especially important for post-acute (short-stay) rehabilitation. 18m per day ▲ 289% State avg: 5m per day · National avg: 4m per day
Weekend RN Info Registered nurse hours specifically on weekends. Facilities sometimes reduce RN presence on Saturdays and Sundays — a low weekend RN figure compared to weekday hours can indicate reduced clinical oversight when most administrative staff are absent. 1h 9m per day ▲ 67% State avg: 41m per day · National avg: 29m per day

Capacity and availability

Avg. Length of Stay
70 days
Bed community size
52-bed community Rank #250 / 532Bed count — State benchmarkedThis home is ranked 250th out of 532 homes in Minnesota. Shows this facility's certified or reported bed count compared to other Minnesota facilities. Larger communities may offer more amenities, programs, and on-site services for residents and families.Rankings are based only on facilities in Minnesota that report data for that category. Facilities without available data are excluded from the ranking.Click the rank badge to see the full State ranking.Click here to see the full State ranking.
A moderately sized community that may balance personal attention with shared amenities and social activities.
Walk Score
Walk Score: 50 / 100 Rank #250 / 632Walk Score — State benchmarkedThis home is ranked 250th out of 632 homes in Minnesota. Shows how walkable this facility's neighborhood is compared to the average Walk Score across Minnesota facilities. Higher scores benefit residents, families, and staff.Rankings are based only on facilities in Minnesota that report data for that category. Facilities without available data are excluded from the ranking.Click the rank badge to see the full State ranking.Click here to see the full State ranking.
Moderately walkable. Some errands can be accomplished on foot, with a mix of nearby amenities.

About this community

Occupancy

Occupancy rate
100%
Rank #1 / 331Occupancy rate — State benchmarkedThis home is ranked 1st out of 331 homes in Minnesota. Shows this facility's occupancy rate versus the Minnesota average, with its Statewide rank out of 331. Higher occupancy signals strong local demand and financial stability.Rankings are based only on facilities in Minnesota that report data for that category. Facilities without available data are excluded from the ranking.Click the rank badge to see the full State ranking.Click here to see the full State ranking.
Higher than the Minnesota average: 79.7%
Occupied beds
52 / 52
Average occupied beds in Minnesota homes 59 beds

License Details

Facility TypeAssisted Living
StatusApproved
CountyHennepin
CMS Certification Number245343

Safety & Compliance

Emergency SystemsYes
Safety FeaturesEmergency Response Pendant

Therapy & Rehabilitation

3 services
Rehabilitation Services
Respite Care
Short-Term Rehab

Additional Services

1 service
Transitional/Short Term Care

Additional Policies & Features

Pets Allowed
HousekeepingYes

Amenities & Lifestyle

Activities
Chapel
Coffee Shop
Fitness Center
Housekeeping
Library
On-Site Beauty & Barber
Pets Welcome
Transportation
Walking Path
Wireless Internet

Contact Asst Lvg In Heritage Hall

Inspection History

In Minnesota, the Department of Health, Health Regulation Division is the primary authority for conducting onsite inspections and reporting on the quality of care in residential facilities.

Since 2022 · 4 years of data 16 deficiencies

Inspection Scorecard Info This scorecard compares key inspection, deficiency, and complaint metrics at this facility against the Minnesota state average. Metrics rated ≥15% worse than average are highlighted in red; those ≥15% better are highlighted in green.

Since 2022 vs. Minnesota state average
Overall vs. MN average 2 Worse Metrics worse than Minnesota average:
• Total deficiencies (60% above)
• Deficiencies per year (60% above)
0 Better No metrics in this bucket.
Latest Inspection October 17, 2025

Deficiencies Info Deficiencies are formal regulatory issues recorded during state inspections.

This FacilityMN Averagevs. MN Avg
Total deficiencies Info Formal regulatory issues recorded by inspectors across all inspection types. 1610 This facility has 60% more total deficiencies than a typical Minnesota nursing home (16 vs. MN avg 10).↑ 60% worse
Deficiencies per year Info Average deficiencies per year since 2022. 42.5 This facility has 60% more deficiencies per year than a typical Minnesota nursing home (4 vs. MN avg 2.5).↑ 60% worse

Inspection Reports Summary Info An editor-reviewed summary of the themes and findings across this facility's recent inspection reports.

  • April 12, 2023 complaint investigation found a resident fell from a mechanical lift causing fatal head injury due to inadequate support and lack of individualized care plan interventions.
  • October 19, 2023 annual inspection cited 9 deficiencies including failure to report and investigate resident-to-resident sexual abuse and inadequate dementia care assessments.
  • December 18, 2024 annual inspection found 3 deficiencies related to fluid balance, bowel management, and wound assessment but no complaints or immediate jeopardy.

Health Inspection History

Inspections since 2022
Total health inspections 4

Minnesota average 6


Last Health inspection on Dec 2024

Total health citations
16 Rank #21 / 90Health citations — State benchmarkedThis home is ranked 21st out of 90 homes in Minnesota. Shows this facility's total health deficiency citations benchmarked to the Minnesota State average, with a ranking across all 90 MN facilities. Lower citation counts earn a better rank.Rankings are based only on facilities in Minnesota that report data for that category. Facilities without available data are excluded from the ranking.Click the rank badge to see the full State ranking.Click here to see the full State ranking.

Minnesota average 23.2

Citations per inspection
4 Rank #48 / 90Citations per inspection — State benchmarkedThis home is ranked 48th out of 90 homes in Minnesota. Shows average deficiency citations per CMS inspection for this facility versus the Minnesota mean across 90 facilities with citation data. Lower is better.Rankings are based only on facilities in Minnesota that report data for that category. Facilities without available data are excluded from the ranking.Click the rank badge to see the full State ranking.Click here to see the full State ranking.

Minnesota average 3.76


Health citations are formal notices following inspections when they fail to comply with safety and care standards.

15 of 16 citations resulted from standard inspections; and 1 of 16 resulted from complaint investigations.

Breakdown of citation severity (last 4 years)
Critical health citations
1
43% worse than Minnesota average

Minnesota average: 0.7


Serious health citations
0
100% better than Minnesota average

Minnesota average: 0.5

1 critical citation Minnesota average: 0.7

0 serious citations Minnesota average: 0.5

14 moderate citations Minnesota average: 21.2

1 minor citation Minnesota average: 0.8
Citations history (last 4 years)
Quality of Care moderate citation Dec 18, 2024
Corrected

Quality of Care moderate citation Dec 18, 2024
Corrected

Care Planning moderate citation Dec 18, 2024
Corrected

Abuse/Neglect moderate citation Oct 19, 2023
Corrected

Staffing Data

Reporting period: October 1 – December 31, 2025 (Q4 2025). Source: CMS Payroll-Based Journal report.

Total staff 287
Employees 285
Contractors 2
Staff to resident ratio 1.81 : 1
17% fewer staff per resident than Minnesota average
Minnesota average ratio: 2.19 : 1 Minnesota average ratio: 2.19 : 1See full Minnesota ranking
Avg staff/day 125
Average shift 8.2 hours
9% better than Minnesota average
Minnesota average: 7.5 hours Minnesota average shift: 7.5 hoursSee full Minnesota ranking
Total staff hours (quarter) 94,428

Nursing staff breakdown

Q4 2025 · Oct 1 – Dec 31 More info This data comes from the CMS Payroll-Based Journal report covering October 1 – December 31, 2025.
Registered Nurse

Manages medical care and health needs.

RN Staff Info All 54 RN Staff are full-time employees. No contractors work on this role. 54
Average shift length Info Average shift length. Calculated as total hours divided by days worked and average staff per day. 8.6 hours
Licensed Practical Nurse

Assists with medical care and medications.

LPN Staff Info All 24 LPN Staff are full-time employees. No contractors work on this role. 24
Average shift length Info Average shift length. Calculated as total hours divided by days worked and average staff per day. 8.4 hours
Certified Nursing Assistant

Helps with daily care and mobility.

CNA Staff Info All 93 CNA Staff are full-time employees. No contractors work on this role. 93
Average shift length Info Average shift length. Calculated as total hours divided by days worked and average staff per day. 8.7 hours

Contractor staffing

Q4 2025 · Oct 1 – Dec 31 More info This data comes from the CMS Payroll-Based Journal report covering October 1 – December 31, 2025.

Total hours from contractors

0.1%

52 contractor hours this quarter

Medical Director: 1 Occupational Therapy Assistant: 1

Staff by category

Q4 2025 · Oct 1 – Dec 31 More info This data comes from the CMS Payroll-Based Journal report covering October 1 – December 31, 2025.
Certified Nursing Assistant9309335,08692100%8.7
Registered Nurse5405419,09392100%8.6
Licensed Practical Nurse240249,10992100%8.4
Physical Therapy Assistant250256,35092100%7.6
Speech Language Pathologist170174,8839098%7.7
Respiratory Therapy Technician170174,47892100%7.7
Clinical Nurse Specialist100103,5467480%7.8
Dietitian110113,3129098%6.9
Occupational Therapy Aide8082,55592100%7.7
Mental Health Service Worker6062,3596470%8.1
Medication Aide/Technician5058716672%8.6
RN Director of Nursing4047477278%6.7
Administrator1014806065%8
Physical Therapist4044737885%4.6
Nurse Practitioner1014325459%8
Qualified Social Worker4043936166%6
Dental Services Staff1012124549%4.7
Occupational Therapy Assistant0114089%5
Medical Director0111267%2
93 Certified Nursing Assistant
% of Days 100%
54 Registered Nurse
% of Days 100%
24 Licensed Practical Nurse
% of Days 100%
25 Physical Therapy Assistant
% of Days 100%
17 Speech Language Pathologist
% of Days 98%
17 Respiratory Therapy Technician
% of Days 100%
10 Clinical Nurse Specialist
% of Days 80%
11 Dietitian
% of Days 98%
8 Occupational Therapy Aide
% of Days 100%
6 Mental Health Service Worker
% of Days 70%
5 Medication Aide/Technician
% of Days 72%
4 RN Director of Nursing
% of Days 78%
1 Administrator
% of Days 65%
4 Physical Therapist
% of Days 85%
1 Nurse Practitioner
% of Days 59%
4 Qualified Social Worker
% of Days 66%
1 Dental Services Staff
% of Days 49%
1 Occupational Therapy Assistant
% of Days 9%
1 Medical Director
% of Days 7%

Penalties and fines

Federal penalties imposed by CMS for regulatory violations, including civil money penalties (fines) and denials of payment for new Medicare/Medicaid admissions.

Source: CMS Penalties Database (Data as of Jan 2026)

Total fines amount $13K Rank #1 / 90Federal fines — State benchmarkedThis home is ranked 1st out of 90 homes in Minnesota. Shows this facility's cumulative CMS federal fine dollars versus the Minnesota average among facilities with fines, and where it ranks among 90 facilities in the pool. Lower total dollars mean a better rank.Rankings are based only on facilities in Minnesota that report data for that category. Facilities without available data are excluded from the ranking.Click the rank badge to see the full State ranking.Click here to see the full State ranking.
72% lower than Minnesota average

Minnesota average: $44K

Number of fines 1
50% fewer fines than Minnesota average

Minnesota average: 2.0

Payment Denials Info Serious action where Medicare and/or Medicaid temporarily stops payments for new residents until issues are fixed. 0
100% fewer payment denials than Minnesota average

Minnesota average: 0.4

Fines amount comparison
This facility $13K
Minnesota average $44K

No penalties in the past 3 years

No civil money penalties or payment denials were reported in the last 3 years.

Quality of care over time

These measures show how residents usually do over time at this home, based on health outcomes and preventive care.

High-risk clinical events score Info A composite score based on pressure ulcers, falls with injury, weight loss, walking ability decline, and activities of daily living decline. 8.9
20% better than Minnesota average

Minnesota average: 11.1

Functional decline score Info A composite score based on activities of daily living decline, walking ability decline, and incontinence. 20.3
10% better than Minnesota average

Minnesota average: 22.6

Long-stay resident measures
Need for Help with Daily Activities Increased Info Percent of long-stay residents whose need for help with daily activities has increased 12.6%
34% better than Minnesota average

Minnesota average: 18.9%

Walking Ability Worsened Info Percent of long-stay residents whose ability to move independently worsened 18.7%
22% better than Minnesota average

Minnesota average: 23.8%

Low Risk Residents with Bowel/Bladder Incontinence Info Percent of low risk long-stay residents who lose control of their bowels or bladder 29.5%
18% worse than Minnesota average

Minnesota average: 25.0%

Falls with Major Injury Info Percent of long-stay residents experiencing one or more falls with major injury 5.6%
50% worse than Minnesota average

Minnesota average: 3.7%

High Risk Residents with Pressure Ulcers Info Percent of long-stay high risk residents with pressure ulcers 4.3%
21% better than Minnesota average

Minnesota average: 5.4%

Urinary Tract Infection Info Percent of long-stay residents with a urinary tract infection 3.7%
36% worse than Minnesota average

Minnesota average: 2.7%

Lost Too Much Weight Info Percent of long-stay residents who lose too much weight 3.5%
15% better than Minnesota average

Minnesota average: 4.1%

Depressive Symptoms Info Percent of long-stay residents who have depressive symptoms 1.6%
63% better than Minnesota average

Minnesota average: 4.4%

Antipsychotic Use Info Percent of long-stay residents who received an antipsychotic medication 12.3%
29% better than Minnesota average

Minnesota average: 17.2%

Pneumococcal Vaccine Info Percent of long-stay residents assessed and appropriately given the pneumococcal vaccine 96.4%
In line with Minnesota average

Minnesota average: 97.3%

Influenza Vaccine Info Percent of long-stay residents assessed and appropriately given the seasonal influenza vaccine 99.1%
In line with Minnesota average

Minnesota average: 96.0%

Short-stay resident measures
Pneumococcal Vaccine Info Percent of short-stay residents assessed and appropriately given the pneumococcal vaccine 98.8%
11% better than Minnesota average

Minnesota average: 88.9%

Antipsychotic medication increase Info Percent of short-stay residents who newly received an antipsychotic medication 1.9%
In line with Minnesota average

Minnesota average: 1.9%

Influenza Vaccine Info Percent of short-stay residents assessed and appropriately given the seasonal influenza vaccine 98.1%
19% better than Minnesota average

Minnesota average: 82.6%

Breakdown by payment type

Medicare

44% of new residents, usually for short-term rehab.

Typical stay 24 days

Private pay

55% of new residents, often for short stays.

Typical stay 1 - 2 months

Medicaid

1% of new residents, often for long-term daily care.

Typical stay 7 years

Facility Characteristics

Source: CMS Long-Term Care Facility Characteristics (Data as of Jan 2026)

Total residents 159
Medicare
57
35.8% of residents
Medicaid
64
40.3% of residents
Private pay or other
38
23.9% of residents
Programs & Services
Residents Group

Residents meet regularly to discuss policies, care quality, and activities

Family Member Group

Family members meet regularly to discuss policies, care quality, and activities

Active Family Council

Organized group of family members that meets regularly to discuss facility policies, resident care, and activities.

Active Resident Council

Organized group of residents that meets regularly to discuss facility policies, quality of life, and activities.

Finances and operations

Based on CMS SNF Cost Report for fiscal year ending in 12/2023.

Nonprofit
Nonprofit Corporation
Net patient revenue Info Net patient revenue — what the home actually collects for resident care, after contractual allowances, bad debt and discounts are subtracted from its gross charges (CMS cost report, Worksheet G-3). It covers resident care only; money the home earns from other sources is shown separately as "Other income."
$27.6M
Net patient income Info Net patient income: net patient revenue minus the home's total operating expenses. A positive figure means it earns more from resident care than it spends to deliver it; a negative figure means the opposite. It excludes non-operating "other income."
-$3.8M
Nonprofit Nonprofit Corporation
Net patient revenue Info Net patient revenue — what the home actually collects for resident care, after contractual allowances, bad debt and discounts are subtracted from its gross charges (CMS cost report, Worksheet G-3). It covers resident care only; money the home earns from other sources is shown separately as "Other income."
$27.6M Rank #1 / 89Revenue — State benchmarkedThis home is ranked 1st out of 89 homes in Minnesota. Shows this facility's annual revenue compared to the Minnesota average. Higher revenue generally means more resources for staffing and capital — read alongside Payroll %.Rankings are based only on facilities in Minnesota that report data for that category. Facilities without available data are excluded from the ranking.Click the rank badge to see the full State ranking.Click here to see the full State ranking.
Net patient income Info Net patient income: net patient revenue minus the home's total operating expenses. A positive figure means it earns more from resident care than it spends to deliver it; a negative figure means the opposite. It excludes non-operating "other income."
-$3.8M
Other income Info Money the home earns outside of resident care — such as investments, grants, rentals and other non-operating sources (CMS cost report, Worksheet G-3). It is tracked separately from net patient revenue: it is not part of that figure, and it is not included in net patient income.
$3.0M
Payroll costs Info Staff salaries plus wage-related costs — benefits such as payroll taxes, health insurance and retirement — from the home's own accounting records (CMS cost report, Worksheet A). Contract or agency labor is counted separately, under other operating costs. Rank #1 / 89Payroll — State benchmarkedThis home is ranked 1st out of 89 homes in Minnesota. Shows total annual staff payroll benchmarked to the Minnesota average. Higher payroll investment relative to peers often signals better staffing and less reliance on cheaper contract labor.Rankings are based only on facilities in Minnesota that report data for that category. Facilities without available data are excluded from the ranking.Click the rank badge to see the full State ranking.Click here to see the full State ranking.
$22.5M 81.5% of net patient revenue Info Payroll as a share of revenue: staff salaries and wage-related benefits divided by net patient revenue. A higher figure means more of each revenue dollar goes to staff pay. Rank #15 / 89Payroll % — State benchmarkedThis home is ranked 15th out of 89 homes in Minnesota. Shows payroll as a percentage of revenue versus the Minnesota average. Well-run Minnesota facilities typically land around 61–68% — the top third Statewide. Below 25% may signal understaffing or heavy agency use — read with Staffing ratings.Rankings are based only on facilities in Minnesota that report data for that category. Facilities without available data are excluded from the ranking.Click the rank badge to see the full State ranking.Click here to see the full State ranking.
Other operating costs Info Everything it costs to run the home apart from payroll — food, utilities, supplies, maintenance, contract labor and administration. Calculated as total operating expense minus payroll (staff salaries and wage-related benefits).
$8.9M
Total costs Info The home's total operating expense for the year — all the costs of running it, salaries included (CMS cost report, Worksheet G-3).
$31.4M

Who this home usually serves

TYPE OF STAY

Mix of rehab and long-term care

This home supports both short-term rehab and long-term care, with residents staying for a wide range of durations.

Most new residents arrive under private pay (55% of admissions), and a typical private pay stay runs around 1 - 2 months.

Admissions
924 total

Coverage residents most often arrive under.

Medicare 44%
Private pay 55%
Medicaid 1%
Discharges
847 total

Coverage residents most often leave under.

Medicare 47%
Private pay 52%
Medicaid 1%

Places of interest near Asst Lvg In Heritage Hall

Address 2.5 miles from city center Info Estimated distance in miles from Bloomington's city center to Asst Lvg In Heritage Hall's address, calculated via Google Maps.

Calculate Travel Distance to Asst Lvg In Heritage Hall

Add your location

Address

Compare Nursing Homes around Bloomington

The information below is reported by the Minnesota Department of Health, Health Regulation Division.

3 facilities compared · CMS & MN Dept. of Health data

Asst Lvg In Heritage Hall
NH
AL
Bloomington (West Bloomington)
52
Facility 52
MN AVG 61
Rank #250 / 532
100.0%
Facility 100.0%
MN AVG 79.7%
Rank #1 / 331
+25%
5.15
Facility 5.15
MN AVG 4.77
Rank #20 / 89
+33%+8%
$0
Facility $0
MN AVG $47.9k
Rank #1 / 90
16
Facility 16
MN AVG 23.2
Rank #21 / 90
4.0
Facility 4.0
MN AVG 3.8
Rank #48 / 90
169-
50
Facility 50
MN AVG 43
Rank #250 / 632
Mn Masonic Elder Services
$27.6M
Facility $27.6M
MN AVG $9.9M
Rank #1 / 89
$22.5M
Facility $22.5M
MN AVG $4.9M
Rank #1 / 89
81.5%
Facility 81.5%
MN AVG 50.7%
Rank #15 / 89
245343
Presbyterian Homes of Bloomington
NH
AL
IL
MC
Bloomington (West Bloomington)
111
Facility 111
MN AVG 61
Rank #98 / 532
81.1%
Facility 81.1%
MN AVG 79.7%
Rank #138 / 331
+2%
5.39
Facility 5.39
MN AVG 4.77
Rank #15 / 89
+16%+13%
$0
Facility $0
MN AVG $47.9k
Rank #1 / 90
12
Facility 12
MN AVG 23.2
Rank #17 / 90
4.0
Facility 4.0
MN AVG 3.8
Rank #48 / 90
-91-
37
Facility 37
MN AVG 43
Rank #357 / 632
Michelle Sullivan
$15.1M
Facility $15.1M
MN AVG $9.9M
Rank #11 / 89
$14.0M
Facility $14.0M
MN AVG $4.9M
Rank #10 / 89
93.1%
Facility 93.1%
MN AVG 50.7%
Rank #56 / 89
245556
Friendship Village of Bloomington
NH
AL
IL
MC
Bloomington (West Bloomington)
85
Facility 85
MN AVG 61
Rank #159 / 532
84.7%
Facility 84.7%
MN AVG 79.7%
Rank #114 / 331
+6%
4.76
Facility 4.76
MN AVG 4.77
Rank #36 / 89
+2%0%
$99.5k
Facility $99.5k
MN AVG $47.9k
Rank #80 / 90
18
Facility 18
MN AVG 23.2
Rank #28 / 90
6.0
Facility 6.0
MN AVG 3.8
Rank #80 / 90
163-
16
Facility 16
MN AVG 43
Rank #525 / 632
Jennifer Bever
$29.8M
Facility $29.8M
MN AVG $9.9M
Rank #3 / 89
$15.9M
Facility $15.9M
MN AVG $4.9M
Rank #6 / 89
53.3%
Facility 53.3%
MN AVG 50.7%
Rank #66 / 89
245229

Financial Assistance for
Nursing Home in Minnesota

Asst Lvg In Heritage Hall is located in Bloomington, Minnesota.
Here are the financial assistance programs available to residents in Minnesota.

Get Financial aid guidance

Elderly Waiver

Minnesota Medicaid EW

Age 65+
General Minnesota resident, Medicaid-eligible, nursing home-level care need.
Income Limits (2025) ~$2,829/month 300% FBR, individual
Asset Limits $3,000 individual, higher than most states
MN

Higher asset limit; rural access focus.

Benefits
Personal care (5-7 hours/day) Respite (240 hours/year) Adult day care (~$70/day) Home aides

Essential Community Supports (ECS)

Minnesota ECS

Age 65+
General Minnesota resident, at risk of decline but not nursing home level.
Income Limits ~$1,732/month individual, varies
Asset Limits $3,000 individual
MN

Bridges gap for those ineligible for waivers.

Benefits
In-home support (2-4 hours/week) Respite (up to 5 days/year) Transportation (~5 trips/month)

Alternative Care (AC) Program

Minnesota Alternative Care Program

Age 65+
General Minnesota resident, NFLOC, not MA-eligible.
Income Limits (2025) ~$1,255-$2,829/month (100%-300% FPL); sliding scale copays.
Asset Limits $3,000 (individual); home equity limit $713,000.
MN

CDCS option; statewide via counties.

Benefits
Personal care (4-6 hours/day) Respite (~5 days/year) Home health Meals Home mods

Minnesota Senior Health Options (MSHO)

Minnesota Senior Health Options

Age 65+
General Minnesota resident, eligible for MA and Medicare Parts A/B.
Income Limits (2025) ~$1,255/month (100% FPL for MA); spenddown allowed.
Asset Limits $3,000 (individual), $6,000 (couple).
MN

7 health plans (e.g., UCare, HealthPartners); care coordinator assigned.

Benefits
Personal care (5-7 hours/day) Medical care Respite Adult day care Home mods $900/year groceries (some plans)

Minnesota Senior Care Plus (MSC+)

Minnesota Senior Care Plus

Age 65+
General Minnesota resident, MA-eligible, not on Medicare.
Income Limits (2025) ~$1,255/month (100% FPL); spenddown allowed.
Asset Limits $3,000 (individual), $6,000 (couple).
MN

Includes EW services; 7 health plans available.

Benefits
Personal care (5-7 hours/day) Respite Adult day care Home mods Limited nursing home care

Consumer Support Grant (CSG)

Minnesota Consumer Support Grant

Age 65+ or disabled
General Minnesota resident, eligible for MA personal care but opts for grant.
Income Limits (2025) ~$1,255/month (MA-eligible); spenddown allowed.
Asset Limits $3,000 individual
MN

Can hire family; statewide via counties.

Benefits
Cash (~$500-$1,500/month) for personal care Respite Home mods Assistive tech

Medicare Savings Program (MSP)

Minnesota Medicare Savings Program

Age 65+ or disabled
General Minnesota resident, Medicare Part A/B.
Income Limits (2025) ~$2,510/month (QMB), ~$3,380/month (SLMB), ~$3,598/month (QI)—individual.
Asset Limits $9,430 (individual), $14,130 (couple).
MN

Three tiers; no waitlist; includes Extra Help for Part D.

Benefits
Covers Part B premiums ($174.70/month) Deductibles ($240/year) Copays (~20%)

VA Aid and Attendance (A&A) and Housebound Benefits

Minnesota VA Aid and Attendance/Housebound

Age 65+ or disabled veteran/spouse
General Minnesota resident, wartime service, need for ADL help (A&A) or homebound.
Income Limits (2025) Net income < ~$1,984/month (veteran with dependent, A&A); pension offsets income.
Asset Limits ~$155,356 net worth limit
MN

High veteran demand in rural/urban areas.

Benefits
Cash (~$1,433-$2,642/month veteran, ~$951-$1,318 spouse) for care costs (e.g., in-home, assisted living)

Frequently Asked Questions about Asst Lvg In Heritage Hall

What neighborhood is Asst Lvg In Heritage Hall in?

Asst Lvg In Heritage Hall is in the West Bloomington neighborhood of Bloomington.

Is Asst Lvg In Heritage Hall in a walkable area?

Asst Lvg In Heritage Hall has a walk score of 50. Moderately walkable. Some errands can be accomplished on foot, with a mix of nearby amenities.

What is the occupancy rate at Asst Lvg In Heritage Hall?

Asst Lvg In Heritage Hall's occupancy is 100%.

Does Asst Lvg In Heritage Hall operate as a for-profit or non-profit?

Asst Lvg In Heritage Hall is registered as a non-profit in MN.

How many beds does Asst Lvg In Heritage Hall have?

Asst Lvg In Heritage Hall has 52 beds.

Are there photos of Asst Lvg In Heritage Hall?

Yes — there are 7 photos of Asst Lvg In Heritage Hall in the photo gallery on this page.

What is the address of Asst Lvg In Heritage Hall?

Asst Lvg In Heritage Hall is located at 11501 Masonic Home Drive, Bloomington, MN 55437.

Guides for Better Senior Living

Care Cost Calculator: See Prices in Your Area

Nursing Home Data Explorer

Don’t Wait Too Long: 7 Red Flag Signs Your Parent Needs Assisted Living Now

The True Cost of Assisted Living in 2025 – And How Families Are Paying For It

Understanding Senior Living Costs: Pricing Models, Discounts & Financial Assistance