Autumn Care of Chesapeake

Nursing Home
Overview of Autumn Care of Chesapeake

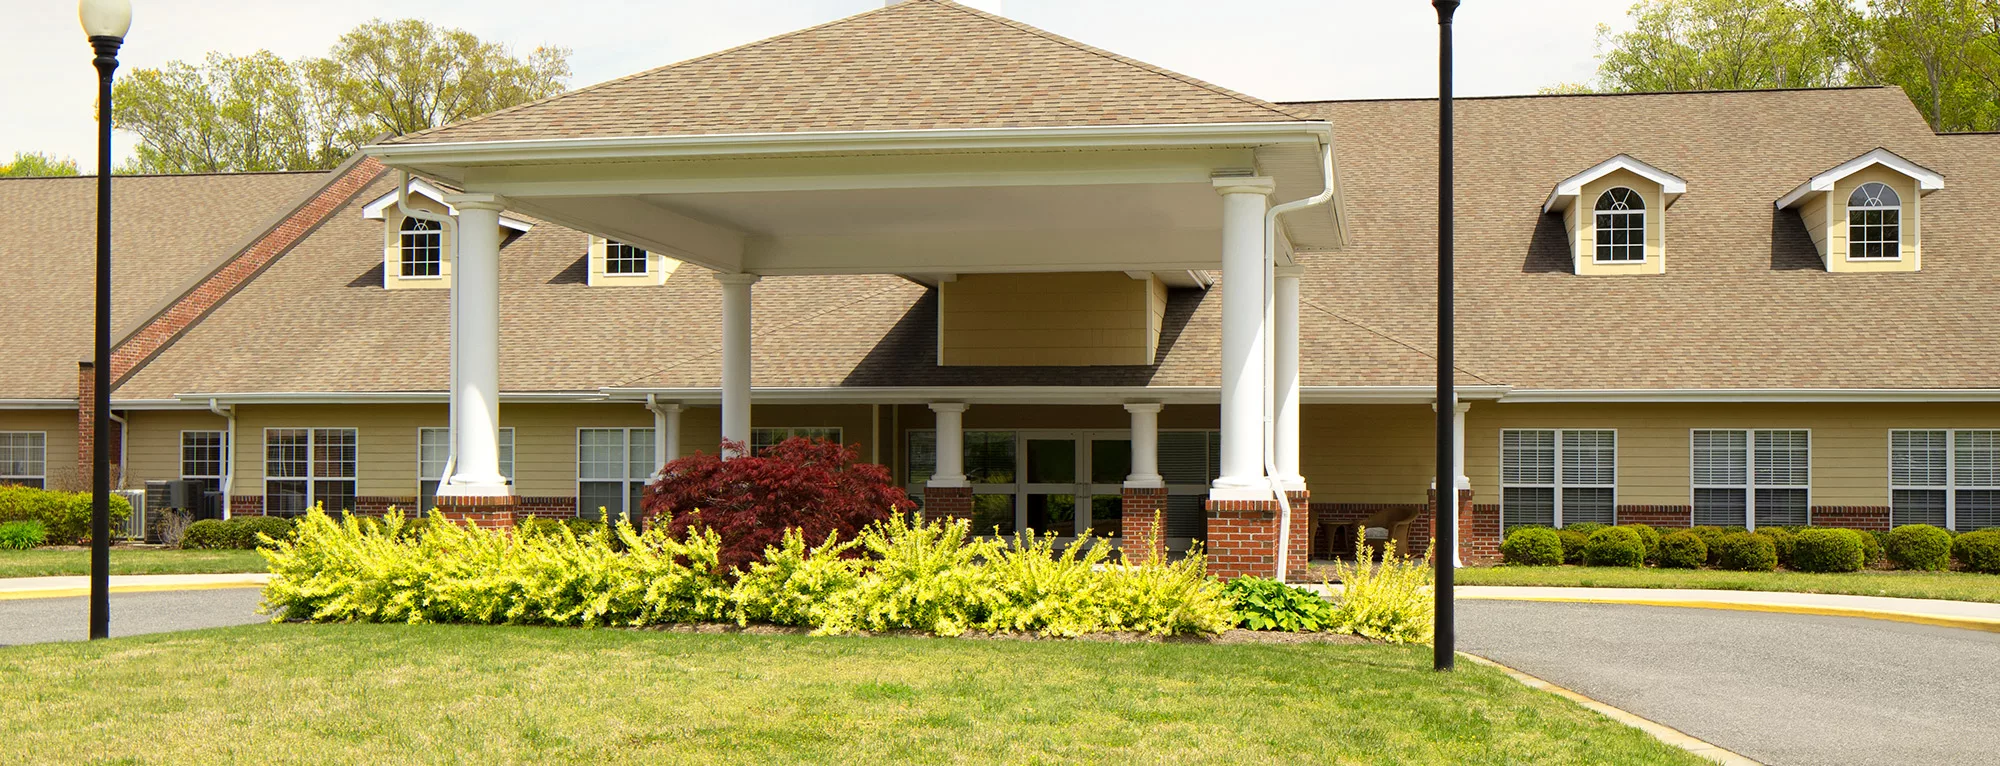
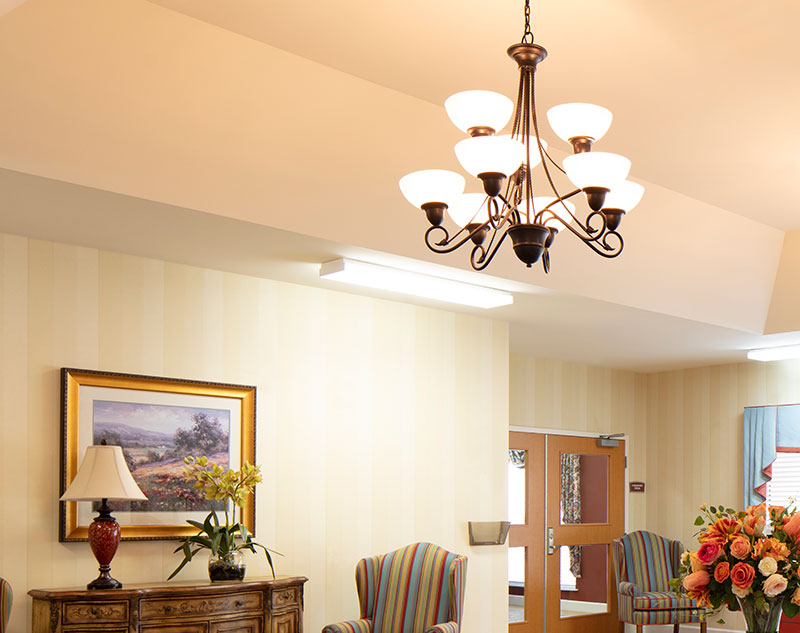
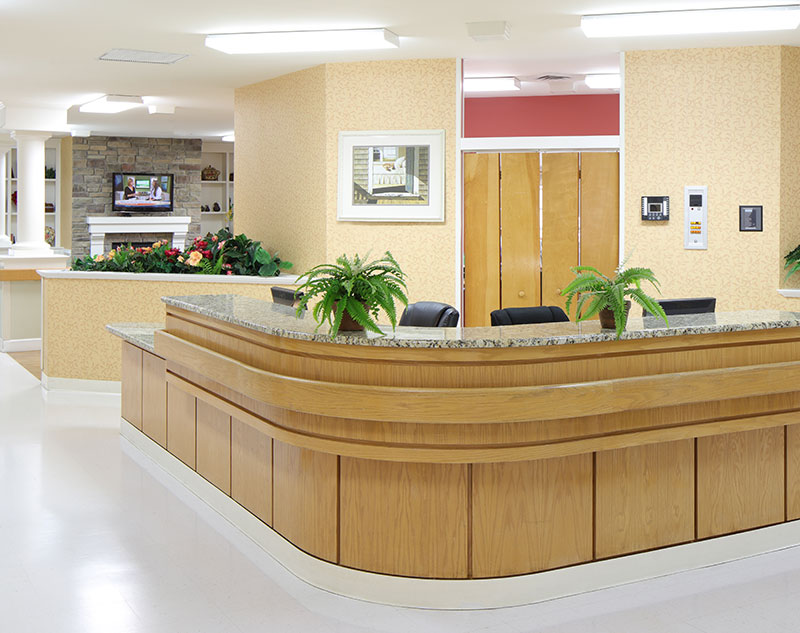
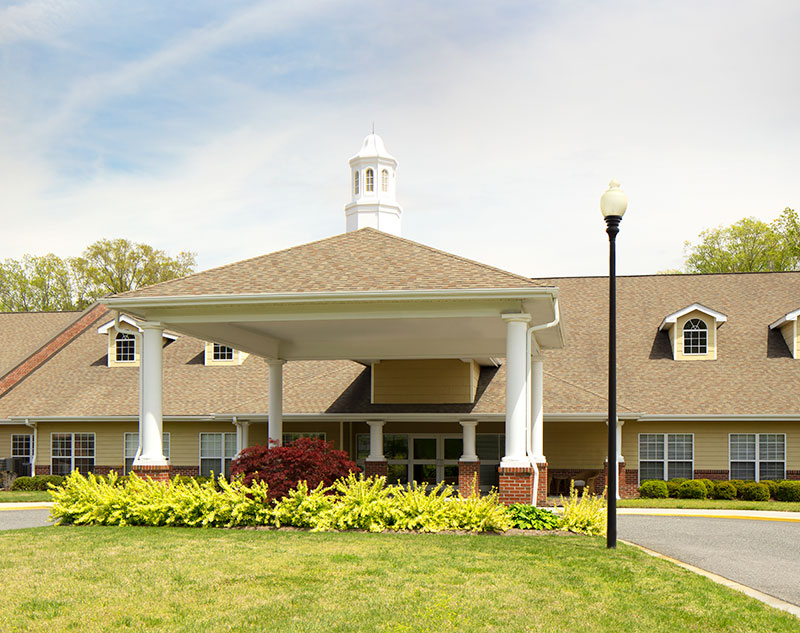
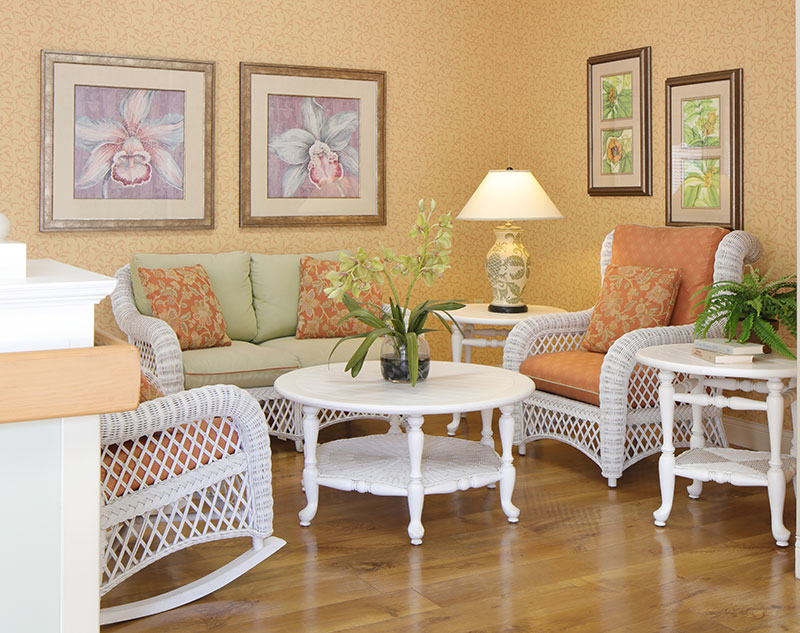
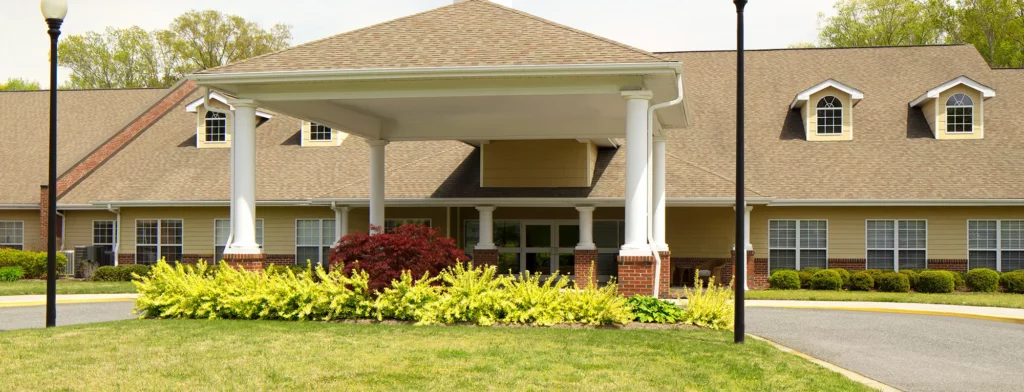
Autumn Care of Chesapeake is a skilled nursing and rehabilitation center that focuses on enhancing the quality of life of each senior resident. Specializing in short-term rehabilitation and long-term skilled nursing, the facility is cozy and comfortable for residents to make the best of their stay in a nurturing environment.

Autumn Care of Chesapeake is guaranteed to create connections and provide engaging experiences among community members while maintaining a balance of independence and extra comprehensive assistance.

(757) 547-4528

Quality ratings

Measured by Centers for Medicare & Medicaid Services (CMS)

Overall rating Info Official CMS rating based on health inspections, staffing and quality measures.
3/5
Virginia average: 3.0/5
Health Inspection Info Official CMS rating based on deficiencies found during state health inspections.
3/5
Virginia average: 2.8/5
Staffing Info Official CMS rating based on nurse staffing hours per resident per day.
2/5
Virginia average: 2.5/5
Quality Measures Info Official CMS rating based on clinical outcomes for residents.
3/5
Virginia average: 3.8/5

Nursing care per resident

Info Average daily nursing hours per resident (adjusted for acuity). Higher values indicate more nursing time per resident.
3h 25m per day

This home provides 9% less nursing time per resident than the state average.

Virginia average: 3h 45m per day

Capacity and availability

Medium-capacity home

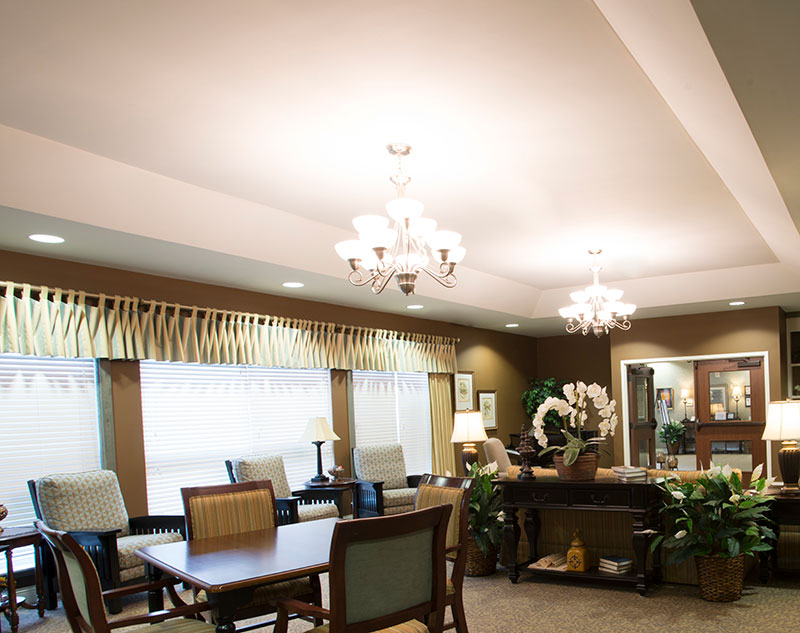
Offers a balance of services and community atmosphere.

Total beds 117

This home usually has limited availability

Occupancy is moderate, suggesting balanced demand.

Similar demand to the Virginia average
Occupancy rate 91.6%
Residents per day (avg) 110
Occupancy rate
91.6%
Residents per day (avg)
110

Who this home usually serves

TYPE OF STAY

Mix of rehab and long-term care

This home supports both short-term rehab and long-term care, with residents staying for a wide range of durations.

Breakdown by payment type

Medicare

40% of new residents, usually for short-term rehab.

Typical stay 19 days

Private pay

59% of new residents, often for short stays.

Typical stay 3 - 4 months

Medicaid

1% of new residents, often for long-term daily care.

Typical stay 10 - 11 months

Finances and operations

Proprietary home
Corporation
Home revenue
$13.4M
Profit
$669.4K
Proprietary home Corporation
Home revenue
$13,372,789.00
Profit
$669,371.00
Payroll costs Info The portion of the home's budget spent on staff, including nurses, caregivers, and other employees who support care and operations.
$5.9M
44.3% of revenue
Other operating costs Info All remaining costs needed to run the home, such as food, utilities, building maintenance, supplies and administrative expenses.
$6.8M
Total costs $12.7M
Contact Autumn Care of Chesapeake

Compare Nursing Homes around Chesapeake

The information below is reported by the Virginia Department of Social Services and Department of Health.
Autumn Care of Chesapeake
SNF

Nursing Homes 24/7 care needed

Chesapeake (Greenbrier East)
117
No
5
BONAWIT, ANTHONY
91.6%
$13,372,523.00
$5,929,282.00
44.3%
109.90
3/5
3.4090
3/5
2/5
3/5
-
43
-
+12%
-9%
+7%
Carrington Place of Chesapeake
SNF

Nursing Homes 24/7 care needed

Chesapeake (Deep Creek North)
120
No
40
-
72.6%
$9,846,300.00
$3,847,645.00
39.1%
99.10
1/5
3.4483
2/5
2/5
1/5
-
58
-
-32%
-8%
-15%
Chesapeake Health and Rehabilitation Center
SNF

Nursing Homes 24/7 care needed

Chesapeake (Greenbrier West)
180
No
59
CHESAPEAKE HOLDINGS I LLC
95.8%
$30,038,815.00
$8,979,578.00
29.9%
171.70
1/5
3.0158
1/5
1/5
4/5
2
50
5
-46%
-19%
+12%

Places of interest near Autumn Care of Chesapeake

Address 7.3 miles from city center — 2.56 miles to nearest hospital (Chesapeake Regional Medical Center)

Address 715 Argyll St, Chesapeake, VA 23320

Calculate Travel Distance to Autumn Care of Chesapeake

Add your location

Address

Staffing Data

Source: CMS Payroll-Based Journal (Q2 2025)

224
Total Staff
96
Employees
128
Contractors
43,399
Total Hours (Quarter)
59
Avg Staff/Day
8.1
Avg Shift (hrs)
Nursing Staff Breakdown
Role Count Avg Shift (hrs) Uses Contractors?
Registered Nurse2310.3 Yes
Licensed Practical Nurse489.9 Yes
Certified Nursing Assistant1067.9 Yes
Staff by Category
Administration
3 staff
5.1hs shift avg
Nursing Staff
182 staff
8.5hs shift avg
Physicians & Practitioners
4 staff
7.7hs shift avg
Therapy Services
29 staff
6.1hs shift avg
Activities & Recreation
0 staff
0hs shift avg
Social Services
2 staff
6.5hs shift avg
Dietary Services
2 staff
7.2hs shift avg
Other Services
2 staff
7.9hs shift avg
Contractor Analysis
27.4%
of total hours from contractors
11,903 contractor hours this quarter
Certified Nursing Assistant: 53 RN Director of Nursing: 1 Licensed Practical Nurse: 27 Respiratory Therapy Technician: 5 Qualified Social Worker: 2 Physical Therapy Aide: 6 Speech Language Pathologist: 4 Registered Nurse: 15 Occupational Therapy Assistant: 8 Physical Therapy Assistant: 5 Medical Director: 1 Clinical Nurse Specialist: 1
Role Employees Contractors Total Staff Total Hours Days Worked % of Days Avg Shift (hrs)
Certified Nursing Assistant535310620,78291100%7.9
Licensed Practical Nurse2127489,98091100%9.9
Registered Nurse815233,43191100%10.3
RN Director of Nursing4151,8817380%7.6
Respiratory Therapy Technician0551,1937178%6.7
Physical Therapy Assistant0551,0347178%7.4
Dental Services Staff2021,0006976%7.9
Physical Therapy Aide0669396673%6.9
Speech Language Pathologist0445627684%6.6
Dietitian1014546369%7.2
Other Dietary Services Staff1014426268%7.1
Administrator2024245156%8
Qualified Social Worker0224236470%6.5
Nurse Practitioner1014085156%8
Occupational Therapy Aide1012787582%3.7
Occupational Therapy Assistant088695560%1.2
Clinical Nurse Specialist213681112%6.1
Medical Director011313640%0.9

Health Inspection History

Inspections
Total health inspections 3

Virginia average 4.2


Last Health inspection on Dec 2023

Total health citations 43
Citations per inspection
14.33

Health citations are formal notices following inspections when they fail to comply with safety and care standards.

38 of 43 citations resulted from standard inspections; and 5 of 43 came from combined inspections (standard and complaint).

Breakdown of citation severity (last 3 years)
Critical Health citations More info 0
100% better than Virginia average

Virginia average: 0.4


Serious Health citations More info 0
100% better than Virginia average

Virginia average: 1

0 critical citations More info Virginia average: 0.4

0 serious citations More info Virginia average: 1

42 moderate citations More info Virginia average: 36.3

1 minor citation More info Virginia average: 0.8
Citations history (last 3 years)
Administration moderate citation Dec 08, 2023
Corrected

Environmental moderate citation Dec 08, 2023
Corrected

Nursing Services moderate citation Dec 08, 2023
Corrected

Pharmacy moderate citation Dec 08, 2023
Corrected

Facility Characteristics

Source: CMS Long-Term Care Facility Characteristics (Data as of Jan 2026)

Ownership: For-Profit LLC
Part of: Autumn Corporation
Resident Census by Payment Source
105 Total Residents
Medicare 19 (18.1%)
Medicaid 64 (61%)
Private Pay/Other 22 (21%)
Programs & Services
Residents' Group
Family Engagement

Active councils help families stay involved in care decisions and facility operations.

Quality of care over time

These measures show how residents usually do over time at this home, based on health outcomes and preventive care.

High-risk clinical events score Info A composite score based on pressure ulcers, falls with injury, weight loss, walking ability decline, and activities of daily living decline. 13.4
32% worse than Virginia average

Virginia average: 10.1

Functional decline score Info A composite score based on activities of daily living decline, walking ability decline, and incontinence. 24.2
23% worse than Virginia average

Virginia average: 19.7

Long-stay resident measures
Need for Help with Daily Activities Increased Info Percent of long-stay residents whose need for help with daily activities has increased 27.0%
60% worse than Virginia average

Virginia average: 16.8%

Walking Ability Worsened Info Percent of long-stay residents whose ability to move independently worsened 30.5%
54% worse than Virginia average

Virginia average: 19.7%

Low Risk Residents with Bowel/Bladder Incontinence Info Percent of low risk long-stay residents who lose control of their bowels or bladder 15.2%
33% better than Virginia average

Virginia average: 22.6%

Falls with Major Injury Info Percent of long-stay residents experiencing one or more falls with major injury 1.9%
47% better than Virginia average

Virginia average: 3.6%

High Risk Residents with Pressure Ulcers Info Percent of long-stay high risk residents with pressure ulcers 3.2%
41% better than Virginia average

Virginia average: 5.4%

Urinary Tract Infection Info Percent of long-stay residents with a urinary tract infection 0.3%
79% better than Virginia average

Virginia average: 1.5%

Lost Too Much Weight Info Percent of long-stay residents who lose too much weight 4.4%
25% better than Virginia average

Virginia average: 5.9%

Depressive Symptoms Info Percent of long-stay residents who have depressive symptoms 28.0%
88% worse than Virginia average

Virginia average: 14.9%

Antipsychotic Use Info Percent of long-stay residents who received an antipsychotic medication 11.5%
11% better than Virginia average

Virginia average: 12.9%

Pneumococcal Vaccine Info Percent of long-stay residents assessed and appropriately given the pneumococcal vaccine 86.9%
5% worse than Virginia average

Virginia average: 91.3%

Influenza Vaccine Info Percent of long-stay residents assessed and appropriately given the seasonal influenza vaccine 96.4%
In line with Virginia average

Virginia average: 94.0%

Short-stay resident measures
Pneumococcal Vaccine Info Percent of short-stay residents assessed and appropriately given the pneumococcal vaccine 48.7%
35% worse than Virginia average

Virginia average: 74.9%

Antipsychotic medication increase Info Percent of short-stay residents who newly received an antipsychotic medication 1.6%
29% worse than Virginia average

Virginia average: 1.2%

Influenza Vaccine Info Percent of short-stay residents assessed and appropriately given the seasonal influenza vaccine 44.8%
39% worse than Virginia average

Virginia average: 73.6%

Guides for Better Senior Living

Care Cost Calculator: See Prices in Your Area

Nursing Home Data Explorer

Don’t Wait Too Long: 7 Red Flag Signs Your Parent Needs Assisted Living Now

The True Cost of Assisted Living in 2025 – And How Families Are Paying For It

Understanding Senior Living Costs: Pricing Models, Discounts & Financial Assistance

Financial Aid for Virginia Seniors

Get financial aid guidance

Commonwealth Coordinated Care Plus (CCC Plus)

VA Medicaid CCC Plus

Age 65+ or disabled, Virginia resident, Medicaid-eligible, nursing home-level care need.

~$2,829/month (300% FBR, individual).

$2,000 (individual), $3,000 (couple).

Managed care model; high demand in urban areas.

Virginia Respite Care Grant Program

VA Respite Grant

Caregiver of someone 60+, Virginia resident.

~$2,500/month (individual, varies).

$40,000 (individual).

Limited grants; rural/urban balance.

Adult Services Program

Virginia Adult Services (AS)

Age 60+ (or disabled 18+), VA resident, need significant care (2+ ADLs), not Medicaid-eligible.

Varies by locality; typically < ~$2,510/month (200% FPL).

Limited assets (excludes home, car); varies by DSS.

Serves ~5,000 annually; focuses on low-income independence.

Auxiliary Grant Program

Virginia Auxiliary Grant (AG)

Age 65+ (or disabled 18+), VA resident, living in approved ALF/foster care, SSI-eligible or low-income.

~$1,041/month (individual, SSI level + $20 disregard); higher with medical deductions.

$2,000 (individual).

Serves 4,000; personal needs allowance ($90/month).

Medicare Savings Program (MSP)

Virginia Medicare Savings Program

Age 65+ or disabled, VA resident, Medicare Part A/B.

~$2,510/month (QMB), ~$3,380/month (SLMB), ~$3,598/month (QI)—individual.

$9,430 (individual), $14,130 (couple).

Includes Extra Help for Part D; no waitlist.

Energy Assistance Program (EAP)

Virginia Energy Assistance Program

Age 60+ prioritized, VA resident, low-income household.

~$3,970/month (185% FPL).

Not assessed.

Fuel, Crisis, Cooling components; serves ~100,000 households.

Senior Community Service Employment Program (SCSEP)

Virginia SCSEP

Age 55+, unemployed, low-income, VA resident.

~$1,983/month (125% FPL).

Not specified.

Priority for veterans, rural residents; AARP/Goodwill partnership.

VA Aid and Attendance (A&A) and Housebound Benefits

Virginia VA Aid and Attendance/Housebound

Age 65+ or disabled veteran/spouse, VA resident, wartime service, ADL help (A&A) or homebound.

Net income < ~$1,984/month (veteran with dependent, A&A); pension offsets income.

~$155,356 (net worth).

High veteran population; supports rural/urban needs.

Property Tax Relief for the Elderly and Disabled

Virginia Property Tax Relief

Age 65+ or disabled, VA resident, homeowner, income/asset limits vary by locality.

~$50,000-$75,000/year (household, e.g., Fairfax: $72,000; Richmond: $50,000).

Varies (e.g., Fairfax: $400,000 net worth; Richmond: $100,000).

Offered in 90% of localities; saves ~$500-$2,000/year.

Senior Farmers’ Market Nutrition Program (SFMNP)

Virginia SFMNP

Age 60+, VA resident, low-income.

~$2,322/month (185% FPL).

Not assessed.

Vouchers (~$50-$75/season); serves ~15,000 via AAAs.

Who we are

Your Senior Care Partner, Every Step of the Way

We help families find affordable senior communities and unlock same day discounts, Medicaid, and Medicare options tailored to your needs.

Contact us Today
Tour Icon
Planning a tour? Check our touring checklist.
Chat Icon
Thinking of living here? We can help you speak to a current resident