


Total staff
217
Employees
200
Contractors
17
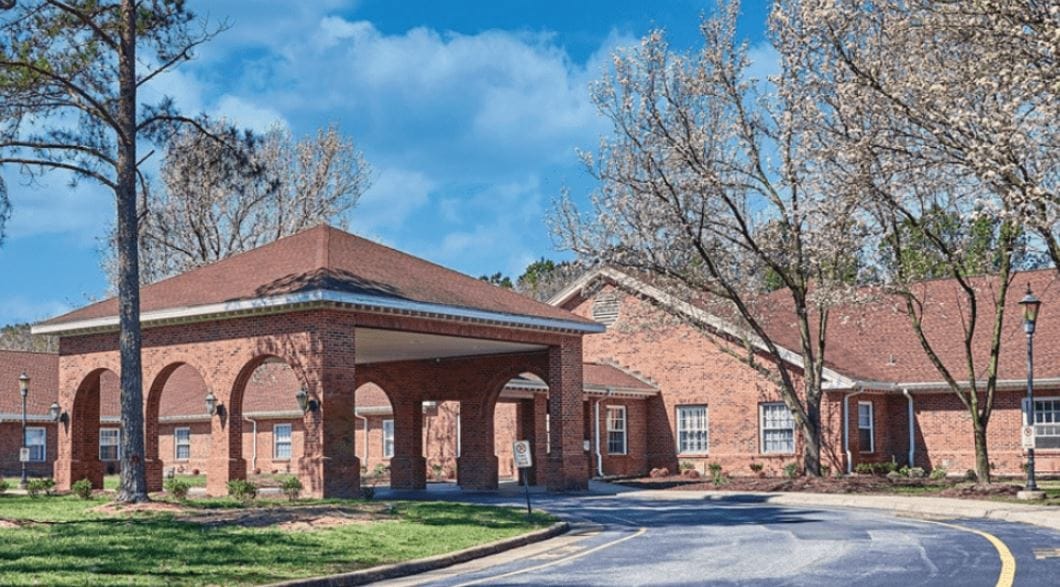


Located at 688 Kingsborough Square in Chesapeake, this 180-bed nursing home operates under Chesapeake Holdings I LLC ownership. The facility delivers skilled nursing, rehabilitation, respite care, and memory care, with residents spanning Medicare, Medicaid, and private pay, averaging 83 days per stay. Occupancy at 95.8% far exceeds the Virginia average of 85.7%.
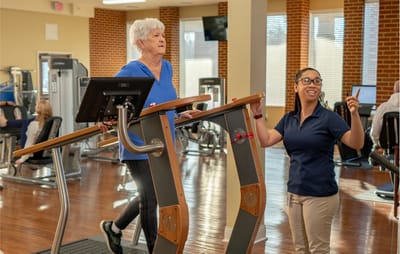
Programming includes the LifeWorkRehab model, Advanced Rehabilitation Conditioning (ARC®), Fast Track Ortho recovery track, and specialized modules for post-surgical and post-accident rehabilitation. Amenities comprise restaurant-style dining, a state-of-the-art exercise facility, and active resident and family governance councils.
The 1-star CMS rating signals systematic care and safety deficiencies despite financial strength. Health inspections run 64% below the Virginia benchmark. More strikingly, staffing at 3 hours 1 minute per resident daily ranks 72nd of 85 state facilities; 59.5% below state average, with a staff-to-resident ratio of 1.31-to-1, 21% worse than the 1.67-to-1 Virginia norm.
The facility reports 50 citations with 10 citations per inspection and 5 critical findings.
Federal penalties in 2023-24 totaled $25,000 across two fines, well below the state average, and no Medicare/Medicaid payment denials occurred.
Depressive symptoms strike 23.2% of residents, 56% exceeding state prevalence. Antipsychotic medication use reaches 23.1%; 80% above state averages, suggesting either substantial behavioral or psychiatric load, or medication patterns warranting scrutiny. ADL decline affects 22.2% of long-stayers (32% worse than average), while pressure ulcers develop in 7.6% of high-risk residents (41% worse than benchmark).
On the other hand,:major injury falls remain rare at 1.7% (53% below state), weight loss stays controlled at 3.3% (44% below average), and urinary infections nearly absent at 0.2%.
The facility generates strong revenue: $30.2 million annually with $1.2 million net income. And, it maintains 95.8% occupancy. Yet payroll represents only 38.7% of the operating budget, substantially below the 51-60% range that characterizes well-resourced peers across Virginia.
| Staff type | Hours / Day / Resident | vs state avg |
|---|---|---|
|
Registered Nurse (RN)
| 21m per day | ▼ 49% State avg: 41m per day · National avg: 41m per day |
|
LPN / LVN
| 1h 0m per day | ■ Avg State avg: 1h 0m per day · National avg: 52m per day |
|
Nurse Aide
| 1h 40m per day | ▼ 22% State avg: 2h 8m per day · National avg: 2h 21m per day |
|
Weekend Total Nursing
| 2h 31m per day | ▼ 24% State avg: 3h 19m per day · National avg: 3h 26m per day |
|
Physical Therapist
| 5m per day | ▼ 8% State avg: 5m per day · National avg: 4m per day |
|
Weekend RN
| 9m per day | ▼ 67% State avg: 28m per day · National avg: 29m per day |
Reporting period: October 1 – December 31, 2025 (Q4 2025). Source: CMS Payroll-Based Journal report.
Manages medical care and health needs.
Assists with medical care and medications.
Helps with daily care and mobility.
Total hours from contractors
2,400 contractor hours this quarter
| Certified Nursing Assistant | 80 | 12 | 92 | 26,642 | 92 | 100% | 8.1 |
| Licensed Practical Nurse | 40 | 5 | 45 | 13,576 | 92 | 100% | 8.6 |
| Registered Nurse | 14 | 0 | 14 | 3,290 | 92 | 100% | 7.9 |
| RN Director of Nursing | 11 | 0 | 11 | 2,777 | 77 | 84% | 7 |
| Speech Language Pathologist | 13 | 0 | 13 | 2,364 | 90 | 98% | 6.5 |
| Physical Therapy Aide | 7 | 0 | 7 | 2,057 | 79 | 86% | 6.9 |
| Clinical Nurse Specialist | 8 | 0 | 8 | 1,902 | 78 | 85% | 6.8 |
| Physical Therapy Assistant | 5 | 0 | 5 | 1,376 | 76 | 83% | 7.3 |
| Respiratory Therapy Technician | 4 | 0 | 4 | 1,244 | 76 | 83% | 6.7 |
| Other Dietary Services Staff | 3 | 0 | 3 | 1,023 | 83 | 90% | 6.6 |
| Dental Services Staff | 2 | 0 | 2 | 984 | 68 | 74% | 7.8 |
| Qualified Social Worker | 2 | 0 | 2 | 933 | 80 | 87% | 8.1 |
| Other Social Services Staff | 3 | 0 | 3 | 663 | 64 | 70% | 8 |
| Mental Health Service Worker | 2 | 0 | 2 | 498 | 55 | 60% | 6.7 |
| Dietitian | 1 | 0 | 1 | 458 | 62 | 67% | 7.4 |
| Nurse Practitioner | 1 | 0 | 1 | 424 | 56 | 61% | 7.6 |
| Administrator | 1 | 0 | 1 | 414 | 58 | 63% | 7.1 |
| Nurse Aide in Training | 3 | 0 | 3 | 367 | 37 | 40% | 8 |
Includes penalties issued in 2023-2024
Federal penalties imposed by CMS for regulatory violations, including civil money penalties (fines) and denials of payment for new Medicare/Medicaid admissions.
Source: CMS Penalties Database (Data as of Jan 2026)
Virginia average: $52K
Virginia average: 1.8
Virginia average: 0.1
Penalties are imposed by CMS for violations of federal nursing home regulations.
2 penalties in the past 3 years
Multiple penalties were reported in the last 3 years.
Last updated: Jan 2026
These measures show how residents usually do over time at this home, based on health outcomes and preventive care.
Virginia average: 10.1
Virginia average: 19.7
Virginia average: 16.8%
Virginia average: 19.7%
Virginia average: 22.6%
Virginia average: 3.6%
Virginia average: 5.4%
Virginia average: 1.5%
Virginia average: 5.9%
Virginia average: 14.9%
Virginia average: 12.9%
Virginia average: 91.3%
Virginia average: 94.0%
Virginia average: 1.46
Virginia average: 1.41
Virginia average: 74.9%
Virginia average: 1.2%
Virginia average: 73.6%
Virginia average: 22.0%
Virginia average: 11.7%
Virginia average: 0.8%
Virginia average: 53.7%
Virginia average: 50.6%
Quality measures are calculated from Minimum Data Set (MDS) assessments. For most measures, lower percentages indicate better care quality.
19% of new residents, usually for short-term rehab.
15% of new residents, often for short stays.
65% of new residents, often for long-term daily care.
Source: CMS Long-Term Care Facility Characteristics (Data as of Jan 2026)
Residents meet regularly to discuss policies, care quality, and activities
Family members meet regularly to discuss policies, care quality, and activities
Organized group of family members that meets regularly to discuss facility policies, resident care, and activities.
Organized group of residents that meets regularly to discuss facility policies, quality of life, and activities.
Data sourced from CMS Long-Term Care Facility Characteristics quarterly report. Payer mix reflects the current resident census by primary payment source.
Historical financial and operational data for Chesapeake Health and Rehabilitation Center from 2011–2024, based on CMS SNF Cost Reports.
Key figures below are for fiscal year ending in 06/2024.
Based on CMS SNF Cost Report for fiscal year ending in 06/2024.
Most residents stay for extended periods and receive ongoing daily care.
Most new residents arrive under Medicaid (65% of admissions), and a typical Medicaid stay runs around 2 - 3 months.
Coverage residents most often arrive under.
Coverage residents most often leave under.
![]() 2.8 miles from city center
2.8 miles from city center
![]() Estimated distance in miles from Chesapeake's city center to Chesapeake Health and Rehabilitation Center's address, calculated via Google Maps.
— 0.11 miles to nearest hospital (Chesapeake Regional Medical Center)
Estimated distance in miles from Chesapeake's city center to Chesapeake Health and Rehabilitation Center's address, calculated via Google Maps.
— 0.11 miles to nearest hospital (Chesapeake Regional Medical Center)
Add your location
The information below is reported by the Virginia Department of Social Services and Department of Health.
| Autumn Care of Chesapeake | NH HOS MC RC SNF | Chesapeake (Greenbrier East) | 117
Facility
117
VA AVG
96
Rank
#98 / 365 |
96.1%
Facility
96.1%
VA AVG
70.5
Rank
#17 / 297 | +36% | 3.41
Facility
3.41
VA AVG
3.74
Rank
#50 / 78 | -24% | -9% | $0
Facility
$0
VA AVG
$54.3k
Rank
#1 / 82 | 43
Facility
43
VA AVG
38.4
Rank
#53 / 77 | 14.3
Facility
14.3
VA AVG
8.9
Rank
#66 / 77 | - | 112 | - |
5
Facility
5
VA AVG
44
Rank
#424 / 446 | Anthony Bonawit | $13.6MFiscal year ending 12/2023
Facility
$13.6MFiscal year ending 12/2023
VA AVG
$18.3M
Rank
#60 / 78 | $6.7MFiscal year ending 12/2023
Facility
$6.7MFiscal year ending 12/2023
VA AVG
$6.9M
Rank
#47 / 78 | 49.1%Fiscal year ending 12/2023
Facility
49.1%Fiscal year ending 12/2023
VA AVG
39.7%
Rank
#5 / 78 | 495256 | ||||
| Carrington Place of Chesapeake | NH | Chesapeake (Deep Creek North) | 120
Facility
120
VA AVG
96
Rank
#87 / 365 |
81.0%
Facility
81.0%
VA AVG
70.5
Rank
#100 / 297 | +15% | 3.45
Facility
3.45
VA AVG
3.74
Rank
#50 / 78 | +7% | -8% | $0
Facility
$0
VA AVG
$54.3k
Rank
#1 / 82 | 58
Facility
58
VA AVG
38.4
Rank
#66 / 77 | 9.7
Facility
9.7
VA AVG
8.9
Rank
#48 / 77 | - | 97 | - |
40
Facility
40
VA AVG
44
Rank
#245 / 446 | - | $8.8MFiscal year ending 12/2023
Facility
$8.8MFiscal year ending 12/2023
VA AVG
$18.3M
Rank
#75 / 78 | $4.3MFiscal year ending 12/2023
Facility
$4.3MFiscal year ending 12/2023
VA AVG
$6.9M
Rank
#74 / 78 | 48.5%Fiscal year ending 12/2023
Facility
48.5%Fiscal year ending 12/2023
VA AVG
39.7%
Rank
#27 / 78 | 495330 | ||||
| Chesapeake Health and Rehabilitation Center | NH SNF | Chesapeake (Greenbrier West) | 180
Facility
180
VA AVG
96
Rank
#23 / 365 |
97.9%
Facility
97.9%
VA AVG
70.5
Rank
#11 / 297 | +39% | 3.02
Facility
3.02
VA AVG
3.74
Rank
#67 / 78 | -33% | -19% | $24.6k
Facility
$24.6k
VA AVG
$54.3k
Rank
#76 / 82 | 50
Facility
50
VA AVG
38.4
Rank
#60 / 77 | 10.0
Facility
10.0
VA AVG
8.9
Rank
#50 / 77 | 5 | 176 | - |
59
Facility
59
VA AVG
44
Rank
#115 / 446 | Chesapeake Holdings I LLC | $24.8MFiscal year ending 06/2024
Facility
$24.8MFiscal year ending 06/2024
VA AVG
$18.3M
Rank
#34 / 78 | $10.0MFiscal year ending 06/2024
Facility
$10.0MFiscal year ending 06/2024
VA AVG
$6.9M
Rank
#32 / 78 | 40.4%Fiscal year ending 06/2024
Facility
40.4%Fiscal year ending 06/2024
VA AVG
39.7%
Rank
#55 / 78 | 495108 |
Chesapeake Health and Rehabilitation Center is located in Chesapeake, Virginia.
Here are the financial assistance programs available to residents in Virginia.
Chesapeake Health and Rehabilitation Center is in the Greenbrier West neighborhood.
Chesapeake Health and Rehabilitation Center has a walk score of 59. Moderately walkable. Some errands can be accomplished on foot, with a mix of nearby amenities.
Chesapeake Health and Rehabilitation Center's occupancy is 95.8%.
No, Chesapeake Health and Rehabilitation Center has a no-pet policy.
Chesapeake Health and Rehabilitation Center is registered as a for-profit.
Yes — there are 7 photos of Chesapeake Health and Rehabilitation Center in the photo gallery on this page.
Chesapeake Health and Rehabilitation Center is located at 688 Kingsborough Square, Chesapeake, VA 23320.
Care Cost Calculator: See Prices in Your Area
Nursing Home Data Explorer
Don’t Wait Too Long: 7 Red Flag Signs Your Parent Needs Assisted Living Now
The True Cost of Assisted Living in 2025 – And How Families Are Paying For It
Understanding Senior Living Costs: Pricing Models, Discounts & Financial Assistance


