


Total staff
203
Employees
118
Contractors
85
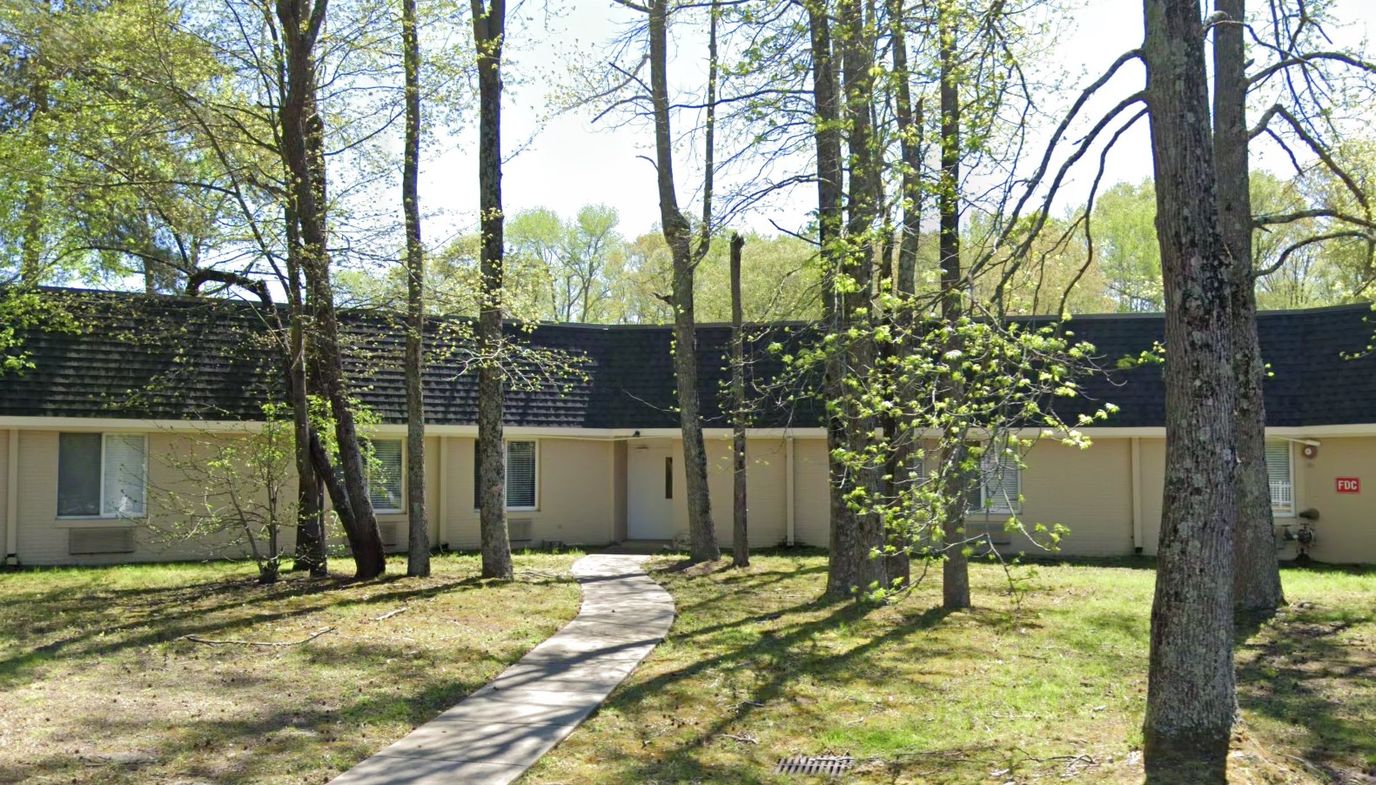
Located on George Washington Highway North in Chesapeake, Virginia, Carrington Place of Chesapeake is a skilled nursing home about 4 miles from Bon Secours Maryview Medical Center. The community has 120 beds with an occupancy rate of 73%. Residents stay an average of 192 days, which is a mix of short-term rehabilitation and longer-term skilled nursing care.
Residents receive wound care, dental care, and speech, occupational, and physical therapy, supported by 24-hour nursing supervision. Medication management, housekeeping, and organised social activities are also part of everyday life. Nursing staff provide an average of about 3 hours and 27 minutes of care per resident each day, giving residents consistent hands-on support.
The community accepts Medicare, Medicaid, and private pay, offering several payment options for both post-hospital recovery and long-term care. Residents can also take part in an active Resident Council, which meets regularly to discuss community policies, quality of care, and planned activities.
The neighbourhood has a Walk Score of 40, which is somewhat walkable. A few nearby destinations can be reached on foot, but most errands and outings require a car. Families may want to keep this in mind if residents or visitors plan to travel around the area independently.
| Staff type | Hours / Day / Resident | vs state avg |
|---|---|---|
|
Registered Nurse (RN)
| 25m per day | ▼ 39% State avg: 41m per day · National avg: 41m per day |
|
LPN / LVN
| 1h 4m per day | ▲ 7% State avg: 1h 0m per day · National avg: 52m per day |
|
Nurse Aide
| 1h 46m per day | ▼ 17% State avg: 2h 8m per day · National avg: 2h 21m per day |
|
Weekend Total Nursing
| 2h 45m per day | ▼ 17% State avg: 3h 19m per day · National avg: 3h 26m per day |
|
Physical Therapist
| 1m per day | ▼ 88% State avg: 5m per day · National avg: 4m per day |
|
Weekend RN
| 12m per day | ▼ 57% State avg: 28m per day · National avg: 29m per day |
Reporting period: October 1 – December 31, 2025 (Q4 2025). Source: CMS Payroll-Based Journal report.
Manages medical care and health needs.
Assists with medical care and medications.
Helps with daily care and mobility.
Total hours from contractors
2,909 contractor hours this quarter
| Certified Nursing Assistant | 37 | 55 | 92 | 15,772 | 92 | 100% | 9.4 |
| Licensed Practical Nurse | 20 | 15 | 35 | 7,395 | 92 | 100% | 9.7 |
| Physical Therapist | 9 | 0 | 9 | 3,359 | 77 | 84% | 7.7 |
| RN Director of Nursing | 7 | 0 | 7 | 2,174 | 74 | 80% | 7.7 |
| Registered Nurse | 6 | 15 | 21 | 1,957 | 91 | 99% | 9.5 |
| Clinical Nurse Specialist | 7 | 0 | 7 | 1,244 | 75 | 82% | 7 |
| Speech Language Pathologist | 6 | 0 | 6 | 715 | 74 | 80% | 5.6 |
| Dietitian | 2 | 0 | 2 | 574 | 74 | 80% | 7.8 |
| Other Dietary Services Staff | 2 | 0 | 2 | 543 | 71 | 77% | 7.6 |
| Administrator | 1 | 0 | 1 | 520 | 65 | 71% | 8 |
| Nurse Practitioner | 1 | 0 | 1 | 504 | 63 | 68% | 8 |
| Physical Therapy Assistant | 4 | 0 | 4 | 468 | 79 | 86% | 5.8 |
| Physical Therapy Aide | 4 | 0 | 4 | 455 | 66 | 72% | 5.7 |
| Mental Health Service Worker | 1 | 0 | 1 | 392 | 49 | 53% | 8 |
| Qualified Social Worker | 5 | 0 | 5 | 280 | 76 | 83% | 2.9 |
| Respiratory Therapy Technician | 5 | 0 | 5 | 89 | 28 | 30% | 3.2 |
| Dental Services Staff | 1 | 0 | 1 | 80 | 10 | 11% | 8 |
Federal penalties imposed by CMS for regulatory violations, including civil money penalties (fines) and denials of payment for new Medicare/Medicaid admissions.
Source: CMS Penalties Database
No penalties in the past 3 years
No civil money penalties or payment denials were reported in the last 3 years.
These measures show how residents usually do over time at this home, based on health outcomes and preventive care.
Virginia average: 10.1
Virginia average: 19.7
Virginia average: 16.8%
Virginia average: 19.7%
Virginia average: 22.6%
Virginia average: 3.6%
Virginia average: 5.4%
Virginia average: 1.5%
Virginia average: 5.9%
Virginia average: 14.9%
Virginia average: 12.9%
Virginia average: 91.3%
Virginia average: 94.0%
Virginia average: 1.46
Virginia average: 1.41
Virginia average: 74.9%
Virginia average: 1.2%
Virginia average: 73.6%
Virginia average: 22.0%
Virginia average: 11.7%
Virginia average: 0.8%
Virginia average: 53.7%
Virginia average: 50.6%
Quality measures are calculated from Minimum Data Set (MDS) assessments. For most measures, lower percentages indicate better care quality.
19% of new residents, usually for short-term rehab.
49% of new residents, often for short stays.
32% of new residents, often for long-term daily care.
Source: CMS Long-Term Care Facility Characteristics (Data as of Jan 2026)
Residents meet regularly to discuss policies, care quality, and activities
Organized group of residents that meets regularly to discuss facility policies, quality of life, and activities.
Data sourced from CMS Long-Term Care Facility Characteristics quarterly report. Payer mix reflects the current resident census by primary payment source.
Historical financial and operational data for Carrington Place of Chesapeake from 2011–2023, based on CMS SNF Cost Reports.
Key figures below are for fiscal year ending in 12/2023.
Based on CMS SNF Cost Report for fiscal year ending in 12/2023.
Most residents stay for extended periods and receive ongoing daily care.
New residents most often arrive under private pay (49% of admissions), and a typical private pay stay runs around 1 - 2 months.
Coverage residents most often arrive under.
Coverage residents most often leave under.
![]() 2.8 miles from city center
2.8 miles from city center
![]() Estimated distance in miles from Chesapeake's city center to Carrington Place of Chesapeake's address, calculated via Google Maps.
— 4.1 miles to nearest hospital (Bon Secours Maryview Medical Center)
Estimated distance in miles from Chesapeake's city center to Carrington Place of Chesapeake's address, calculated via Google Maps.
— 4.1 miles to nearest hospital (Bon Secours Maryview Medical Center)
Add your location
The information below is reported by the Virginia Department of Social Services and Department of Health.
| Autumn Care of Chesapeake | NH HOS MC RC SNF | Chesapeake (Greenbrier East) | 117
Facility
117
VA AVG
96
Rank
#98 / 365 |
96.1%
Facility
96.1%
VA AVG
70.5
Rank
#17 / 297 | +36% | 3.41
Facility
3.41
VA AVG
3.74
Rank
#50 / 78 | -24% | -9% | $0
Facility
$0
VA AVG
$54.3k
Rank
#1 / 82 | 43
Facility
43
VA AVG
38.4
Rank
#53 / 77 | 14.3
Facility
14.3
VA AVG
8.9
Rank
#66 / 77 | - | 112 | - |
5
Facility
5
VA AVG
44
Rank
#424 / 446 | Anthony Bonawit | $13.6MFiscal year ending 12/2023
Facility
$13.6MFiscal year ending 12/2023
VA AVG
$18.3M
Rank
#60 / 78 | $6.7MFiscal year ending 12/2023
Facility
$6.7MFiscal year ending 12/2023
VA AVG
$6.9M
Rank
#47 / 78 | 49.1%Fiscal year ending 12/2023
Facility
49.1%Fiscal year ending 12/2023
VA AVG
39.7%
Rank
#5 / 78 | 495256 | ||||
| Carrington Place of Chesapeake | NH | Chesapeake (Deep Creek North) | 120
Facility
120
VA AVG
96
Rank
#87 / 365 |
81.0%
Facility
81.0%
VA AVG
70.5
Rank
#100 / 297 | +15% | 3.45
Facility
3.45
VA AVG
3.74
Rank
#50 / 78 | +7% | -8% | $0
Facility
$0
VA AVG
$54.3k
Rank
#1 / 82 | 58
Facility
58
VA AVG
38.4
Rank
#66 / 77 | 9.7
Facility
9.7
VA AVG
8.9
Rank
#48 / 77 | - | 97 | - |
40
Facility
40
VA AVG
44
Rank
#245 / 446 | - | $8.8MFiscal year ending 12/2023
Facility
$8.8MFiscal year ending 12/2023
VA AVG
$18.3M
Rank
#75 / 78 | $4.3MFiscal year ending 12/2023
Facility
$4.3MFiscal year ending 12/2023
VA AVG
$6.9M
Rank
#74 / 78 | 48.5%Fiscal year ending 12/2023
Facility
48.5%Fiscal year ending 12/2023
VA AVG
39.7%
Rank
#27 / 78 | 495330 | ||||
| Chesapeake Health and Rehabilitation Center | NH SNF | Chesapeake (Greenbrier West) | 180
Facility
180
VA AVG
96
Rank
#23 / 365 |
97.9%
Facility
97.9%
VA AVG
70.5
Rank
#11 / 297 | +39% | 3.02
Facility
3.02
VA AVG
3.74
Rank
#67 / 78 | -33% | -19% | $24.6k
Facility
$24.6k
VA AVG
$54.3k
Rank
#76 / 82 | 50
Facility
50
VA AVG
38.4
Rank
#60 / 77 | 10.0
Facility
10.0
VA AVG
8.9
Rank
#50 / 77 | 5 | 176 | - |
59
Facility
59
VA AVG
44
Rank
#115 / 446 | Chesapeake Holdings I LLC | $24.8MFiscal year ending 06/2024
Facility
$24.8MFiscal year ending 06/2024
VA AVG
$18.3M
Rank
#34 / 78 | $10.0MFiscal year ending 06/2024
Facility
$10.0MFiscal year ending 06/2024
VA AVG
$6.9M
Rank
#32 / 78 | 40.4%Fiscal year ending 06/2024
Facility
40.4%Fiscal year ending 06/2024
VA AVG
39.7%
Rank
#55 / 78 | 495108 |
Carrington Place of Chesapeake is located in Chesapeake, Virginia.
Here are the financial assistance programs available to residents in Virginia.
Carrington Place of Chesapeake is in the Deep Creek North neighborhood.
Carrington Place of Chesapeake has a walk score of 40. Somewhat walkable. A few nearby services may be reachable on foot, but most trips require transportation.
Carrington Place of Chesapeake's occupancy is 72.6%.
No, Carrington Place of Chesapeake has a no-pet policy.
Carrington Place of Chesapeake is registered as a for-profit.
Yes — there is 1 photo of Carrington Place of Chesapeake in the photo gallery on this page.
Carrington Place of Chesapeake is located at 1017 George Washington Hwy N, Chesapeake, VA 23323.
Care Cost Calculator: See Prices in Your Area
Nursing Home Data Explorer
Don’t Wait Too Long: 7 Red Flag Signs Your Parent Needs Assisted Living Now
The True Cost of Assisted Living in 2025 – And How Families Are Paying For It
Understanding Senior Living Costs: Pricing Models, Discounts & Financial Assistance


