


Total staff
206
Employees
116
Contractors
90
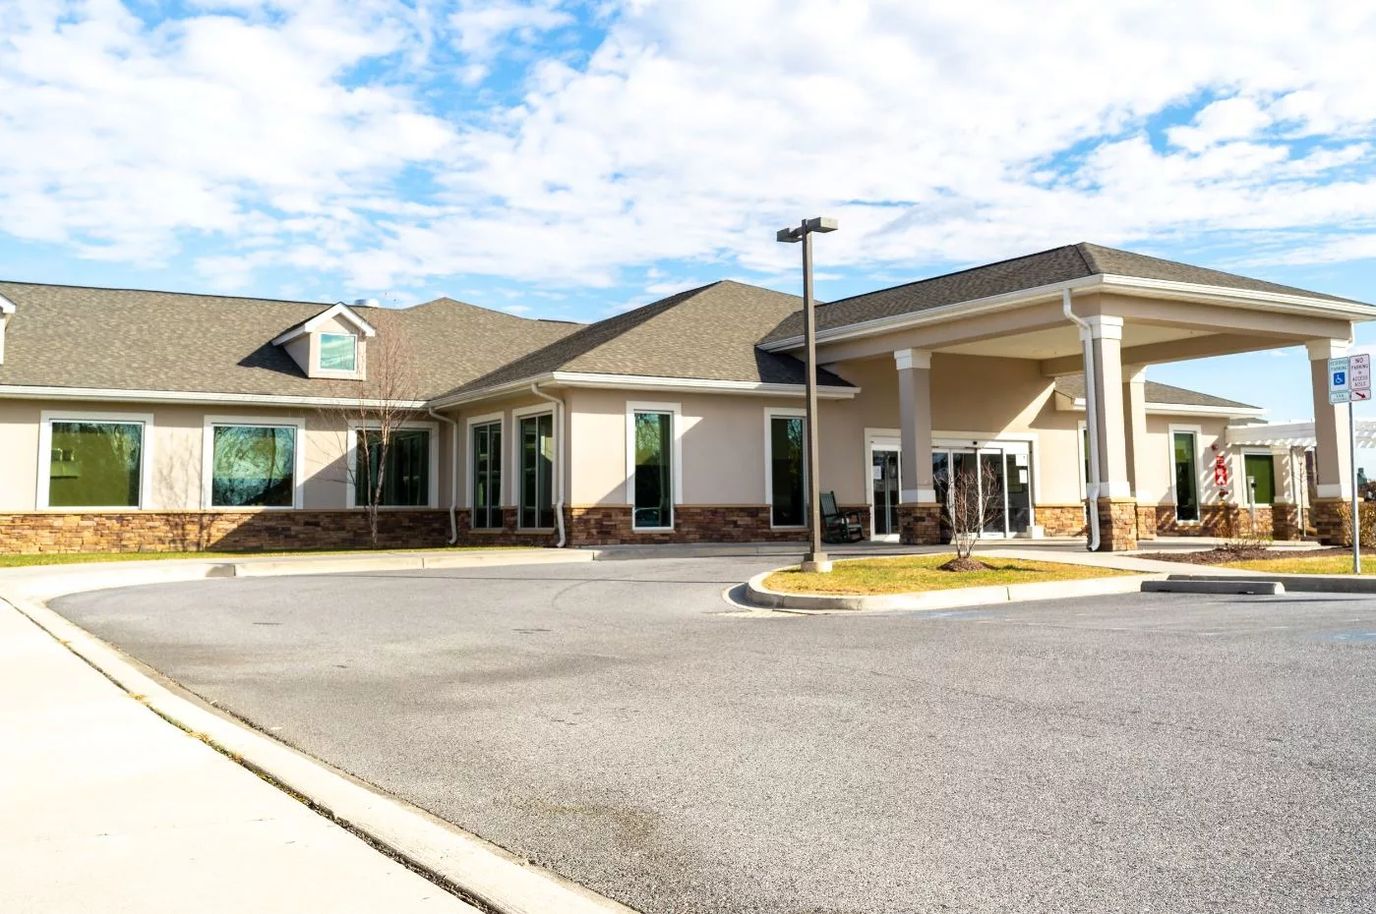
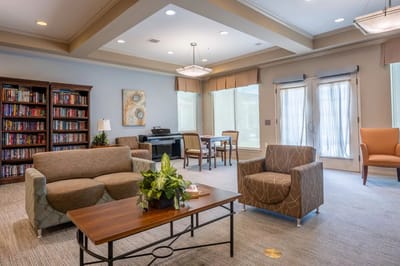
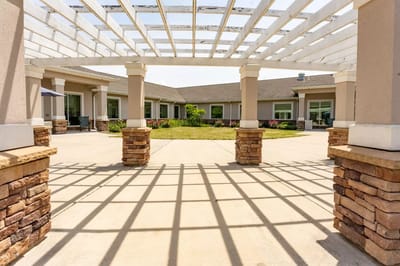
Autumn Lake Healthcare at Ballenger Creek is the perfect nursing home to receive good care. It’s composed of a professional care staff who brings not only excellence to the recovery of every senior; residents can genuinely feel the high- end quality of care in a nurturing environment.
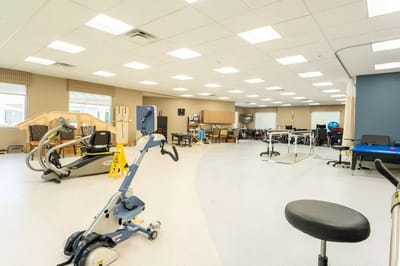
Expect nothing but quality when it comes to their service: an advanced level of recovery found by the support of a psychiatrist, a wound care specialist, and a physiatrist; 24/7 skilled nursing; speech, physical, and occupational therapy; restorative care, bereavement counseling, diabetes management, and track management care.
Autumn Lake Healthcare at Ballenger Creek is an independently owned and operated healthcare center that is licensed to use the Autumn Lake Healthcare name and receive non-healthcare related services. All healthcare-related services are provided solely by Autumn Lake Healthcare at Ballenger Creek.
| Staff type | Hours / Day / Resident | vs state avg |
|---|---|---|
|
Registered Nurse (RN)
| 36m per day | ▼ 29% State avg: 50m per day · National avg: 41m per day |
|
LPN / LVN
| 1h 10m per day | ▲ 29% State avg: 54m per day · National avg: 52m per day |
|
Nurse Aide
| 2h 0m per day | ▼ 7% State avg: 2h 10m per day · National avg: 2h 21m per day |
|
Weekend Total Nursing
| 3h 28m per day | ■ Avg State avg: 3h 29m per day · National avg: 3h 26m per day |
|
Physical Therapist
| 4m per day | ▼ 28% State avg: 5m per day · National avg: 4m per day |
|
Weekend RN
| 26m per day | ▼ 29% State avg: 37m per day · National avg: 29m per day |
Reporting period: October 1 – December 31, 2025 (Q4 2025). Source: CMS Payroll-Based Journal report.
Manages medical care and health needs.
Assists with medical care and medications.
Helps with daily care and mobility.
Total hours from contractors
6,303 contractor hours this quarter
| Certified Nursing Assistant | 63 | 28 | 91 | 21,474 | 92 | 100% | 7.5 |
| Licensed Practical Nurse | 28 | 37 | 65 | 11,988 | 92 | 100% | 8.6 |
| Registered Nurse | 12 | 4 | 16 | 3,611 | 92 | 100% | 7.8 |
| Clinical Nurse Specialist | 5 | 0 | 5 | 2,270 | 72 | 78% | 7.7 |
| Other Dietary Services Staff | 4 | 0 | 4 | 1,656 | 92 | 100% | 7.3 |
| Speech Language Pathologist | 0 | 5 | 5 | 1,441 | 75 | 82% | 7.8 |
| Physical Therapy Aide | 0 | 3 | 3 | 951 | 68 | 74% | 7.7 |
| Physical Therapy Assistant | 0 | 4 | 4 | 922 | 76 | 83% | 7.2 |
| Respiratory Therapy Technician | 0 | 5 | 5 | 637 | 67 | 73% | 5.6 |
| Dental Services Staff | 1 | 0 | 1 | 491 | 57 | 62% | 8.6 |
| Nurse Practitioner | 1 | 0 | 1 | 477 | 62 | 67% | 7.7 |
| RN Director of Nursing | 1 | 0 | 1 | 459 | 59 | 64% | 7.8 |
| Administrator | 1 | 0 | 1 | 418 | 53 | 58% | 7.9 |
| Qualified Social Worker | 0 | 4 | 4 | 170 | 29 | 32% | 5.5 |
Federal penalties imposed by CMS for regulatory violations, including civil money penalties (fines) and denials of payment for new Medicare/Medicaid admissions.
Source: CMS Penalties Database
No penalties in the past 3 years
No civil money penalties or payment denials were reported in the last 3 years.
These measures show how residents usually do over time at this home, based on health outcomes and preventive care.
Maryland average: 12.9
Maryland average: 25.7
Maryland average: 23.7%
Maryland average: 27.7%
Maryland average: 25.9%
Maryland average: 2.3%
Maryland average: 6.5%
Maryland average: 1.6%
Maryland average: 5.8%
Maryland average: 20.2%
Maryland average: 12.9%
Maryland average: 92.0%
Maryland average: 96.6%
Maryland average: 1.32
Maryland average: 1.21
Maryland average: 78.4%
Maryland average: 1.4%
Maryland average: 80.6%
Maryland average: 21.2%
Maryland average: 9.9%
Maryland average: 0.8%
Maryland average: 53.7%
Maryland average: 50.6%
Quality measures are calculated from Minimum Data Set (MDS) assessments. For most measures, lower percentages indicate better care quality.
61% of new residents, usually for short-term rehab.
32% of new residents, often for short stays.
7% of new residents, often for long-term daily care.
Source: CMS Long-Term Care Facility Characteristics (Data as of Jan 2026)
Residents meet regularly to discuss policies, care quality, and activities
State-approved Nurse Aide Training and Competency Evaluation Program on-site
Organized group of residents that meets regularly to discuss facility policies, quality of life, and activities.
Data sourced from CMS Long-Term Care Facility Characteristics quarterly report. Payer mix reflects the current resident census by primary payment source.
Historical financial and operational data for Autumn Lake Healthcare at Ballenger Creek from 2012–2023, based on CMS SNF Cost Reports.
Key figures below are for fiscal year ending in 12/2023.
Based on CMS SNF Cost Report for fiscal year ending in 12/2023.
Most residents typically stay for a few weeks or months before returning home or moving on.
Most new residents arrive under Medicare (61% of admissions), and a typical Medicare stay runs around 1 - 2 months.
Coverage residents most often arrive under.
Coverage residents most often leave under.
![]() 1.6 miles from city center
1.6 miles from city center
![]() Estimated distance in miles from Frederick's city center to Autumn Lake Healthcare at Ballenger Creek's address, calculated via Google Maps.
— 14.21 miles to nearest hospital (Frederick Health Mt Airy)
Estimated distance in miles from Frederick's city center to Autumn Lake Healthcare at Ballenger Creek's address, calculated via Google Maps.
— 14.21 miles to nearest hospital (Frederick Health Mt Airy)
Add your location
The information below is reported by the Maryland Department of Health, Office of Health Care Quality.
| Homewood Living Frederick | NH AL IL MC SNF | Frederick | 120
Facility
120
MD AVG
43
Rank
#76 / 690 |
69.0%
Facility
69.0%
MD AVG
80.8
Rank
#85 / 104 | -15% | 4.25
Facility
4.25
MD AVG
3.77
Rank
#26 / 143 | +3% | +13% | $0
Facility
$0
MD AVG
$65.0k
Rank
#1 / 145 | 19
Facility
19
MD AVG
49.9
Rank
#12 / 145 | 6.3
Facility
6.3
MD AVG
12.8
Rank
#12 / 145 | - | 83 | - |
14
Facility
14
MD AVG
43
Rank
#788 / 985 | Phillip Bowers | $21.8MFiscal year ending 12/2023
Facility
$21.8MFiscal year ending 12/2023
MD AVG
$18.7M
Rank
#10 / 144 | $15.3MFiscal year ending 12/2023
Facility
$15.3MFiscal year ending 12/2023
MD AVG
$6.5M
Rank
#14 / 144 | 70.1%Fiscal year ending 12/2023
Facility
70.1%Fiscal year ending 12/2023
MD AVG
38.5%
Rank
#119 / 144 | 215245 | ||||
| Buckingham‘s Choice | NH AL MC RC SNF | Adamstown (Baker Circle) | 42
Facility
42
MD AVG
43
Rank
#230 / 690 |
60.0%
Facility
60.0%
MD AVG
80.8
Rank
#92 / 104 | -26% | 4.73
Facility
4.73
MD AVG
3.77
Rank
#18 / 143 | +64% | +25% | $0
Facility
$0
MD AVG
$65.0k
Rank
#1 / 145 | 29
Facility
29
MD AVG
49.9
Rank
#28 / 145 | 9.7
Facility
9.7
MD AVG
12.8
Rank
#55 / 145 | - | 25 | - |
3
Facility
3
MD AVG
43
Rank
#930 / 985 | - | $19.9MFiscal year ending 12/2023
Facility
$19.9MFiscal year ending 12/2023
MD AVG
$18.7M
Rank
#55 / 144 | $9.9MFiscal year ending 12/2023
Facility
$9.9MFiscal year ending 12/2023
MD AVG
$6.5M
Rank
#50 / 144 | 49.5%Fiscal year ending 12/2023
Facility
49.5%Fiscal year ending 12/2023
MD AVG
38.5%
Rank
#73 / 144 | 215329 | ||||
| Autumn Lake Healthcare at Braddock Heights | NH HOS RC SNF | Frederick (Braddock Estates) | 65
Facility
65
MD AVG
43
Rank
#197 / 690 |
84.6%
Facility
84.6%
MD AVG
80.8
Rank
#65 / 104 | +5% | 3.10
Facility
3.10
MD AVG
3.77
Rank
#119 / 143 | -24% | -18% | $0
Facility
$0
MD AVG
$65.0k
Rank
#1 / 145 | 54
Facility
54
MD AVG
49.9
Rank
#95 / 145 | 18.0
Facility
18.0
MD AVG
12.8
Rank
#123 / 145 | - | 55 | - |
0
Facility
0
MD AVG
43
Rank
#959 / 985 | As Family Vb Holdings LLC | $7.1MFiscal year ending 12/2023
Facility
$7.1MFiscal year ending 12/2023
MD AVG
$18.7M
Rank
#140 / 144 | $1.2MFiscal year ending 12/2023
Facility
$1.2MFiscal year ending 12/2023
MD AVG
$6.5M
Rank
#135 / 144 | 16.8%Fiscal year ending 12/2023
Facility
16.8%Fiscal year ending 12/2023
MD AVG
38.5%
Rank
#17 / 144 | 215199 | ||||
| Citizens Nursing Home | NH HOS MC RC SNF | Frederick (Rosemont Avenue) | 170
Facility
170
MD AVG
43
Rank
#23 / 690 |
93.5%
Facility
93.5%
MD AVG
80.8
Rank
#20 / 104 | +16% | 3.31
Facility
3.31
MD AVG
3.77
Rank
#91 / 143 | -21% | -12% | $0
Facility
$0
MD AVG
$65.0k
Rank
#1 / 145 | 41
Facility
41
MD AVG
49.9
Rank
#71 / 145 | 10.3
Facility
10.3
MD AVG
12.8
Rank
#59 / 145 | 1 | 159 | - |
41
Facility
41
MD AVG
43
Rank
#508 / 985 | Frederick County Maryland | $25.8MFiscal year ending 06/2024
Facility
$25.8MFiscal year ending 06/2024
MD AVG
$18.7M
Rank
#28 / 144 | $14.1MFiscal year ending 06/2024
Facility
$14.1MFiscal year ending 06/2024
MD AVG
$6.5M
Rank
#23 / 144 | 54.6%Fiscal year ending 06/2024
Facility
54.6%Fiscal year ending 06/2024
MD AVG
38.5%
Rank
#58 / 144 | 215105 | ||||
| Autumn Lake Healthcare at Ballenger Creek | NH SNF | Frederick (Ballenger Creek Center) | 130
Facility
130
MD AVG
43
Rank
#63 / 690 |
89.5%
Facility
89.5%
MD AVG
80.8
Rank
#45 / 104 | +11% | 3.16
Facility
3.16
MD AVG
3.77
Rank
#104 / 143 | -43% | -16% | $0
Facility
$0
MD AVG
$65.0k
Rank
#1 / 145 | 59
Facility
59
MD AVG
49.9
Rank
#104 / 145 | 19.7
Facility
19.7
MD AVG
12.8
Rank
#127 / 145 | 2 | 116 | - |
36
Facility
36
MD AVG
43
Rank
#563 / 985 | 347 Ballenger Holdco LLC | $19.4MFiscal year ending 12/2023
Facility
$19.4MFiscal year ending 12/2023
MD AVG
$18.7M
Rank
#62 / 144 | $1.4MFiscal year ending 12/2023
Facility
$1.4MFiscal year ending 12/2023
MD AVG
$6.5M
Rank
#73 / 144 | 7.4%Fiscal year ending 12/2023
Facility
7.4%Fiscal year ending 12/2023
MD AVG
38.5%
Rank
#108 / 144 | 215001 |
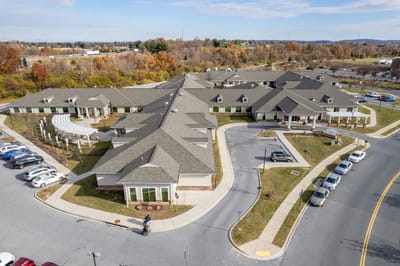
Autumn Lake Healthcare at Ballenger Creek is located in Frederick, Maryland.
Here are the financial assistance programs available to residents in Maryland.
Autumn Lake Healthcare at Ballenger Creek is in the Ballenger Creek Center neighborhood.
Autumn Lake Healthcare at Ballenger Creek has a walk score of 36. Somewhat walkable. A few nearby services may be reachable on foot, but most trips require transportation.
Autumn Lake Healthcare at Ballenger Creek's occupancy is 87.8%.
Autumn Lake Healthcare at Ballenger Creek is registered as a for-profit.
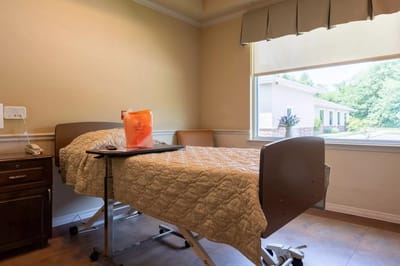
Yes — there are 6 photos of Autumn Lake Healthcare at Ballenger Creek in the photo gallery on this page.
Autumn Lake Healthcare at Ballenger Creek is located at 347 Ballenger Center Dr, Frederick, MD 21703.
(301) 663-5181 will put you in contact with the team at Autumn Lake Healthcare at Ballenger Creek.
Care Cost Calculator: See Prices in Your Area
Nursing Home Data Explorer
Don’t Wait Too Long: 7 Red Flag Signs Your Parent Needs Assisted Living Now
The True Cost of Assisted Living in 2025 – And How Families Are Paying For It
Understanding Senior Living Costs: Pricing Models, Discounts & Financial Assistance


