


Total staff
127
Employees
111
Contractors
16
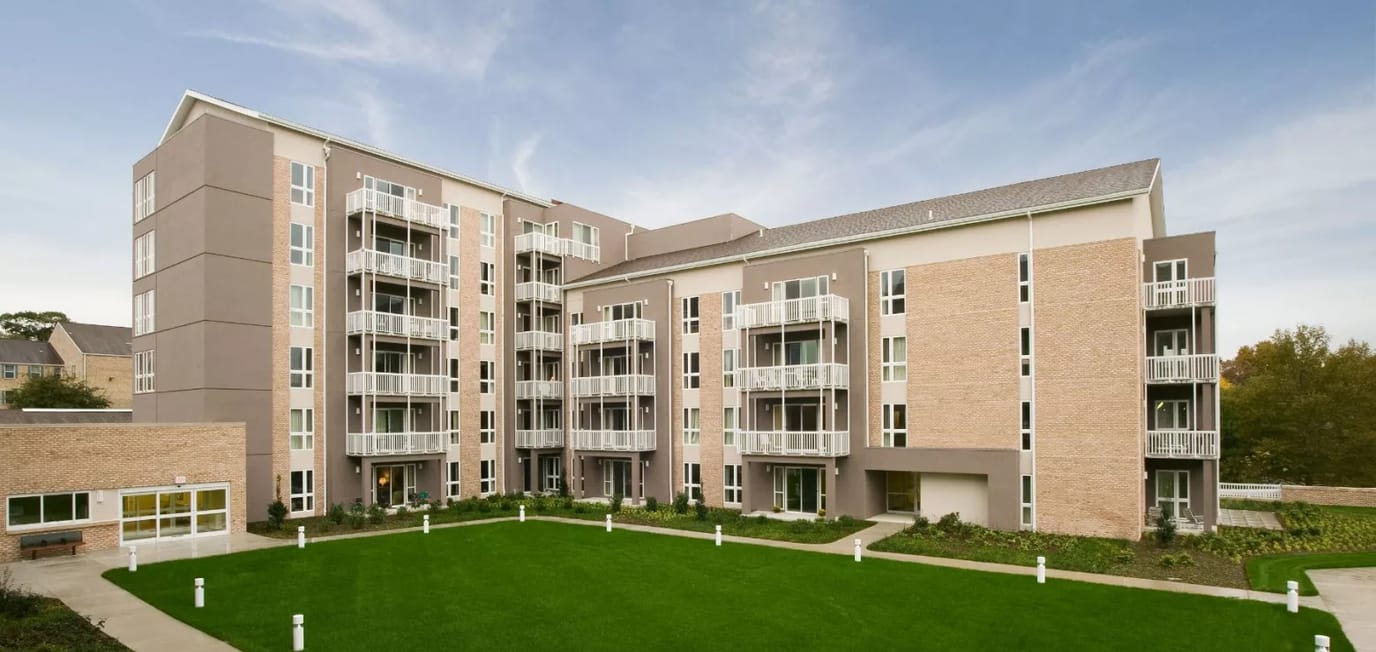
A home where robust historical surroundings meet quality senior care, Autumn Lake Healthcare at Birch Manor in Sykesville celebrates each unique individual with respect and professionalism. The premier nursing home combines state-of-the-art technologies with highly-trained care staff, providing residents with a hassle-free and peaceful healing period.
Undoubtedly, Autumn Lake at Birch Manor is where many choose to relax and recover in a good place for a good time. The person-centered services offer comprehensive programs that successfully care for even challenging medical conditions. With an emphasis on short-term and long-term care, seniors receive professional care in therapy (speech, occupational, physical), orthopedic care, wound care, trach management, pain management, stroke recovery, diabetes management, memory care, and podiatry care– among many others.
Autumn Lake Healthcare at Birch Manor is an independently owned and operated healthcare center that is licensed to use the Autumn Lake Healthcare name and receive non-healthcare related services. All healthcare-related services are provided solely by Autumn Lake Healthcare at Birch Manor.
| Staff type | Hours / Day / Resident | vs state avg |
|---|---|---|
|
Registered Nurse (RN)
| 28m per day | ▼ 44% State avg: 50m per day · National avg: 41m per day |
|
LPN / LVN
| 1h 5m per day | ▲ 20% State avg: 54m per day · National avg: 52m per day |
|
Nurse Aide
| 1h 55m per day | ▼ 12% State avg: 2h 10m per day · National avg: 2h 21m per day |
|
Weekend Total Nursing
| 3h 6m per day | ▼ 11% State avg: 3h 29m per day · National avg: 3h 26m per day |
|
Physical Therapist
| 3m per day | ▼ 45% State avg: 5m per day · National avg: 4m per day |
|
Weekend RN
| 21m per day | ▼ 44% State avg: 37m per day · National avg: 29m per day |
Reporting period: October 1 – December 31, 2025 (Q4 2025). Source: CMS Payroll-Based Journal report.
Manages medical care and health needs.
Assists with medical care and medications.
Helps with daily care and mobility.
Total hours from contractors
2,188 contractor hours this quarter
| Certified Nursing Assistant | 50 | 0 | 50 | 18,953 | 92 | 100% | 7.5 |
| Licensed Practical Nurse | 24 | 0 | 24 | 9,718 | 92 | 100% | 7.8 |
| Physical Therapist | 10 | 0 | 10 | 3,697 | 92 | 100% | 7 |
| Registered Nurse | 13 | 0 | 13 | 3,284 | 92 | 100% | 7.9 |
| RN Director of Nursing | 2 | 0 | 2 | 968 | 66 | 72% | 7.5 |
| Physical Therapy Assistant | 0 | 6 | 6 | 944 | 69 | 75% | 7.5 |
| Clinical Nurse Specialist | 2 | 0 | 2 | 923 | 63 | 68% | 8.4 |
| Mental Health Service Worker | 2 | 0 | 2 | 879 | 64 | 70% | 7.7 |
| Speech Language Pathologist | 0 | 2 | 2 | 596 | 63 | 68% | 6.3 |
| Dental Services Staff | 1 | 0 | 1 | 475 | 63 | 68% | 7.5 |
| Administrator | 1 | 0 | 1 | 465 | 62 | 67% | 7.5 |
| Respiratory Therapy Technician | 0 | 3 | 3 | 453 | 65 | 71% | 7 |
| Qualified Activities Professional | 1 | 0 | 1 | 447 | 60 | 65% | 7.4 |
| Dietitian | 1 | 0 | 1 | 444 | 61 | 66% | 7.3 |
| Nurse Practitioner | 1 | 0 | 1 | 443 | 59 | 64% | 7.5 |
| Other Dietary Services Staff | 2 | 0 | 2 | 375 | 52 | 57% | 7.2 |
| Qualified Social Worker | 0 | 2 | 2 | 140 | 39 | 42% | 3.6 |
| Occupational Therapy Aide | 1 | 0 | 1 | 76 | 51 | 55% | 1.5 |
| Physical Therapy Aide | 0 | 3 | 3 | 56 | 12 | 13% | 3.5 |
Federal penalties imposed by CMS for regulatory violations, including civil money penalties (fines) and denials of payment for new Medicare/Medicaid admissions.
Source: CMS Penalties Database
No penalties in the past 3 years
No civil money penalties or payment denials were reported in the last 3 years.
These measures show how residents usually do over time at this home, based on health outcomes and preventive care.
Maryland average: 12.9
Maryland average: 25.7
Maryland average: 23.7%
Maryland average: 27.7%
Maryland average: 25.9%
Maryland average: 2.3%
Maryland average: 6.5%
Maryland average: 1.6%
Maryland average: 5.8%
Maryland average: 20.2%
Maryland average: 12.9%
Maryland average: 92.0%
Maryland average: 96.6%
Maryland average: 1.32
Maryland average: 1.21
Maryland average: 78.4%
Maryland average: 1.4%
Maryland average: 80.6%
Maryland average: 21.2%
Maryland average: 9.9%
Maryland average: 0.8%
Maryland average: 53.7%
Maryland average: 50.6%
Quality measures are calculated from Minimum Data Set (MDS) assessments. For most measures, lower percentages indicate better care quality.
50% of new residents, usually for short-term rehab.
26% of new residents, often for short stays.
24% of new residents, often for long-term daily care.
Source: CMS Long-Term Care Facility Characteristics (Data as of Jan 2026)
Residents meet regularly to discuss policies, care quality, and activities
Organized group of residents that meets regularly to discuss facility policies, quality of life, and activities.
Data sourced from CMS Long-Term Care Facility Characteristics quarterly report. Payer mix reflects the current resident census by primary payment source.
Historical financial and operational data for Autumn Lake Healthcare at Birch Manor from 2012–2023, based on CMS SNF Cost Reports.
Key figures below are for fiscal year ending in 12/2023.
Based on CMS SNF Cost Report for fiscal year ending in 12/2023.
Most residents typically stay for a few weeks or months before returning home or moving on.
Most new residents arrive under Medicare (50% of admissions), and a typical Medicare stay runs around 1 months.
Coverage residents most often arrive under.
Coverage residents most often leave under.
![]() 0.2 miles from city center
0.2 miles from city center
![]() Estimated distance in miles from Sykesville's city center to Autumn Lake Healthcare at Birch Manor's address, calculated via Google Maps.
Estimated distance in miles from Sykesville's city center to Autumn Lake Healthcare at Birch Manor's address, calculated via Google Maps.
Add your location
The information below is reported by the Maryland Department of Health, Office of Health Care Quality.
| Autumn Lake Healthcare at Long View | NH PC SNF | Westminster (Main Street) | 109
Facility
109
MD AVG
43
Rank
#99 / 690 |
90.9%
Facility
90.9%
MD AVG
80.8
Rank
#38 / 104 | +12% | 3.64
Facility
3.64
MD AVG
3.77
Rank
#63 / 143 | -65% | -4% | $0
Facility
$0
MD AVG
$65.0k
Rank
#1 / 145 | 28
Facility
28
MD AVG
49.9
Rank
#27 / 145 | 7.0
Facility
7.0
MD AVG
12.8
Rank
#19 / 145 | - | 99 | A+ |
54
Facility
54
MD AVG
43
Rank
#380 / 985 | 3332 Main Street Holdco LLC | $15.6MFiscal year ending 12/2023
Facility
$15.6MFiscal year ending 12/2023
MD AVG
$18.7M
Rank
#88 / 144 | $2.4MFiscal year ending 12/2023
Facility
$2.4MFiscal year ending 12/2023
MD AVG
$6.5M
Rank
#62 / 144 | 15.7%Fiscal year ending 12/2023
Facility
15.7%Fiscal year ending 12/2023
MD AVG
38.5%
Rank
#22 / 144 | 215017 | ||||
| Autumn Lake Healthcare at Birch Manor | NH PC RC SNF | Sykesville (Hawk Ridge) | 118
Facility
118
MD AVG
43
Rank
#83 / 690 |
91.3%
Facility
91.3%
MD AVG
80.8
Rank
#35 / 104 | +13% | 3.40
Facility
3.40
MD AVG
3.77
Rank
#80 / 143 | -26% | -10% | $0
Facility
$0
MD AVG
$65.0k
Rank
#1 / 145 | 84
Facility
84
MD AVG
49.9
Rank
#132 / 145 | 21.0
Facility
21.0
MD AVG
12.8
Rank
#132 / 145 | - | 108 | - |
41
Facility
41
MD AVG
43
Rank
#508 / 985 | 7309 Second Avenue Opco LLC | $14.9MFiscal year ending 12/2023
Facility
$14.9MFiscal year ending 12/2023
MD AVG
$18.7M
Rank
#98 / 144 | $2.1MFiscal year ending 12/2023
Facility
$2.1MFiscal year ending 12/2023
MD AVG
$6.5M
Rank
#78 / 144 | 14.2%Fiscal year ending 12/2023
Facility
14.2%Fiscal year ending 12/2023
MD AVG
38.5%
Rank
#33 / 144 | 215136 | ||||
| Westminster Healthcare Center | NH AL MC | Westminster (Washington Road) | 170
Facility
170
MD AVG
43
Rank
#23 / 690 |
65.9%
Facility
65.9%
MD AVG
80.8
Rank
#88 / 104 | -18% | 3.82
Facility
3.82
MD AVG
3.77
Rank
#47 / 143 | +69% | +1% | $63.7k
Facility
$63.7k
MD AVG
$65.0k
Rank
#134 / 145 | 68
Facility
68
MD AVG
49.9
Rank
#118 / 145 | 13.6
Facility
13.6
MD AVG
12.8
Rank
#94 / 145 | 1 | 112 | - |
12
Facility
12
MD AVG
43
Rank
#802 / 985 | - | $15.1MFiscal year ending 06/2024
Facility
$15.1MFiscal year ending 06/2024
MD AVG
$18.7M
Rank
#91 / 144 | $7.7MFiscal year ending 06/2024
Facility
$7.7MFiscal year ending 06/2024
MD AVG
$6.5M
Rank
#66 / 144 | 51.1%Fiscal year ending 06/2024
Facility
51.1%Fiscal year ending 06/2024
MD AVG
38.5%
Rank
#26 / 144 | 215094 |
Autumn Lake Healthcare at Birch Manor is located in Sykesville, Maryland.
Here are the financial assistance programs available to residents in Maryland.
Autumn Lake Healthcare at Birch Manor is in the Hawk Ridge neighborhood of Sykesville.
Autumn Lake Healthcare at Birch Manor has a walk score of 41. Somewhat walkable. A few nearby services may be reachable on foot, but most trips require transportation.
Autumn Lake Healthcare at Birch Manor's occupancy is 87.1%.
Autumn Lake Healthcare at Birch Manor is registered as a for-profit in MD.
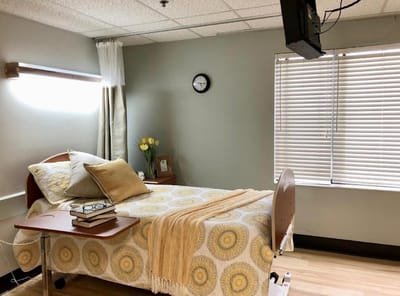
Yes — there are 2 photos of Autumn Lake Healthcare at Birch Manor in the photo gallery on this page.
Autumn Lake Healthcare at Birch Manor is located at 7309 2Nd Ave, Sykesville, MD 21784.
(410) 795-1100 will put you in contact with the team at Autumn Lake Healthcare at Birch Manor.
Care Cost Calculator: See Prices in Your Area
Nursing Home Data Explorer
Don’t Wait Too Long: 7 Red Flag Signs Your Parent Needs Assisted Living Now
The True Cost of Assisted Living in 2025 – And How Families Are Paying For It
Understanding Senior Living Costs: Pricing Models, Discounts & Financial Assistance


