


Total staff
272
Employees
99
Contractors
173
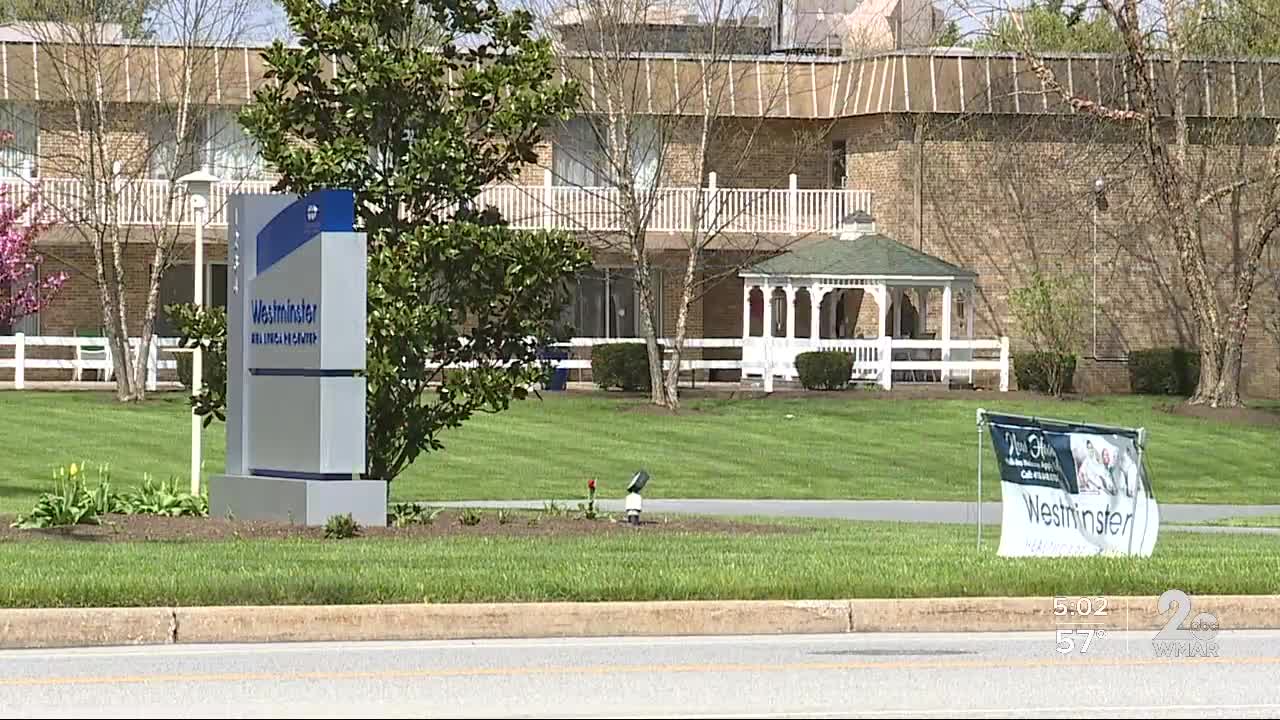

Located on Washington Road in Westminster, Maryland, Westminster Healthcare Center is a skilled nursing and rehabilitation community with 170 beds, making it one of the larger care providers in the area. The community accepts Medicare, Medicaid, and private pay, and its average resident stay of approximately 152 days reflects a blend of short-term rehabilitation and long-term skilled nursing care.
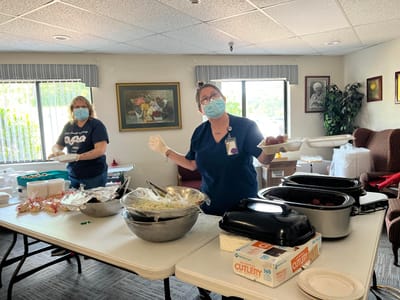
In addition to comprehensive nursing services, residents have access to physical, occupational, and speech therapy. Specialized care includes wound management, hospice, and palliative services, while respite care and home care options provide added flexibility for older adults and their families during periods of recovery or changing care needs.
Furthermore, residents receive an average of 3 hours and 49 minutes of nursing care each day. This includes approximately 53 minutes from registered nurses, 44 minutes from LPN/LVNs, and 1 hour and 59 minutes from nurse aides, creating a balance between clinical oversight and direct personal assistance.
Although the surrounding neighborhood has a Walk Score of 12 and is primarily car-dependent, the community offers amenities that support comfort and wellness, including a spa, garden, and patio areas, laundry services, and wellness programs.
| Staff type | Hours / Day / Resident | vs state avg |
|---|---|---|
|
Registered Nurse (RN)
| 53m per day | ▲ 5% State avg: 50m per day · National avg: 41m per day |
|
LPN / LVN
| 44m per day | ▼ 19% State avg: 54m per day · National avg: 52m per day |
|
Nurse Aide
| 1h 59m per day | ▼ 8% State avg: 2h 10m per day · National avg: 2h 21m per day |
|
Weekend Total Nursing
| 3h 12m per day | ▼ 8% State avg: 3h 29m per day · National avg: 3h 26m per day |
|
Physical Therapist
| 3m per day | ▼ 41% State avg: 5m per day · National avg: 4m per day |
|
Weekend RN
| 35m per day | ▼ 4% State avg: 37m per day · National avg: 29m per day |
Reporting period: October 1 – December 31, 2025 (Q4 2025). Source: CMS Payroll-Based Journal report.
Manages medical care and health needs.
Assists with medical care and medications.
Helps with daily care and mobility.
Total hours from contractors
7,920 contractor hours this quarter
| Certified Nursing Assistant | 45 | 92 | 137 | 19,897 | 92 | 100% | 8.4 |
| Licensed Practical Nurse | 21 | 6 | 27 | 7,530 | 92 | 100% | 8.7 |
| Registered Nurse | 16 | 47 | 63 | 7,134 | 92 | 100% | 7.8 |
| Clinical Nurse Specialist | 5 | 0 | 5 | 1,413 | 79 | 86% | 7.5 |
| Speech Language Pathologist | 0 | 6 | 6 | 999 | 71 | 77% | 7.3 |
| Physical Therapy Aide | 0 | 6 | 6 | 779 | 69 | 75% | 5.9 |
| Other Dietary Services Staff | 3 | 0 | 3 | 750 | 81 | 88% | 7.1 |
| Medication Aide/Technician | 1 | 0 | 1 | 563 | 60 | 65% | 9.4 |
| Mental Health Service Worker | 1 | 0 | 1 | 520 | 65 | 71% | 8 |
| Nurse Practitioner | 1 | 0 | 1 | 512 | 64 | 70% | 8 |
| Respiratory Therapy Technician | 0 | 4 | 4 | 509 | 66 | 72% | 6.8 |
| Occupational Therapy Aide | 1 | 0 | 1 | 489 | 62 | 67% | 7.9 |
| Dietitian | 1 | 0 | 1 | 456 | 57 | 62% | 8 |
| Administrator | 2 | 0 | 2 | 440 | 55 | 60% | 8 |
| Qualified Social Worker | 0 | 6 | 6 | 428 | 66 | 72% | 6.3 |
| Physical Therapy Assistant | 0 | 4 | 4 | 204 | 64 | 70% | 3.2 |
| Occupational Therapy Assistant | 1 | 0 | 1 | 48 | 12 | 13% | 4 |
| Dental Services Staff | 1 | 0 | 1 | 41 | 8 | 9% | 5.1 |
| Medical Director | 0 | 1 | 1 | 27 | 10 | 11% | 2.7 |
| Qualified Activities Professional | 0 | 1 | 1 | 10 | 5 | 5% | 2 |
Includes penalties issued in 2024-2025
Federal penalties imposed by CMS for regulatory violations, including civil money penalties (fines) and denials of payment for new Medicare/Medicaid admissions.
Source: CMS Penalties Database (Data as of Jan 2026)
Maryland average: $61K
Maryland average: 1.5
Maryland average: 0.1
Penalties are imposed by CMS for violations of federal nursing home regulations.
2 penalties in the past 3 years
Multiple penalties were reported in the last 3 years.
Last updated: Jan 2026
These measures show how residents usually do over time at this home, based on health outcomes and preventive care.
Maryland average: 12.9
Maryland average: 25.7
Maryland average: 23.7%
Maryland average: 27.7%
Maryland average: 25.9%
Maryland average: 2.3%
Maryland average: 6.5%
Maryland average: 1.6%
Maryland average: 5.8%
Maryland average: 20.2%
Maryland average: 12.9%
Maryland average: 92.0%
Maryland average: 96.6%
Maryland average: 1.32
Maryland average: 1.21
Maryland average: 78.4%
Maryland average: 1.4%
Maryland average: 80.6%
Maryland average: 21.2%
Maryland average: 9.9%
Maryland average: 0.8%
Maryland average: 53.7%
Maryland average: 50.6%
Quality measures are calculated from Minimum Data Set (MDS) assessments. For most measures, lower percentages indicate better care quality.
33% of new residents, usually for short-term rehab.
32% of new residents, often for short stays.
34% of new residents, often for long-term daily care.
Source: CMS Long-Term Care Facility Characteristics (Data as of Jan 2026)
Residents meet regularly to discuss policies, care quality, and activities
Organized group of residents that meets regularly to discuss facility policies, quality of life, and activities.
Data sourced from CMS Long-Term Care Facility Characteristics quarterly report. Payer mix reflects the current resident census by primary payment source.
Historical financial and operational data for Westminster Healthcare Center from 2011–2024, based on CMS SNF Cost Reports.
Key figures below are for fiscal year ending in 06/2024.
Based on CMS SNF Cost Report for fiscal year ending in 06/2024.
Most residents stay for extended periods and receive ongoing daily care.
New residents most often arrive under Medicaid (34% of admissions), and a typical Medicaid stay runs around 1 years.
Coverage residents most often arrive under.
Coverage residents most often leave under.
![]() 2.8 miles from city center
2.8 miles from city center
![]() Estimated distance in miles from Westminster's city center to Westminster Healthcare Center's address, calculated via Google Maps.
— 1.21 miles to nearest hospital (Carroll Hospital Center)
Estimated distance in miles from Westminster's city center to Westminster Healthcare Center's address, calculated via Google Maps.
— 1.21 miles to nearest hospital (Carroll Hospital Center)
Add your location
The information below is reported by the Maryland Department of Health, Office of Health Care Quality.
| Autumn Lake Healthcare at Long View | NH PC SNF | Westminster (Main Street) | 109
Facility
109
MD AVG
43
Rank
#99 / 690 |
90.9%
Facility
90.9%
MD AVG
80.8
Rank
#38 / 104 | +12% | 3.64
Facility
3.64
MD AVG
3.77
Rank
#63 / 143 | -65% | -4% | $0
Facility
$0
MD AVG
$65.0k
Rank
#1 / 145 | 28
Facility
28
MD AVG
49.9
Rank
#27 / 145 | 7.0
Facility
7.0
MD AVG
12.8
Rank
#19 / 145 | - | 99 | A+ |
54
Facility
54
MD AVG
43
Rank
#380 / 985 | 3332 Main Street Holdco LLC | $15.6MFiscal year ending 12/2023
Facility
$15.6MFiscal year ending 12/2023
MD AVG
$18.7M
Rank
#88 / 144 | $2.4MFiscal year ending 12/2023
Facility
$2.4MFiscal year ending 12/2023
MD AVG
$6.5M
Rank
#62 / 144 | 15.7%Fiscal year ending 12/2023
Facility
15.7%Fiscal year ending 12/2023
MD AVG
38.5%
Rank
#22 / 144 | 215017 | ||||
| Autumn Lake Healthcare at Birch Manor | NH PC RC SNF | Sykesville (Hawk Ridge) | 118
Facility
118
MD AVG
43
Rank
#83 / 690 |
91.3%
Facility
91.3%
MD AVG
80.8
Rank
#35 / 104 | +13% | 3.40
Facility
3.40
MD AVG
3.77
Rank
#80 / 143 | -26% | -10% | $0
Facility
$0
MD AVG
$65.0k
Rank
#1 / 145 | 84
Facility
84
MD AVG
49.9
Rank
#132 / 145 | 21.0
Facility
21.0
MD AVG
12.8
Rank
#132 / 145 | - | 108 | - |
41
Facility
41
MD AVG
43
Rank
#508 / 985 | 7309 Second Avenue Opco LLC | $14.9MFiscal year ending 12/2023
Facility
$14.9MFiscal year ending 12/2023
MD AVG
$18.7M
Rank
#98 / 144 | $2.1MFiscal year ending 12/2023
Facility
$2.1MFiscal year ending 12/2023
MD AVG
$6.5M
Rank
#78 / 144 | 14.2%Fiscal year ending 12/2023
Facility
14.2%Fiscal year ending 12/2023
MD AVG
38.5%
Rank
#33 / 144 | 215136 | ||||
| Westminster Healthcare Center | NH AL MC | Westminster (Washington Road) | 170
Facility
170
MD AVG
43
Rank
#23 / 690 |
65.9%
Facility
65.9%
MD AVG
80.8
Rank
#88 / 104 | -18% | 3.82
Facility
3.82
MD AVG
3.77
Rank
#47 / 143 | +69% | +1% | $63.7k
Facility
$63.7k
MD AVG
$65.0k
Rank
#134 / 145 | 68
Facility
68
MD AVG
49.9
Rank
#118 / 145 | 13.6
Facility
13.6
MD AVG
12.8
Rank
#94 / 145 | 1 | 112 | - |
12
Facility
12
MD AVG
43
Rank
#802 / 985 | - | $15.1MFiscal year ending 06/2024
Facility
$15.1MFiscal year ending 06/2024
MD AVG
$18.7M
Rank
#91 / 144 | $7.7MFiscal year ending 06/2024
Facility
$7.7MFiscal year ending 06/2024
MD AVG
$6.5M
Rank
#66 / 144 | 51.1%Fiscal year ending 06/2024
Facility
51.1%Fiscal year ending 06/2024
MD AVG
38.5%
Rank
#26 / 144 | 215094 |
Westminster Healthcare Center is located in Westminster, Maryland.
Here are the financial assistance programs available to residents in Maryland.
Westminster Healthcare Center is in the Washington Road neighborhood.
Westminster Healthcare Center has a walk score of 12. Car-dependent. Most errands require a car, with limited nearby walkable options.
Westminster Healthcare Center's occupancy is 70.5%.
Westminster Healthcare Center is registered as a for-profit.
Yes — there are 3 photos of Westminster Healthcare Center in the photo gallery on this page.
Westminster Healthcare Center is located at 1234 Washington Rd, Westminster, MD 21157.
(410) 848-0700 will put you in contact with the team at Westminster Healthcare Center.
Care Cost Calculator: See Prices in Your Area
Nursing Home Data Explorer
Don’t Wait Too Long: 7 Red Flag Signs Your Parent Needs Assisted Living Now
The True Cost of Assisted Living in 2025 – And How Families Are Paying For It
Understanding Senior Living Costs: Pricing Models, Discounts & Financial Assistance


