


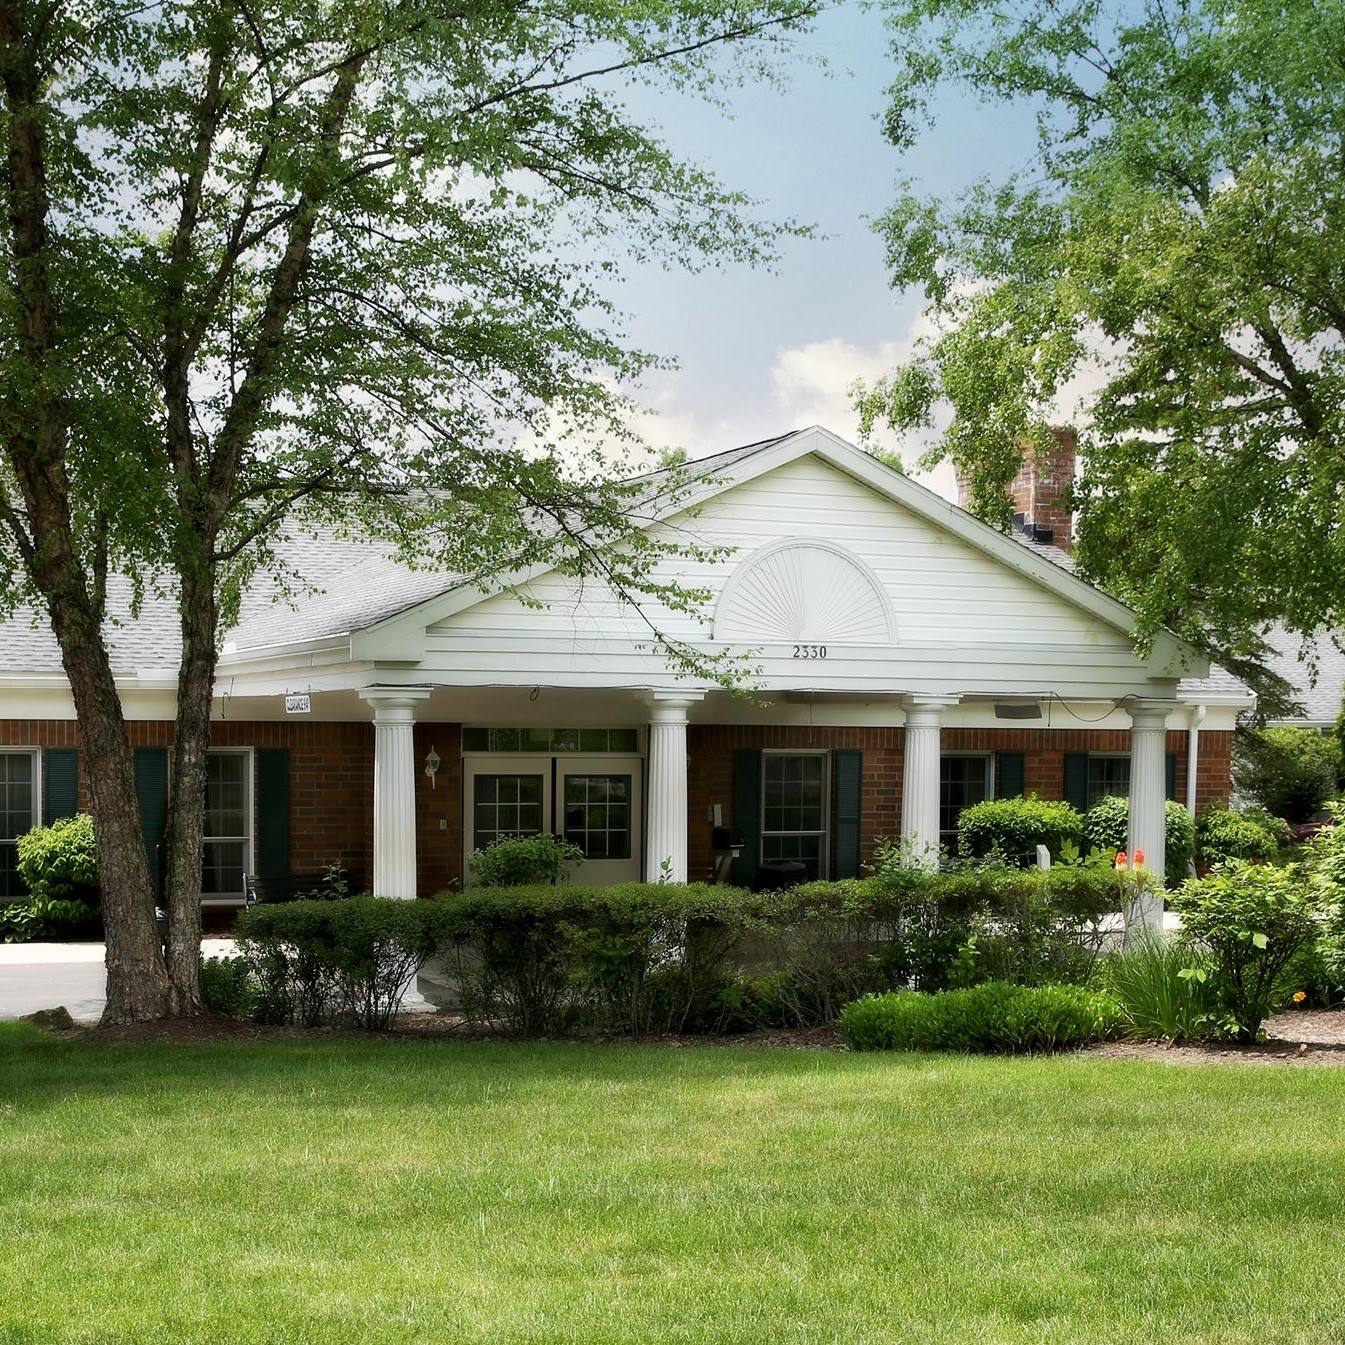
Bath Manor Special Care Centre
Nursing Home, Hospice Care, Memory Care, Respite Care & Skilled Nursing · Akron, OH
CMS overall rating Info CMS (the Centers for Medicare & Medicaid Services) is the federal agency that rates nursing home quality. Its Overall Rating runs from 1 to 5 stars, combining health inspections, staffing, and quality measures, with inspections weighted most heavily.

Bath Manor Special Care Centre

Nursing Home, Hospice Care, Memory Care, Respite Care & Skilled Nursing · Akron, OH
CMS overall rating Info CMS (the Centers for Medicare & Medicaid Services) is the federal agency that rates nursing home quality. Its Overall Rating runs from 1 to 5 stars, combining health inspections, staffing, and quality measures, with inspections weighted most heavily.
Calculator: See prices in your area
Bath Manor Special Care Centre accepts Medicare, Medicaid, and private pay.

Overview of Bath Manor Special Care Centre

Bath Manor Special Care Centre is a 130-bed nursing home in Akron, Ohio, operated by Summit County Alzheimer Care Center, Inc. This faith-based, non-profit facility provides 24-hour medical supervision, memory care programs, temporary respite services, and hospice care. Residents stay for about 146 days on average, representing a mix of individuals undergoing short-term physical rehabilitation and seniors needing permanent placement.

The community’s therapy team offers physical, occupational, and speech-language rehabilitation along with specialized respiratory treatments and wound care. Day-to-day schedules ensure residents receive an average of 3 hours and 19 minutes of combined direct nursing care. Payment pathways are flexible, as the home accepts Medicare and Medicaid alongside standard private payments.

The local neighborhood scores a 7 out of 100 on the walkability scale, meaning the area is highly car-dependent. Visiting families and staff will need a vehicle to handle errands or travel to and from the property since there are few walkable options nearby. The home maintains an active occupancy rate of roughly 82.7 percent.

Interested families exploring regional nursing home options or post-hospital recovery paths can contact the admissions office at Bath Manor Special Care Centre to verify current bed openings and review care plan pricing.

Quality ratings

Measured by Centers for Medicare & Medicaid Services (CMS)

Overall rating Info The Overall CMS Rating combines results from health inspections, staffing levels and quality measures. Health inspections carry the most weight. Staffing and quality scores can increase or decrease the final rating based on performance compared to state and national standards.
▼ 37.1% Below OH avg. ▼ 37.1% Below OH avg.OH average: 3.2Click the badge to see the full State ranking.Click here to see the full State ranking.
Health Inspection Info Based on the results of the facility's three most recent standard inspections and any complaint investigations. CMS reviews the number, scope, and severity of deficiencies, with more recent findings weighted more heavily.
▼ 28.6% Below OH avg. ▼ 28.6% Below OH avg.OH average: 2.8Click the badge to see the full State ranking.Click here to see the full State ranking.
Staffing Info Measures average nursing staff hours per resident per day, including Registered Nurses (RNs) and total nursing staff. Ratings are adjusted based on the level of care residents require and are compared to state and national benchmarks.
▼ 59.1% Below OH avg. ▼ 59.1% Below OH avg.OH average: 2.4Click the badge to see the full State ranking.Click here to see the full State ranking.
Quality Measures Info Based on clinical and physical health indicators reported to CMS, such as hospital readmissions, falls, pressure ulcers, and improvements in mobility. These measures reflect how well residents' health needs are being managed.
▲ 14.7% Above OH avg. ▲ 14.7% Above OH avg.OH average: 4.4Click the badge to see the full State ranking.Click here to see the full State ranking.

Staffing hours breakdown

Info Daily nursing hours per resident by staff type, reported to CMS. Higher is generally better — compare this facility to state and national averages to see where staffing stands.

Hours per resident per day — compared to Ohio state averages

Total nursing care / resident Info This home is ranked 122nd out of 199 homes in Ohio for nurse hours. Total adjusted nursing hours per resident per day, combining RN, LPN, and aide time. CMS adjusts this for case-mix so facilities can be fairly compared.
3h 19m per day
Rank #122 / 199Nurse hours — State benchmarkedThis home is ranked 122nd out of 199 homes in Ohio for Nurse Hours. Shows adjusted nurse hours per resident per day benchmarked to the Ohio average, with a ranking across 199 Ohio facilities. More hours mean more direct care. The national average is about 3.5 hrs; below 3.0 is a red flag.Facilities with the same value for a metric share the same rank. Rankings are based only on facilities in Ohio that report data for that category. Facilities without available data are excluded from the ranking.Click the rank badge to see the full State ranking.Click here to see the full State ranking.
This facility Ohio avg (3h 32m per day)
vs Ohio avg
-7%

5 of 6 metrics below state avg

Standout metric LPN / LVN is +10% above state avg
Staff typeHours / Day / Residentvs state avg
Registered Nurse (RN) Info RNs hold the highest nursing license and can assess residents, interpret test results, and direct care plans. More RN hours per day often signals stronger clinical oversight and faster response to health changes. 35m per day ▼ 9% State avg: 38m per day · National avg: 41m per day
LPN / LVN Info Licensed Practical Nurses (LPNs) or Licensed Vocational Nurses (LVNs) deliver routine hands-on care — medication administration, wound dressing, and monitoring vital signs. They work under RN supervision and make up a large share of daily bedside care. 1h 4m per day ▲ 10% State avg: 58m per day · National avg: 52m per day
Nurse Aide Info Certified Nurse Aides (CNAs) provide the most direct day-to-day assistance: bathing, dressing, feeding, and mobility. Nurse aide hours are typically the largest staffing category and directly affect residents' quality of life. 1h 59m per day ▼ 7% State avg: 2h 7m per day · National avg: 2h 20m per day
Weekend Total Nursing Info Combined nursing hours (RN + LPN + Nurse Aide) per resident per day on weekends. Staffing often drops on weekends — this figure reveals whether the facility maintains adequate coverage outside of weekday hours. 3h 14m per day ▼ 3% State avg: 3h 20m per day · National avg: 3h 27m per day
Physical Therapist Info Hours per resident per day provided by licensed Physical Therapists (PTs) or PT Assistants. PT services help residents recover mobility after injury or illness and are especially important for post-acute (short-stay) rehabilitation. 3m per day ▼ 13% State avg: 3m per day · National avg: 4m per day
Weekend RN Info Registered nurse hours specifically on weekends. Facilities sometimes reduce RN presence on Saturdays and Sundays — a low weekend RN figure compared to weekday hours can indicate reduced clinical oversight when most administrative staff are absent. 18m per day ▼ 30% State avg: 25m per day · National avg: 29m per day

Capacity and availability

Medium-capacity home

Offers a balance of services and community atmosphere.

Total beds 130
Avg. Length of Stay Info Average number of days residents stay at this facility, based on CMS cost report data. Shorter stays often reflect post-acute or rehab care; longer stays reflect long-term care.
146 days
Walk Score
Walk Score: 7 / 100 Rank #636 / 704Walk Score — State benchmarkedThis home is ranked 636th out of 704 homes in Ohio for Walk Score. Shows how walkable this facility's neighborhood is compared to the average Walk Score across Ohio facilities. Higher scores benefit residents, families, and staff.Facilities with the same value for a metric share the same rank. Rankings are based only on facilities in Ohio that report data for that category. Facilities without available data are excluded from the ranking.Click the rank badge to see the full State ranking.Click here to see the full State ranking.
Car-dependent. Most errands require a car, with limited nearby walkable options.

Therapy & Rehabilitation

2 services
Rehabilitation Services
Respite Care

Staffing & Medical

1 service
24-Hour Staffing

Additional Services

3 services
Personal Care
Dialysis Care
Vent Management

Amenities & Lifestyle

Long Term Care
Pulmonary Care

Contact Bath Manor Special Care Centre

Penalties and fines

Federal penalties imposed by CMS for regulatory violations, including civil money penalties (fines) and denials of payment for new Medicare/Medicaid admissions.

Source: CMS Penalties Database

No penalties in the past 3 years

No civil money penalties or payment denials were reported in the last 3 years.

Breakdown by payment type

Medicare

12% of new residents, usually for short-term rehab.

Typical stay 18 days

Private pay

82% of new residents, often for short stays.

Typical stay 4 - 5 months

Medicaid

7% of new residents, often for long-term daily care.

Typical stay 1 years

Finances and operations

Based on CMS SNF Cost Report for fiscal year ending in 12/2023.

For-profit
Corporation
Net patient revenue Info Net patient revenue — what the home actually collects for resident care, after contractual allowances, bad debt and discounts are subtracted from its gross charges (CMS cost report, Worksheet G-3). It covers resident care only; money the home earns from other sources is shown separately as "Other income."
$14.3M
Net patient income Info Net patient income: net patient revenue minus the home's total operating expenses. A positive figure means it earns more from resident care than it spends to deliver it; a negative figure means the opposite. It excludes non-operating "other income."
$1.8M
For-profit Corporation
Net patient revenue Info Net patient revenue — what the home actually collects for resident care, after contractual allowances, bad debt and discounts are subtracted from its gross charges (CMS cost report, Worksheet G-3). It covers resident care only; money the home earns from other sources is shown separately as "Other income."
$14.3M Rank #43 / 199Revenue — State benchmarkedThis home is ranked 43rd out of 199 homes in Ohio for Revenue. Shows this facility's annual revenue compared to the Ohio average. Higher revenue generally means more resources for staffing and capital — read alongside Payroll %.Facilities with the same value for a metric share the same rank. Rankings are based only on facilities in Ohio that report data for that category. Facilities without available data are excluded from the ranking.Click the rank badge to see the full State ranking.Click here to see the full State ranking.
Net patient income Info Net patient income: net patient revenue minus the home's total operating expenses. A positive figure means it earns more from resident care than it spends to deliver it; a negative figure means the opposite. It excludes non-operating "other income."
$1.8M
Other income Info Money the home earns outside of resident care — such as investments, grants, rentals and other non-operating sources (CMS cost report, Worksheet G-3). It is tracked separately from net patient revenue: it is not part of that figure, and it is not included in net patient income.
$765.0K
Payroll costs Info Staff salaries plus wage-related costs — benefits such as payroll taxes, health insurance and retirement — from the home's own accounting records (CMS cost report, Worksheet A). Contract or agency labor is counted separately, under other operating costs. Rank #38 / 199Payroll — State benchmarkedThis home is ranked 38th out of 199 homes in Ohio for Payroll. Shows total annual staff payroll benchmarked to the Ohio average. Higher payroll investment relative to peers often signals better staffing and less reliance on cheaper contract labor.Facilities with the same value for a metric share the same rank. Rankings are based only on facilities in Ohio that report data for that category. Facilities without available data are excluded from the ranking.Click the rank badge to see the full State ranking.Click here to see the full State ranking.
$7.0M 49.1% of net patient revenue Info Payroll as a share of revenue: staff salaries and wage-related benefits divided by net patient revenue. A higher figure means more of each revenue dollar goes to staff pay. Rank #85 / 199Payroll % — State benchmarkedThis home is ranked 85th out of 199 homes in Ohio for Payroll %. Shows payroll as a percentage of revenue versus the Ohio average. Well-run Ohio facilities typically land around 54–64% — the top third Statewide. Below 25% may signal understaffing or heavy agency use — read with Staffing ratings.Facilities with the same value for a metric share the same rank. Rankings are based only on facilities in Ohio that report data for that category. Facilities without available data are excluded from the ranking.Click the rank badge to see the full State ranking.Click here to see the full State ranking.
Other operating costs Info Everything it costs to run the home apart from payroll — food, utilities, supplies, maintenance, contract labor and administration. Calculated as total operating expense minus payroll (staff salaries and wage-related benefits).
$5.5M
Total costs Info The home's total operating expense for the year — all the costs of running it, salaries included (CMS cost report, Worksheet G-3).
$12.5M

Who this home usually serves

TYPE OF STAY

Primarily short stays

Residents typically stay for brief periods, with frequent admissions and discharges throughout the year.

Most new residents arrive under private pay (82% of admissions), and a typical private pay stay runs around 4 - 5 months.

Admissions
272 total

Coverage residents most often arrive under.

Medicare 12%
Private pay 82%
Medicaid 7%
Discharges
281 total

Coverage residents most often leave under.

Medicare 8%
Private pay 84%
Medicaid 9%

Compare Nursing Homes around Akron

The information below is reported by the Ohio Department of Health, Bureau of Survey and Certification.

CMS & OH Dept. of Health data

Ohio Living Rockynol
NH
AL
IL
MC
SNF
Akron (Highland Square)
79
Facility 79
OH AVG 76
Rank #144 / 315
34.2%
Facility 34.2%
OH AVG 81.9
Rank #144 / 145
-58%
3.99
Facility 3.99
OH AVG 3.54
Rank #48 / 199
-69%+13%
$0
Facility $0
OH AVG $74.0k
Rank #1 / 200
4
Facility 4
OH AVG 30.9
Rank #4 / 199
2.0
Facility 2.0
OH AVG 4.6
Rank #11 / 199
-27A+
65
Facility 65
OH AVG 40
Rank #107 / 704
Laurence Gumina
$4.1MFiscal year ending 06/2024
Facility $4.1MFiscal year ending 06/2024
OH AVG $10.1M
Rank #166 / 199
$2.5MFiscal year ending 06/2024
Facility $2.5MFiscal year ending 06/2024
OH AVG $3.9M
Rank #179 / 199
60.6%Fiscal year ending 06/2024
Facility 60.6%Fiscal year ending 06/2024
OH AVG 40.2%
Rank #147 / 199
365051
Hickory Ridge Nursing & Rehab Center
NH
SNF
Akron (Cascade Valley)
155
Facility 155
OH AVG 76
Rank #10 / 315
94.8%
Facility 94.8%
OH AVG 81.9
Rank #15 / 145
+16%
2.66
Facility 2.66
OH AVG 3.54
Rank #190 / 199
-39%-25%
$0
Facility $0
OH AVG $74.0k
Rank #1 / 200
21
Facility 21
OH AVG 30.9
Rank #66 / 199
3.5
Facility 3.5
OH AVG 4.6
Rank #63 / 199
-147A+
5
Facility 5
OH AVG 40
Rank #648 / 704
Foundations Health LLC
$14.2MFiscal year ending 12/2023
Facility $14.2MFiscal year ending 12/2023
OH AVG $10.1M
Rank #46 / 199
$9.0MFiscal year ending 12/2023
Facility $9.0MFiscal year ending 12/2023
OH AVG $3.9M
Rank #26 / 199
63.4%Fiscal year ending 12/2023
Facility 63.4%Fiscal year ending 12/2023
OH AVG 40.2%
Rank #36 / 199
365134
The Merriman
NH
HOS
PC
RC
SNF
Akron (Highland Square)
55
Facility 55
OH AVG 76
Rank #202 / 315
85.8%
Facility 85.8%
OH AVG 81.9
Rank #78 / 145
+5%
3.52
Facility 3.52
OH AVG 3.54
Rank #95 / 199
+156%-1%
$134.5k
Facility $134.5k
OH AVG $74.0k
Rank #186 / 200
63
Facility 63
OH AVG 30.9
Rank #187 / 199
3.9
Facility 3.9
OH AVG 4.6
Rank #85 / 199
347-
70
Facility 70
OH AVG 40
Rank #67 / 704
-
$5.8MFiscal year ending 12/2023
Facility $5.8MFiscal year ending 12/2023
OH AVG $10.1M
Rank #170 / 199
$2.7MFiscal year ending 12/2023
Facility $2.7MFiscal year ending 12/2023
OH AVG $3.9M
Rank #169 / 199
47.1%Fiscal year ending 12/2023
Facility 47.1%Fiscal year ending 12/2023
OH AVG 40.2%
Rank #52 / 199
365859
Highland Square Nursing & Rehabilitation
NH
AL
IL
MC
Akron (Highland Square)
91
Facility 91
OH AVG 76
Rank #104 / 315
70.9%
Facility 70.9%
OH AVG 81.9
Rank #124 / 145
-13%
2.98
Facility 2.98
OH AVG 3.54
Rank #168 / 199
-35%-16%
$403.0k
Facility $403.0k
OH AVG $74.0k
Rank #200 / 200
66
Facility 66
OH AVG 30.9
Rank #190 / 199
3.0
Facility 3.0
OH AVG 4.6
Rank #42 / 199
565-
39
Facility 39
OH AVG 40
Rank #370 / 704
Amy Martin
$7.3MFiscal year ending 12/2023
Facility $7.3MFiscal year ending 12/2023
OH AVG $10.1M
Rank #131 / 199
$3.3MFiscal year ending 12/2023
Facility $3.3MFiscal year ending 12/2023
OH AVG $3.9M
Rank #154 / 199
45.6%Fiscal year ending 12/2023
Facility 45.6%Fiscal year ending 12/2023
OH AVG 40.2%
Rank #164 / 199
365316

Financial Assistance for
Nursing Home in Ohio

Bath Manor Special Care Centre is located in Akron, Ohio.
Here are the financial assistance programs available to residents in Ohio.

Get Financial aid guidance

PASSPORT Waiver

Ohio Medicaid PASSPORT

Age 60+
General Ohio resident, Medicaid-eligible, nursing home-level care need.
Income Limits (2025) ~$2,829/month 300% FBR, individual
Asset Limits $2,000 (individual), $3,000 (couple).
OH

Administered through regional agencies; waitlists possible.

Benefits
Personal care (5-7 hours/day) Respite (240 hours/year) Adult day care ($65/day) Home modifications ($1,500 avg.)

Ohio Home Care Program (non-Medicaid)

OH HCP

Age 60+
General Ohio resident, at risk of decline.
Income Limits ~$2,000/month individual, varies
Asset Limits $5,000 individual
OH

Limited funding; regional variation.

Benefits
In-home care (3-5 hours/week) Respite (up to 10 days/year) Transportation (~5 trips/month)

Assisted Living Waiver (ALW)

Ohio Assisted Living Waiver

Age 21+ (65+ prioritized)
General OH resident, Medicaid-eligible, NFLOC.
Income Limits (2025) ~$2,829/month (individual); QIT required.
Asset Limits $2,000 (individual), $3,000 (couple).
OH

Covers ~300 facilities; room/board not included (separate cost).

Benefits
Personal care Meals Medication management Transportation (~$3,000-$4,000/month value)

Program of All-Inclusive Care for the Elderly (PACE)

Ohio PACE (e.g., McGregor PACE)

Age 55+
General OH resident (specific counties), NFLOC, safe with PACE support.
Income Limits (2025) ~$2,829/month (Medicaid-eligible); private pay option available.
Asset Limits $2,000 (individual), $3,000 (couple) for Medicaid enrollees.
OH

Available in 9 counties (e.g., Cuyahoga, Franklin); expanding via Healthy Aging Grants.

Benefits
Personal care (5-7 hours/day) Medical care Meals Transportation Respite Therapies

Medicare Savings Program (MSP)

Ohio Medicare Savings Program

Age 65+ or disabled
General OH resident, Medicare Part A/B.
Income Limits (2025) ~$2,510/month (QMB), ~$3,380/month (SLMB), ~$3,598/month (QI)—individual.
Asset Limits $9,430 (individual), $14,130 (couple).
OH

Three tiers; includes Extra Help for Part D; no waitlist.

Benefits
Covers Part B premiums ($174.70/month) Deductibles ($240/year) Copays (~20%)

Home Energy Assistance Program (HEAP)

Ohio HEAP

Age 60+ prioritized
General OH resident, low-income household.
Income Limits (2025) ~$3,970/month individual, 185% FPL
Asset Limits Not assessed; income-focused.
OH

Covers gas, electric, oil; emergency aid via Winter/Summer Crisis Programs.

Benefits
Heating/cooling aid ($300-$1,000/season) Emergency aid ($500 max)

Family Caregiver Support Program (FCSP)

Ohio Family Caregiver Support Program

Age
General Caregivers of 60+ needing care or 55+ caregivers of others; OH resident; functional needs (2+ ADLs).
Income Limits (2025) Prioritizes ~$24,980/year (individual); no strict cap.
Asset Limits Not assessed; need-based.
OH

12 AAAs; rural/low-income priority; volunteer respite option.

Benefits
Respite (4-6 hours/week or 5 days/year) Adult day care ($60/day) Training Supplies (~$500/year)

VA Aid and Attendance (A&A) and Housebound Benefits

Ohio VA Aid and Attendance/Housebound

Age 65+ or disabled veteran/spouse
General OH resident, wartime service, need for ADL help (A&A) or homebound.
Income Limits (2025) Net income < ~$1,984/month (veteran with dependent, A&A); pension offsets income.
Asset Limits ~$155,356 net worth limit
OH

High veteran demand; supports care in multiple settings.

Benefits
Cash (~$1,433-$2,642/month veteran, ~$951-$1,318 spouse) for care costs (e.g., in-home, assisted living)

Homestead Exemption

Ohio Homestead Exemption

Age 65+ (or disabled)
General OH resident, homeowner, low-income.
Income Limits (2025) ~$38,500/year individual, adjusted annually
Asset Limits Not assessed; home ownership required.
OH

Reduces taxable value by $25,000; applies to primary residence.

Benefits
Tax reduction (~$400-$800/year avg., varies by county)

Save the Dream Ohio (Homeowner Assistance Fund)

Ohio Save the Dream

Age 60+ prioritized
General OH resident, homeowner, hardship post-Jan 21, 2020.
Income Limits (2025) ~$147,600/year family of 4, 150% AMI; varies by county
Asset Limits Not assessed; hardship-focused.
OH

Covers delinquent mortgages, utilities, taxes; max $25,000 mortgage aid.

Benefits
Mortgage aid ($25,000 max) Utility/property tax aid ($5,000 avg.)

Frequently Asked Questions about Bath Manor Special Care Centre

Is Bath Manor Special Care Centre in a walkable area?

Bath Manor Special Care Centre has a walk score of 7. Car-dependent. Most errands require a car, with limited nearby walkable options.

What is the occupancy rate at Bath Manor Special Care Centre?

Bath Manor Special Care Centre's occupancy is 82.7%.

Does Bath Manor Special Care Centre operate as a for-profit or non-profit?

Bath Manor Special Care Centre is registered as a for-profit.

Are there photos of Bath Manor Special Care Centre?

Yes — there is 1 photo of Bath Manor Special Care Centre in the photo gallery on this page.

What is the phone number of Bath Manor Special Care Centre?

(330) 836-1006 will put you in contact with the team at Bath Manor Special Care Centre.

Is Bath Manor Special Care Centre Medicare or Medicaid certified?

Bath Manor Special Care Centre is not currently listed as a CMS-certified provider of Medicare or Medicaid.

Guides for Better Senior Living

Care Cost Calculator: See Prices in Your Area

Nursing Home Data Explorer

Don’t Wait Too Long: 7 Red Flag Signs Your Parent Needs Assisted Living Now

The True Cost of Assisted Living in 2025 – And How Families Are Paying For It

Understanding Senior Living Costs: Pricing Models, Discounts & Financial Assistance


