Bayberry Skilled Nursing & Healthcare Center
Nursing Home & Memory Care · Contra Costa County, CA
CMS overall rating Info The Overall CMS Rating is scored from 1 to 5 stars and combines results from health inspections, staffing levels, and quality measures. Health inspections carry the most weight. Staffing and quality scores can increase or decrease the final rating based on performance compared to state and national standards.

Bayberry Skilled Nursing & Healthcare Center

Nursing Home & Memory Care · Contra Costa County, CA
CMS overall rating Info The Overall CMS Rating is scored from 1 to 5 stars and combines results from health inspections, staffing levels, and quality measures. Health inspections carry the most weight. Staffing and quality scores can increase or decrease the final rating based on performance compared to state and national standards.
Calculator: See prices in your area
Bayberry Skilled Nursing & Healthcare Center accepts Medicare, Medicaid, and private pay.

Overview of Bayberry Skilled Nursing & Healthcare Center

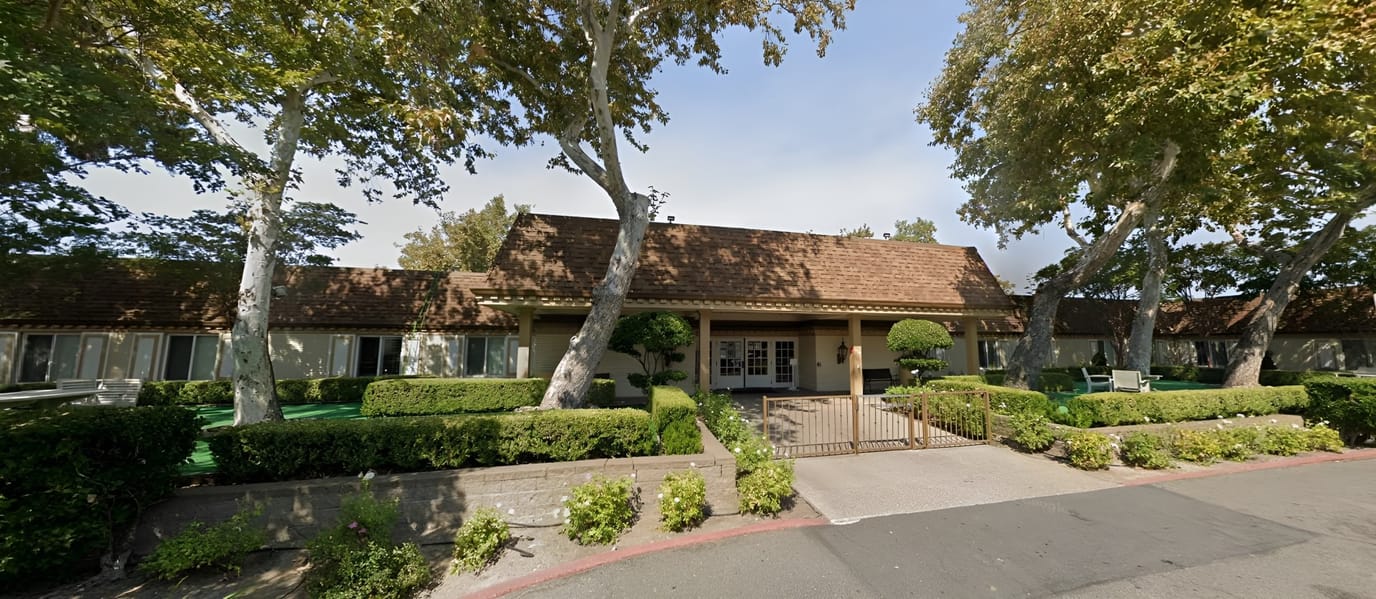
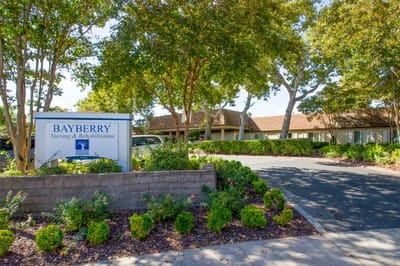
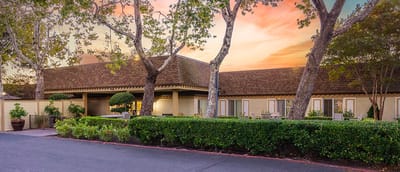
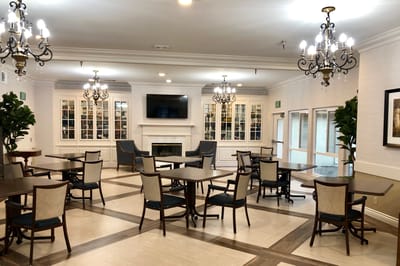
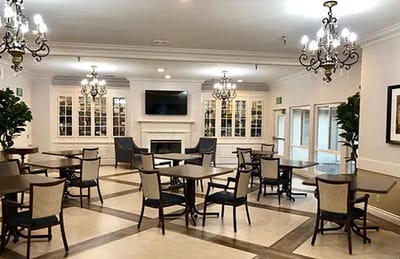
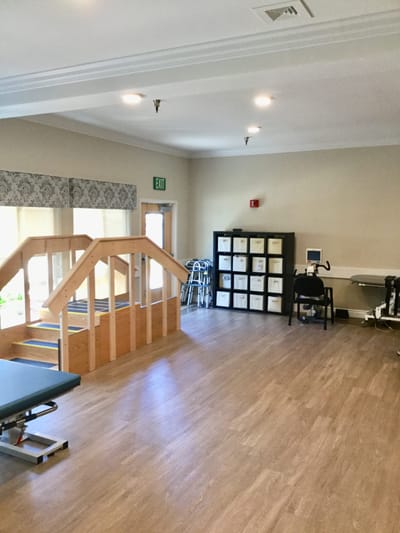
Receive exceptional care from Bayberry Skilled Nursing & Healthcare Center, a distinguished community in Concord, CA, that offers a wide range of care options. These include long-term restorative care, short-term rehabilitation, dementia care, respite care, cardiac care, orthopedic care, wound care, stroke recovery care, and therapy. A compassionate and highly trained team strives to meet residents’ unique needs 24/7 for comfort and convenience.

Aside from their healthcare needs, a well-thought-out calendar of engaging activities and exciting events is also conducted so residents can live actively and remain socially engaged. Physical, occupational, and speech therapy are provided to improve residents’ living experiences. Here, mealtimes not only meet dietary needs but also promote social interactions with delightful and well-balanced meals that satisfy dietary needs and preferences. The community strives to enhance residents’ conditions, allowing them to jump back into their lives without worries.

(925) 825-1300

Quality ratings

Measured by Centers for Medicare & Medicaid Services (CMS)

Overall rating Info The Overall CMS Rating combines results from health inspections, staffing levels and quality measures. Health inspections carry the most weight. Staffing and quality scores can increase or decrease the final rating based on performance compared to state and national standards.
▲ 38.9% Above CA avg. ▲ 38.9% Above CA avg.Click the badge to see the full State ranking.Click here to see the full State ranking.
Health Inspection Info Based on the results of the facility's three most recent standard inspections and any complaint investigations. CMS reviews the number, scope, and severity of deficiencies, with more recent findings weighted more heavily.
▲ 27.0% Above CA avg. ▲ 27.0% Above CA avg.Click the badge to see the full State ranking.Click here to see the full State ranking.
Staffing Info Measures average nursing staff hours per resident per day, including Registered Nurses (RNs) and total nursing staff. Ratings are adjusted based on the level of care residents require and are compared to state and national benchmarks.
▲ 15.9% Above CA avg. ▲ 15.9% Above CA avg.Click the badge to see the full State ranking.Click here to see the full State ranking.
Quality Measures Info Based on clinical and physical health indicators reported to CMS, such as hospital readmissions, falls, pressure ulcers, and improvements in mobility. These measures reflect how well residents' health needs are being managed.
▲ 17.4% Above CA avg. ▲ 17.4% Above CA avg.Click the badge to see the full State ranking.Click here to see the full State ranking.

Staffing hours breakdown

Info Daily nursing hours per resident by staff type, reported to CMS. Higher is generally better — compare this facility to state and national averages to see where staffing stands.

Hours per resident per day — compared to California state averages

Total nursing care / resident Info This home is ranked 45th out of 346 homes in California. Total adjusted nursing hours per resident per day, combining RN, LPN, and aide time. CMS adjusts this for case-mix so facilities can be fairly compared.
5h 1m per day
Rank #45 / 346Nurse hours — State benchmarkedThis home is ranked 45th out of 346 homes in California. Shows adjusted nurse hours per resident per day benchmarked to the California average, with a ranking across 346 California SNFs. More hours mean more direct care. The national average is about 3.5 hrs; below 3.0 is a red flag.Click the rank badge to see the full State ranking.Click here to see the full State ranking.
This facility California avg (4h 23m per day)
vs California avg
+14%
Staff typeHours / Day / Residentvs state avg
Total Nursing (Weekend) Info Combined nursing hours (RN + LPN + Nurse Aide) per resident per day on weekends. Staffing often drops on weekends — this figure reveals whether the facility maintains adequate coverage outside of weekday hours. 3h 41m per day

Types of Care at Bayberry Skilled Nursing & Healthcare Center

Nursing Home Memory Care

Capacity and availability

This home usually has availability

Occupancy lower than 85% suggests more openings may be available.

Lower occupancy than the California average: 84.7%
Occupancy rate 67.8% Rank #286 / 351Occupancy rate — State benchmarkedThis home is ranked 286th out of 351 homes in California. Shows this facility's occupancy rate versus the California average, with its Statewide rank out of 351. Higher occupancy signals strong local demand and financial stability.Click the rank badge to see the full State ranking.Click here to see the full State ranking.
Avg. Length of Stay 134 days
Occupancy rate
67.8% Rank #286 / 351Occupancy rate — State benchmarkedThis home is ranked 286th out of 351 homes in California. Shows this facility's occupancy rate versus the California average, with its Statewide rank out of 351. Higher occupancy signals strong local demand and financial stability.Click the rank badge to see the full State ranking.Click here to see the full State ranking.
Avg. Length of Stay
134 days
Walk Score
Walk Score: 96 / 100 Rank #7 / 359Walk Score — State benchmarkedThis home is ranked 7th out of 359 homes in California. Shows how walkable this facility's neighborhood is compared to the average Walk Score across California SNFs. Higher scores benefit residents, families, and staff.Click the rank badge to see the full State ranking.Click here to see the full State ranking.
Walker's paradise. Daily errands do not require a car, with many shops and services nearby.
BBB Rating
BBB Rating: A+ (Not Accredited)
An independent rating from the Better Business Bureau based on factors such as complaint history, transparency, and business practices.
How BBB ratings work

About this community

License Details

Status2018-10-03t00:00:00z
CMS Certification Number56260

Therapy & Rehabilitation

3 services
Rehabilitation Services
Respite Care
Short-Term Rehab

Staffing & Medical

1 service
24-Hour Staffing

Amenities & Lifestyle

Intensive Short-Term Rehabilitation Therapy
Long-Term Restorative Care
Dementia Care
Cardiac Care
Orthopedic Care
Stroke Recovery Care
Wound Care
Physical Therapy
Occupational Therapy
Speech Therapy
Orthopedic Rehab
Stroke
Pulmonary
And Cardiac Rehab
Spinal Cord Injury
Chf
Copd
And Diabetes Management
Wound And Ostomy Care
Iv Therapy
Tube Feeding
Memory/Dementia Care
Enhanced Dining
Free Cable Television
Barber
Phones In Short-Term Unit
Pet Visits
Free Parking
ActivitiesBayberry offers a variety of activities daily, weekly, and monthly that help patients recover physically, spiritually, mentally, and socially.
Specific ProgramsSkilled Nursing Facilities, Special Treatment Programs & Behavioral Health, Mental Health Rehabilitation Center, Adult Residential Facility, Total Patient Care, Behavioral Bed Availability, Substance Recovery
Religious ServicesYes
Operating Hours8 AM – 8 PM

Dining & Nutrition

Food DescriptionBayberry Skilled Nursing & Healthcare Center provides meals that are both delicious and healthy, catering to each resident’s specific dietary restrictions and preferences.

Contact Bayberry Skilled Nursing & Healthcare Center

Health Inspection History

Inspections Since 2019
Total health inspections 4

California average 12.5


Last Health inspection on Jun 2025

Total health citations
18 Rank #32 / 354Health citations — State benchmarkedThis home is ranked 32nd out of 354 homes in California. Shows this facility's total health deficiency citations benchmarked to the California State average, with a ranking across all 354 CA SNFs. Lower citation counts earn a better rank.Click the rank badge to see the full State ranking.Click here to see the full State ranking.

California average 50.2

Citations per inspection
4.5 Rank #204 / 354Citations per inspection — State benchmarkedThis home is ranked 204th out of 354 homes in California. Shows average deficiency citations per CMS inspection for this facility versus the California mean across 354 SNFs with citation data. Lower is better.Click the rank badge to see the full State ranking.Click here to see the full State ranking.

California average 4.65


Health citations are formal notices following inspections when they fail to comply with safety and care standards.

17 of 18 citations resulted from standard inspections; and 1 of 18 resulted from complaint investigations.

Breakdown of citation severity (last 7 years)
Critical Health citations
0
100% better than California average

California average: 0.4


Serious Health citations
0
100% better than California average

California average: 1

0 critical citations California average: 0.4

0 serious citations California average: 1

18 moderate citations California average: 47.2

0 minor citations California average: 1.5
Citations history (last 7 years)
Abuse/Neglect moderate citation Jun 05, 2025
Corrected

Environmental moderate citation Jun 28, 2024
Corrected

Nutrition moderate citation Jun 28, 2024
Corrected

Nutrition moderate citation Jun 28, 2024
Corrected

Staffing Data

Reporting period: October 1 – December 31, 2025 (Q4 2025). Source: CMS Payroll-Based Journal report.

Total staff 143
Employees 143
Contractors 0
Staff to resident ratio 2.70:1
2698013% better than California average
California average ratio: 0.00:1 California average ratio: 0.00:1See full California ranking
Avg staff/day 59
Average shift 7.7 hours
0% compared with California average
California average: 7.7 hours California average shift: 7.7 hoursSee full California ranking
Total staff hours (quarter) 41,678

Nursing staff breakdown

Q4 2025 · Oct 1 – Dec 31 More info This data comes from the CMS Payroll-Based Journal report covering October 1 – December 31, 2025.
Registered Nurse

Manages medical care and health needs.

Total count 8
Average shift length Info Average shift length. Calculated as total hours divided by days worked and average staff per day. 7.6 hours

No contractors work on this role.

Licensed Practical Nurse

Assists with medical care and medications.

Total count 38
Average shift length Info Average shift length. Calculated as total hours divided by days worked and average staff per day. 7.7 hours

No contractors work on this role.

Certified Nursing Assistant

Helps with daily care and mobility.

Total count 50
Average shift length Info Average shift length. Calculated as total hours divided by days worked and average staff per day. 7.5 hours

No contractors work on this role.

Contractor staffing

Q4 2025 · Oct 1 – Dec 31 More info This data comes from the CMS Payroll-Based Journal report covering October 1 – December 31, 2025.

Total hours from contractors

0%

0 contractor hours this quarter

No contractor roles were reported this quarter.

Staff by category

Q4 2025 · Oct 1 – Dec 31 More info This data comes from the CMS Payroll-Based Journal report covering October 1 – December 31, 2025.
Certified Nursing Assistant5005016,47292100%7.5
Licensed Practical Nurse3803811,36392100%7.7
Diagnostic X-ray Services Staff160164,07392100%8
Registered Nurse8082,02592100%7.6
Other Dietary Services Staff3031,2299199%7.6
RN Director of Nursing2029746470%8.4
Clinical Nurse Specialist2028566470%8
Respiratory Therapy Technician3038097379%7.3
Physical Therapy Assistant6065646571%6.9
Mental Health Service Worker1015046368%8
Therapeutic Recreation Specialist1014676874%6.9
Dental Services Staff2024506166%7.2
Physical Therapy Aide2024356267%7
Nurse Practitioner1014245358%8
Administrator1013123942%8
Speech Language Pathologist2022803942%6.6
Dietitian2022643336%8
Qualified Social Worker3031773033%5.5
50 Certified Nursing Assistant
% of Days 100%
38 Licensed Practical Nurse
% of Days 100%
16 Diagnostic X-ray Services Staff
% of Days 100%
8 Registered Nurse
% of Days 100%
3 Other Dietary Services Staff
% of Days 99%
2 RN Director of Nursing
% of Days 70%
2 Clinical Nurse Specialist
% of Days 70%
3 Respiratory Therapy Technician
% of Days 79%
6 Physical Therapy Assistant
% of Days 71%
1 Mental Health Service Worker
% of Days 68%
1 Therapeutic Recreation Specialist
% of Days 74%
2 Dental Services Staff
% of Days 66%
2 Physical Therapy Aide
% of Days 67%
1 Nurse Practitioner
% of Days 58%
1 Administrator
% of Days 42%
2 Speech Language Pathologist
% of Days 42%
2 Dietitian
% of Days 36%
3 Qualified Social Worker
% of Days 33%

Penalties and fines

Federal penalties imposed by CMS for regulatory violations, including civil money penalties (fines) and denials of payment for new Medicare/Medicaid admissions.

Source: CMS Penalties Database

No penalties in the past 3 years

No civil money penalties or payment denials were reported in the last 3 years.

Quality of care over time

These measures show how residents usually do over time at this home, based on health outcomes and preventive care.

High-risk clinical events score Info A composite score based on pressure ulcers, falls with injury, weight loss, walking ability decline, and activities of daily living decline. 2.4
64% better than California average

California average: 6.6

Functional decline score Info A composite score based on activities of daily living decline, walking ability decline, and incontinence. 3.6
68% better than California average

California average: 11.3

Long-stay resident measures
Need for Help with Daily Activities Increased Info Percent of long-stay residents whose need for help with daily activities has increased 3.7%
67% better than California average

California average: 11.1%

Walking Ability Worsened Info Percent of long-stay residents whose ability to move independently worsened 2.5%
79% better than California average

California average: 12.0%

Low Risk Residents with Bowel/Bladder Incontinence Info Percent of low risk long-stay residents who lose control of their bowels or bladder 4.6%
59% better than California average

California average: 11.3%

Falls with Major Injury Info Percent of long-stay residents experiencing one or more falls with major injury 1.3%
25% better than California average

California average: 1.7%

High Risk Residents with Pressure Ulcers Info Percent of long-stay high risk residents with pressure ulcers 1.7%
66% better than California average

California average: 5.0%

Urinary Tract Infection Info Percent of long-stay residents with a urinary tract infection 0.6%
48% better than California average

California average: 1.2%

Lost Too Much Weight Info Percent of long-stay residents who lose too much weight 2.6%
38% better than California average

California average: 4.2%

Depressive Symptoms Info Percent of long-stay residents who have depressive symptoms 4.0%
41% better than California average

California average: 6.7%

Antipsychotic Use Info Percent of long-stay residents who received an antipsychotic medication 10.1%
In line with California average

California average: 10.1%

Pneumococcal Vaccine Info Percent of long-stay residents assessed and appropriately given the pneumococcal vaccine 100.0%
In line with California average

California average: 98.5%

Influenza Vaccine Info Percent of long-stay residents assessed and appropriately given the seasonal influenza vaccine 100.0%
In line with California average

California average: 98.2%

Short-stay resident measures
Pneumococcal Vaccine Info Percent of short-stay residents assessed and appropriately given the pneumococcal vaccine 100.0%
6% better than California average

California average: 94.0%

Antipsychotic medication increase Info Percent of short-stay residents who newly received an antipsychotic medication 0.0%
100% better than California average

California average: 1.5%

Influenza Vaccine Info Percent of short-stay residents assessed and appropriately given the seasonal influenza vaccine 100.0%
7% better than California average

California average: 93.2%

Breakdown by payment type

Medicare

27% of new residents, usually for short-term rehab.

Typical stay 1 - 2 months

Private pay

66% of new residents, often for short stays.

Typical stay 5 - 6 months

Medicaid

7% of new residents, often for long-term daily care.

Typical stay 7 months

Facility Characteristics

Source: CMS Long-Term Care Facility Characteristics (Data as of Jan 2026)

Total residents 53
Medicare
7
13.2% of residents
Medicaid
44
83% of residents
Private pay or other
2
3.8% of residents
Programs & Services
Residents Group

Residents meet regularly to discuss policies, care quality, and activities

Nurse Aide Training

State-approved Nurse Aide Training and Competency Evaluation Program on-site

Active Resident Council

Organized group of residents that meets regularly to discuss facility policies, quality of life, and activities.

Finances and operations

Privately-owned community
Operated by a business corporation.
Home revenue
$11.7M
Operating loss
-$2.0M
Privately-owned community Operated by a business corporation.
Home revenue
$11.7M Rank #256 / 347Revenue — State benchmarkedThis home is ranked 256th out of 347 homes in California. Shows this facility's annual revenue compared to the California SNF average. Higher revenue generally means more resources for staffing and capital — read alongside Payroll %.Click the rank badge to see the full State ranking.Click here to see the full State ranking.
Operating loss
-$2.0M
Payroll costs Info The portion of the home's budget spent on staff, including nurses, caregivers, and other employees who support care and operations. Rank #158 / 347Payroll — State benchmarkedThis home is ranked 158th out of 347 homes in California. Shows total annual staff payroll benchmarked to the California average. Higher payroll investment relative to peers often signals better staffing and less reliance on cheaper contract labor.Click the rank badge to see the full State ranking.Click here to see the full State ranking.
$8.9M
76.1% of revenue Rank #14 / 347Payroll % — State benchmarkedThis home is ranked 14th out of 347 homes in California. Shows payroll as a percentage of revenue versus the California average. Well-run California SNFs typically land around 56–67% — the top third Statewide. Below 25% may signal understaffing or heavy agency use — read with Staffing ratings.Click the rank badge to see the full State ranking.Click here to see the full State ranking.
Other operating costs Info All remaining costs needed to run the home, such as food, utilities, building maintenance, supplies and administrative expenses.
$4.7M
Total costs $13.7M

What does this home offer?

Total residents icon

Total Residents: 83 Residents

Housing options icon

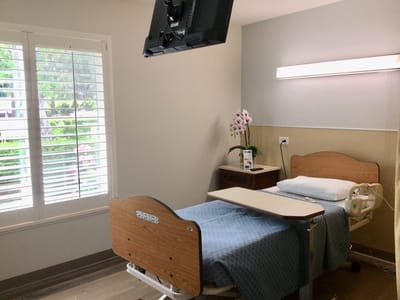
Housing Options: Private / Semi-Private Rooms

Building type icon
Building type icon

Building Type: Single-story

Dining services icon

Dining Services

Health Programs icon

Health Programs

Who this home usually serves

TYPE OF STAY

Primarily short stays

Residents typically stay for brief periods, with frequent admissions and discharges throughout the year.

Managed by John Mastrocola

Administrator & Special Projects Leader

John Mastrocola serves as the Administrator & Special Projects Leader at Bayberry Skilled Nursing & Healthcare Center. He leads the community with a focus on both administrative oversight and special projects, ensuring quality care and operational excellence.

Places of interest near Bayberry Skilled Nursing & Healthcare Center

Address 0.9 miles from city center Info Estimated distance in miles from Concord's city center to Bayberry Skilled Nursing & Healthcare Center's address, calculated via Google Maps.

Calculate Travel Distance to Bayberry Skilled Nursing & Healthcare Center

Add your location

Address

Financial Assistance for
Nursing Home in California

Bayberry Skilled Nursing & Healthcare Center is located in Concord, California.
Here are the financial assistance programs available to residents in California.

Get Financial aid guidance

Multipurpose Senior Services Program

MSSP (Medi-Cal Waiver)

Age 65+
General California resident, Medi-Cal eligible, nursing home risk.
Income Limits (2025) ~$2,829/month 300% FBR, individual
Asset Limits $2,000 (individual), $3,000 (couple).
CA

County-managed; waitlists possible.

Benefits
In-home support (4-6 hours/day) Respite care (14 days/year) Meals (~$6/meal) Transportation (8 trips/month) Care management

In-Home Supportive Services (IHSS)

California IHSS

Age 65+
General California resident, Medicaid-eligible or low-income.
Income Limits ~$1,732/month individual, Medi-Cal threshold
Asset Limits $2,000 individual
CA

Can hire family as caregivers.

Benefits
Personal care (up to 283 hours/month) Homemaker services Respite (varies)

Multipurpose Senior Services Program (MSSP)

CA MSSP

Age 65+
General California resident, Medi-Cal-eligible, nursing home-eligible but community-capable.
Income Limits ~$2,829/month 300% FBR, individual
Asset Limits $2,000 individual
CA

Available in 38 counties; waitlists common.

Benefits
Case management Respite care (up to 10 days/year) Minor home mods (avg. $500) Adult day care (~$50/day)

Property Tax Postponement Program (PTP)

CA PTP

Age 62+
General California resident, own and live in home, 40% equity.
Income Limits (2025) ~$51,500/year household, adjusted annually
Asset Limits Equity-based; no strict asset cap.
CA

Deferred taxes accrue interest (5% as of 2024); repaid upon sale/death.

Benefits
Property tax deferral (avg. $1,000-$3,000/year, varies by county)

Assisted Living Waiver (ALW)

CA ALW

Age 65+ or disabled
General California resident, Medi-Cal-eligible, nursing home-eligible.
Income Limits ~$2,829/month 300% FBR, individual
Asset Limits $2,000 individual
CA

Available in 15 counties (e.g., LA, Sacramento); waitlists common.

Benefits
Personal care in ALFs (5-7 hours/day) Medication management Social services

California CARES Program

CA CARES

Age
General Caregivers of California residents 60+ needing help with 3+ daily activities; no caregiver age limit.
Income Limits No strict limit; cost-sharing above ~$2,500/month threshold.
Asset Limits Not applicable; need-based.
CA

High demand in urban areas; complements IHSS respite.

Benefits
Respite care (up to 10 days/year) Counseling (4-6 sessions/year) Training (2-3 workshops/year) Supplies (~$200/year)

Compare Nursing Home around Contra Costa County

The information below is reported by the California Department of Social Services and Department of Public Health.

4 facilities compared · CMS & CA Dept. of Health data

Filter by care type
Bayberry Skilled Nursing & Healthcare Center
NH

Nursing Home Licensed facility providing 24/7 skilled nursing care for residents with complex, ongoing medical needs. Staffed by RNs, LPNs, and CNAs. Inspected and star-rated annually by CMS. Accepts Medicare (short-term rehab) and Medicaid (long-term care).

MC

Memory Care Secured, specialized care for people living with Alzheimer's or dementia. Staff trained in cognitive impairment, with higher staff-to-resident ratios and an environment designed to reduce confusion and wandering risk.

Concord (Adobe Street)95 67.8% -20%5.01 -35%+19%$0184.5-85A+ 96 Gianelle Kaliangara$11.7M$8.9M76.1%56260
Diablo Valley Post Acute
NH

Nursing Home Licensed facility providing 24/7 skilled nursing care for residents with complex, ongoing medical needs. Staffed by RNs, LPNs, and CNAs. Inspected and star-rated annually by CMS. Accepts Medicare (short-term rehab) and Medicaid (long-term care).

Concord190 86.8% +2%4.37 -22%+4%$0263.7-176- 54 Forrest Allen$26.8M$12.1M45.4%55150
Pleasant Hill Post Acute
NH

Nursing Home Licensed facility providing 24/7 skilled nursing care for residents with complex, ongoing medical needs. Staffed by RNs, LPNs, and CNAs. Inspected and star-rated annually by CMS. Accepts Medicare (short-term rehab) and Medicaid (long-term care).

Pleasant Hill (Pleasant Valley)6 83.3% -2%3.49 -2%-17%$0217.0-48- 71 Providence Group North LLC$19.6M$5.3M27.2%55049
Walnut Creek Skilled Nursing & Rehabilitation Center
NH

Nursing Home Licensed facility providing 24/7 skilled nursing care for residents with complex, ongoing medical needs. Staffed by RNs, LPNs, and CNAs. Inspected and star-rated annually by CMS. Accepts Medicare (short-term rehab) and Medicaid (long-term care).

Walnut Creek (Rossmoor)153 68.6% -19%3.40 +45%-19%$0543.4-144- 56 Dorothy Couto$47.0M$22.8M48.4%56327

Frequently Asked Questions about Bayberry Skilled Nursing & Healthcare Center

What neighborhood is Bayberry Skilled Nursing & Healthcare Center in?

Bayberry Skilled Nursing & Healthcare Center is in the Adobe Street neighborhood of Concord.

Is Bayberry Skilled Nursing & Healthcare Center in a walkable area?

Bayberry Skilled Nursing & Healthcare Center has a walk score of 96. Walker's paradise. Daily errands do not require a car, with many shops and services nearby.

Are there photos of Bayberry Skilled Nursing & Healthcare Center?

Yes — there are 5 photos of Bayberry Skilled Nursing & Healthcare Center in the photo gallery on this page.

What is the address of Bayberry Skilled Nursing & Healthcare Center?

Bayberry Skilled Nursing & Healthcare Center is located at 1800 Adobe St, Concord, CA 94520.

What is the phone number of Bayberry Skilled Nursing & Healthcare Center?

(925) 825-1300 will put you in contact with the team at Bayberry Skilled Nursing & Healthcare Center.

Is Bayberry Skilled Nursing & Healthcare Center Medicare or Medicaid certified?

Yes — Bayberry Skilled Nursing & Healthcare Center is a CMS-certified provider of Medicare and Medicaid.

Guides for Better Senior Living

Care Cost Calculator: See Prices in Your Area

Nursing Home Data Explorer

Don’t Wait Too Long: 7 Red Flag Signs Your Parent Needs Assisted Living Now

The True Cost of Assisted Living in 2025 – And How Families Are Paying For It

Understanding Senior Living Costs: Pricing Models, Discounts & Financial Assistance

Explore Open Rooms
1 Contact details
2 What type of senior care service are you looking for?
3 What budget do you have in mind for senior care?
4 How soon do you need to find care?
5 Additional details

Thank you for your interest!

Our team will be in touch shortly to help with next steps.