Diablo Valley Post Acute
CMS overall rating Info CMS (the Centers for Medicare & Medicaid Services) is the federal agency that rates nursing home quality. Its Overall Rating runs from 1 to 5 stars, combining health inspections, staffing, and quality measures, with inspections weighted most heavily.

Diablo Valley Post Acute

CMS overall rating Info CMS (the Centers for Medicare & Medicaid Services) is the federal agency that rates nursing home quality. Its Overall Rating runs from 1 to 5 stars, combining health inspections, staffing, and quality measures, with inspections weighted most heavily.
Calculator: See prices in your area
Diablo Valley Post Acute accepts Medicare, Medicaid, and private pay.

Overview of Diablo Valley Post Acute

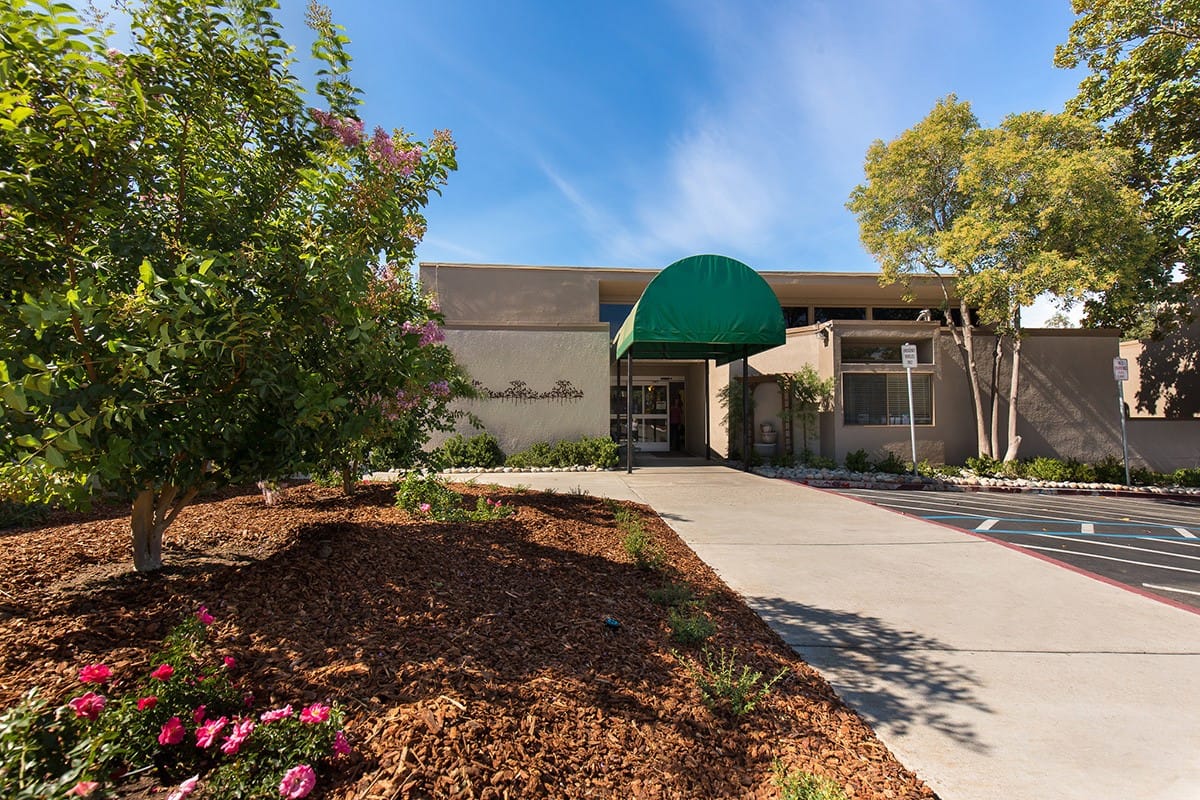
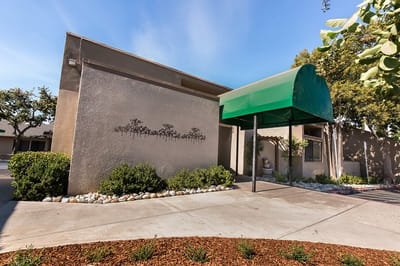
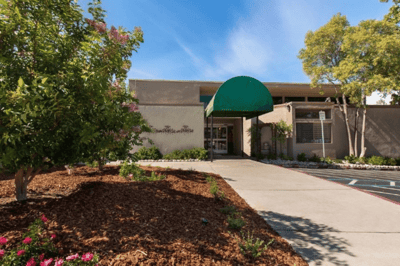
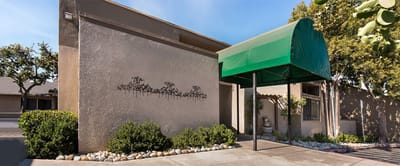
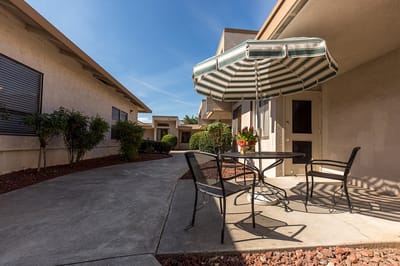
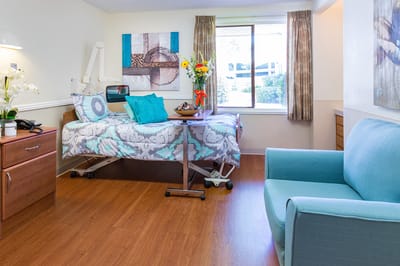
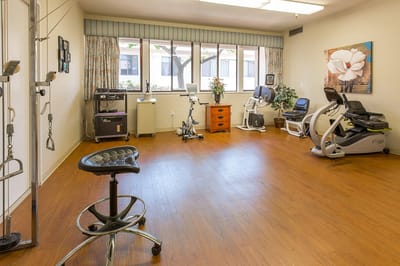
Diablo Valley Post Acute is a distinguished community in Concord, CA, that offers skilled nursing and rehabilitation. Residents here enjoy the highest quality of care from a kind and highly trained team attending to their needs 24/7. The community also assists with social services to help residents and their families experience a stress-free transition. Providing care in Costa County since 2005, the community promotes a cozy and nurturing environment for residents to feel at ease.

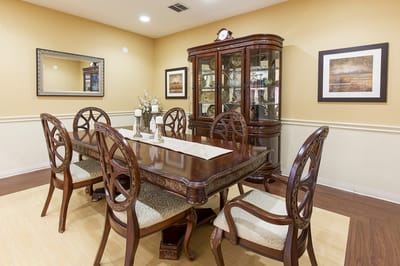
Engaging activities and stimulating programs are also conducted to promote residents’ holistic wellness. Delicious and healthy meals are served to meet residents’ dietary needs and preferences. The community is rated 4 stars by Medicare, proving its exceptional quality and dedication to improving residents’ quality of life.

(925) 689-2266

Quality ratings

Measured by Centers for Medicare & Medicaid Services (CMS)

Overall rating Info The Overall CMS Rating combines results from health inspections, staffing levels and quality measures. Health inspections carry the most weight. Staffing and quality scores can increase or decrease the final rating based on performance compared to state and national standards.
▼ 4.7% Below CA avg. ▼ 4.7% Below CA avg.CA average: 3.1Click the badge to see the full State ranking.Click here to see the full State ranking.
Health Inspection Info Based on the results of the facility's three most recent standard inspections and any complaint investigations. CMS reviews the number, scope, and severity of deficiencies, with more recent findings weighted more heavily.
▼ 28.5% Below CA avg. ▼ 28.5% Below CA avg.CA average: 2.8Click the badge to see the full State ranking.Click here to see the full State ranking.
Staffing Info Measures average nursing staff hours per resident per day, including Registered Nurses (RNs) and total nursing staff. Ratings are adjusted based on the level of care residents require and are compared to state and national benchmarks.
▲ 27.5% Above CA avg. ▲ 27.5% Above CA avg.CA average: 3.1Click the badge to see the full State ranking.Click here to see the full State ranking.
Quality Measures Info Based on clinical and physical health indicators reported to CMS, such as hospital readmissions, falls, pressure ulcers, and improvements in mobility. These measures reflect how well residents' health needs are being managed.
▲ 22.4% Above CA avg. ▲ 22.4% Above CA avg.CA average: 4.1Click the badge to see the full State ranking.Click here to see the full State ranking.

Staffing hours breakdown

Info Daily nursing hours per resident by staff type, reported to CMS. Higher is generally better — compare this facility to state and national averages to see where staffing stands.

Hours per resident per day — compared to California state averages

Total nursing care / resident Info This home is ranked 105th out of 354 homes in California for nurse hours. Total adjusted nursing hours per resident per day, combining RN, LPN, and aide time. CMS adjusts this for case-mix so facilities can be fairly compared.
4h 22m per day
Rank #105 / 354Nurse hours — State benchmarkedThis home is ranked 105th out of 354 homes in California. Shows adjusted nurse hours per resident per day benchmarked to the California average, with a ranking across 354 California facilities. More hours mean more direct care. The national average is about 3.5 hrs; below 3.0 is a red flag.Rankings are based only on facilities in California that report data for that category. Facilities without available data are excluded from the ranking.Click the rank badge to see the full State ranking.Click here to see the full State ranking.
This facility California avg (4h 13m per day)
vs California avg
+4%

6 of 6 metrics below state avg

Staff typeHours / Day / Residentvs state avg
Registered Nurse (RN) Info RNs hold the highest nursing license and can assess residents, interpret test results, and direct care plans. More RN hours per day often signals stronger clinical oversight and faster response to health changes. 27m per day ▼ 33% State avg: 40m per day · National avg: 41m per day
LPN / LVN Info Licensed Practical Nurses (LPNs) or Licensed Vocational Nurses (LVNs) deliver routine hands-on care — medication administration, wound dressing, and monitoring vital signs. They work under RN supervision and make up a large share of daily bedside care. 1h 6m per day ▼ 9% State avg: 1h 12m per day · National avg: 52m per day
Nurse Aide Info Certified Nurse Aides (CNAs) provide the most direct day-to-day assistance: bathing, dressing, feeding, and mobility. Nurse aide hours are typically the largest staffing category and directly affect residents' quality of life. 2h 33m per day ▼ 4% State avg: 2h 39m per day · National avg: 2h 20m per day
Weekend Total Nursing Info Combined nursing hours (RN + LPN + Nurse Aide) per resident per day on weekends. Staffing often drops on weekends — this figure reveals whether the facility maintains adequate coverage outside of weekday hours. 3h 50m per day ▼ 6% State avg: 4h 5m per day · National avg: 3h 27m per day
Physical Therapist Info Hours per resident per day provided by licensed Physical Therapists (PTs) or PT Assistants. PT services help residents recover mobility after injury or illness and are especially important for post-acute (short-stay) rehabilitation. 4m per day ▼ 32% State avg: 6m per day · National avg: 4m per day
Weekend RN Info Registered nurse hours specifically on weekends. Facilities sometimes reduce RN presence on Saturdays and Sundays — a low weekend RN figure compared to weekday hours can indicate reduced clinical oversight when most administrative staff are absent. 23m per day ▼ 26% State avg: 31m per day · National avg: 29m per day

Capacity and availability

This home usually has limited availability

Higher occupancy than the California average: 84.7%
Occupancy rate
86.8% Rank #414 / 1537Occupancy rate — State benchmarkedThis home is ranked 414th out of 1537 homes in California. Shows this facility's occupancy rate versus the California average, with its Statewide rank out of 1537. Higher occupancy signals strong local demand and financial stability.Rankings are based only on facilities in California that report data for that category. Facilities without available data are excluded from the ranking.Click the rank badge to see the full State ranking.Click here to see the full State ranking.
Avg. Length of Stay
87 days
Bed community size
190-bed community Rank #179 / 1657Bed count — State benchmarkedThis home is ranked 179th out of 1657 homes in California. Shows this facility's certified or reported bed count compared to other California facilities. Larger communities may offer more amenities, programs, and on-site services for residents and families.Rankings are based only on facilities in California that report data for that category. Facilities without available data are excluded from the ranking.Click the rank badge to see the full State ranking.Click here to see the full State ranking.
A large-scale community that may provide a wide range of amenities, services, and structured programs.
Walk Score
Walk Score: 54 / 100 Rank #1242 / 2092Walk Score — State benchmarkedThis home is ranked 1242nd out of 2092 homes in California. Shows how walkable this facility's neighborhood is compared to the average Walk Score across California facilities. Higher scores benefit residents, families, and staff.Rankings are based only on facilities in California that report data for that category. Facilities without available data are excluded from the ranking.Click the rank badge to see the full State ranking.Click here to see the full State ranking.
Moderately walkable. Some errands can be accomplished on foot, with a mix of nearby amenities.

About this community

Therapy & Rehabilitation

2 services
Rehabilitation Services
Short-Term Rehab

Contact Diablo Valley Post Acute

Staffing Data

Reporting period: October 1 – December 31, 2025 (Q4 2025). Source: CMS Payroll-Based Journal report.

Total staff 268
Employees 212
Contractors 56
Staff to resident ratio 1.53 : 1
15% fewer staff per resident than California average
California average ratio: 1.81 : 1 California average ratio: 1.81 : 1See full California ranking
Avg staff/day 109
Average shift 7.8 hours
0% compared with California average
California average: 7.7 hours California average shift: 7.7 hoursSee full California ranking
Total staff hours (quarter) 78,707

Nursing staff breakdown

Q4 2025 · Oct 1 – Dec 31 More info This data comes from the CMS Payroll-Based Journal report covering October 1 – December 31, 2025.
Registered Nurse

Manages medical care and health needs.

RN Staff Info All 18 RN Staff are full-time employees. No contractors work on this role. 18
Average shift length Info Average shift length. Calculated as total hours divided by days worked and average staff per day. 7.7 hours
Licensed Practical Nurse

Assists with medical care and medications.

LPN Staff Info 50 total: 46 full-time employees and 4 contractors. 50
Average shift length Info Average shift length. Calculated as total hours divided by days worked and average staff per day. 7.8 hours
Certified Nursing Assistant

Helps with daily care and mobility.

CNA Staff Info 152 total: 100 full-time employees and 52 contractors. 152
Average shift length Info Average shift length. Calculated as total hours divided by days worked and average staff per day. 8 hours

Contractor staffing

Q4 2025 · Oct 1 – Dec 31 More info This data comes from the CMS Payroll-Based Journal report covering October 1 – December 31, 2025.

Total hours from contractors

6.4%

5,054 contractor hours this quarter

Certified Nursing Assistant: 52 Licensed Practical Nurse: 4

Staff by category

Q4 2025 · Oct 1 – Dec 31 More info This data comes from the CMS Payroll-Based Journal report covering October 1 – December 31, 2025.
Certified Nursing Assistant1005215240,10492100%8
Licensed Practical Nurse4645017,35792100%7.8
Registered Nurse180186,70692100%7.7
Nurse Aide in Training130132,7327683%7.7
Speech Language Pathologist6061,9987986%7.6
Dental Services Staff3031,5336470%8.2
Physical Therapy Assistant6061,1809098%7.4
Respiratory Therapy Technician4041,1648896%6
RN Director of Nursing3031,0946470%8.2
Other Dietary Services Staff2029588491%7.7
Qualified Social Worker3038867885%6.1
Dietitian1015326571%8.2
Therapeutic Recreation Specialist1015236470%8.2
Administrator1015126470%8
Occupational Therapy Aide1014886166%8
Nurse Practitioner1014725964%8
Clinical Nurse Specialist1014005054%8
Physical Therapy Aide20267910%7.5
152 Certified Nursing Assistant
% of Days 100%
50 Licensed Practical Nurse
% of Days 100%
18 Registered Nurse
% of Days 100%
13 Nurse Aide in Training
% of Days 83%
6 Speech Language Pathologist
% of Days 86%
3 Dental Services Staff
% of Days 70%
6 Physical Therapy Assistant
% of Days 98%
4 Respiratory Therapy Technician
% of Days 96%
3 RN Director of Nursing
% of Days 70%
2 Other Dietary Services Staff
% of Days 91%
3 Qualified Social Worker
% of Days 85%
1 Dietitian
% of Days 71%
1 Therapeutic Recreation Specialist
% of Days 70%
1 Administrator
% of Days 70%
1 Occupational Therapy Aide
% of Days 66%
1 Nurse Practitioner
% of Days 64%
1 Clinical Nurse Specialist
% of Days 54%
2 Physical Therapy Aide
% of Days 10%

Penalties and fines

Federal penalties imposed by CMS for regulatory violations, including civil money penalties (fines) and denials of payment for new Medicare/Medicaid admissions.

Source: CMS Penalties Database

No penalties in the past 3 years

No civil money penalties or payment denials were reported in the last 3 years.

Quality of care over time

These measures show how residents usually do over time at this home, based on health outcomes and preventive care.

High-risk clinical events score Info A composite score based on pressure ulcers, falls with injury, weight loss, walking ability decline, and activities of daily living decline. 3.6
45% better than California average

California average: 6.6

Functional decline score Info A composite score based on activities of daily living decline, walking ability decline, and incontinence. 9.1
20% better than California average

California average: 11.3

Long-stay resident measures
Need for Help with Daily Activities Increased Info Percent of long-stay residents whose need for help with daily activities has increased 3.7%
67% better than California average

California average: 11.1%

Walking Ability Worsened Info Percent of long-stay residents whose ability to move independently worsened 6.3%
47% better than California average

California average: 12.0%

Low Risk Residents with Bowel/Bladder Incontinence Info Percent of low risk long-stay residents who lose control of their bowels or bladder 17.3%
53% worse than California average

California average: 11.3%

Falls with Major Injury Info Percent of long-stay residents experiencing one or more falls with major injury 2.9%
74% worse than California average

California average: 1.7%

High Risk Residents with Pressure Ulcers Info Percent of long-stay high risk residents with pressure ulcers 5.0%
In line with California average

California average: 5.0%

Urinary Tract Infection Info Percent of long-stay residents with a urinary tract infection 0.0%
100% better than California average

California average: 1.2%

Lost Too Much Weight Info Percent of long-stay residents who lose too much weight 0.2%
95% better than California average

California average: 4.2%

Depressive Symptoms Info Percent of long-stay residents who have depressive symptoms 4.4%
35% better than California average

California average: 6.7%

Antipsychotic Use Info Percent of long-stay residents who received an antipsychotic medication 9.8%
In line with California average

California average: 10.1%

Pneumococcal Vaccine Info Percent of long-stay residents assessed and appropriately given the pneumococcal vaccine 99.8%
In line with California average

California average: 98.5%

Influenza Vaccine Info Percent of long-stay residents assessed and appropriately given the seasonal influenza vaccine 100.0%
In line with California average

California average: 98.2%

Short-stay resident measures
Pneumococcal Vaccine Info Percent of short-stay residents assessed and appropriately given the pneumococcal vaccine 99.9%
6% better than California average

California average: 94.0%

Antipsychotic medication increase Info Percent of short-stay residents who newly received an antipsychotic medication 1.0%
32% better than California average

California average: 1.5%

Influenza Vaccine Info Percent of short-stay residents assessed and appropriately given the seasonal influenza vaccine 100.0%
7% better than California average

California average: 93.2%

Breakdown by payment type

Medicare

11% of new residents, usually for short-term rehab.

Typical stay 1 - 2 months

Private pay

87% of new residents, often for short stays.

Typical stay 2 - 3 months

Medicaid

2% of new residents, often for long-term daily care.

Typical stay 1 - 2 years

Facility Characteristics

Source: CMS Long-Term Care Facility Characteristics (Data as of Jan 2026)

Total residents 175
Medicare
8
4.6% of residents
Medicaid
125
71.4% of residents
Private pay or other
42
24% of residents
Programs & Services
Residents Group

Residents meet regularly to discuss policies, care quality, and activities

Nurse Aide Training

State-approved Nurse Aide Training and Competency Evaluation Program on-site

Active Resident Council

Organized group of residents that meets regularly to discuss facility policies, quality of life, and activities.

Finances and operations

Based on CMS SNF Cost Report for fiscal year ending in 12/2023.

Privately-owned community
Operated by a single business entity.
Net patient revenue Info Net patient revenue — what the home actually collects for resident care, after contractual allowances, bad debt and discounts are subtracted from its gross charges (CMS cost report, Worksheet G-3). It covers resident care only; money the home earns from other sources is shown separately as "Other income."
$23.9M
Net patient income Info Net patient income: net patient revenue minus the home's total operating expenses. A positive figure means it earns more from resident care than it spends to deliver it; a negative figure means the opposite. It excludes non-operating "other income."
$216.2K
Privately-owned community Operated by a single business entity.
Net patient revenue Info Net patient revenue — what the home actually collects for resident care, after contractual allowances, bad debt and discounts are subtracted from its gross charges (CMS cost report, Worksheet G-3). It covers resident care only; money the home earns from other sources is shown separately as "Other income."
$23.9M Rank #83 / 355Revenue — State benchmarkedThis home is ranked 83rd out of 355 homes in California. Shows this facility's annual revenue compared to the California average. Higher revenue generally means more resources for staffing and capital — read alongside Payroll %.Rankings are based only on facilities in California that report data for that category. Facilities without available data are excluded from the ranking.Click the rank badge to see the full State ranking.Click here to see the full State ranking.
Net patient income Info Net patient income: net patient revenue minus the home's total operating expenses. A positive figure means it earns more from resident care than it spends to deliver it; a negative figure means the opposite. It excludes non-operating "other income."
$216.2K
Other income Info Money the home earns outside of resident care — such as investments, grants, rentals and other non-operating sources (CMS cost report, Worksheet G-3). It is tracked separately from net patient revenue: it is not part of that figure, and it is not included in net patient income.
$3.4K
Payroll costs Info Staff salaries plus wage-related costs — benefits such as payroll taxes, health insurance and retirement — from the home's own accounting records (CMS cost report, Worksheet A). Contract or agency labor is counted separately, under other operating costs. Rank #71 / 355Payroll — State benchmarkedThis home is ranked 71st out of 355 homes in California. Shows total annual staff payroll benchmarked to the California average. Higher payroll investment relative to peers often signals better staffing and less reliance on cheaper contract labor.Rankings are based only on facilities in California that report data for that category. Facilities without available data are excluded from the ranking.Click the rank badge to see the full State ranking.Click here to see the full State ranking.
$10.2M 42.6% of net patient revenue Info Payroll as a share of revenue: staff salaries and wage-related benefits divided by net patient revenue. A higher figure means more of each revenue dollar goes to staff pay. Rank #216 / 355Payroll % — State benchmarkedThis home is ranked 216th out of 355 homes in California. Shows payroll as a percentage of revenue versus the California average. Well-run California facilities typically land around 56–67% — the top third Statewide. Below 25% may signal understaffing or heavy agency use — read with Staffing ratings.Rankings are based only on facilities in California that report data for that category. Facilities without available data are excluded from the ranking.Click the rank badge to see the full State ranking.Click here to see the full State ranking.
Other operating costs Info Everything it costs to run the home apart from payroll — food, utilities, supplies, maintenance, contract labor and administration. Calculated as total operating expense minus payroll (staff salaries and wage-related benefits).
$13.5M
Total costs Info The home's total operating expense for the year — all the costs of running it, salaries included (CMS cost report, Worksheet G-3).
$23.7M

What does this home offer?

Housing options icon

Housing Options: Private / Semi-Private Rooms

Building type icon
Building type icon

Building Type: Single-story

Housekeeping icon
Housekeeping icon

Housekeeping Services

Health Programs icon

Health Programs

Who this home usually serves

TYPE OF STAY

Primarily short stays

Residents typically stay for brief periods, with frequent admissions and discharges throughout the year.

Most new residents arrive under private pay (87% of admissions), and a typical private pay stay runs around 2 - 3 months.

Admissions
565 total

Coverage residents most often arrive under.

Medicare 11%
Private pay 87%
Medicaid 2%
Discharges
582 total

Coverage residents most often leave under.

Medicare 15%
Private pay 84%
Medicaid 1%

Diablo Valley Post Acute Reviews

Kathleen Howard
I had an experience with a CNA named Petal. She was so very helpful with my family member who has dementia. She is patient and caring and funny. She calmed the situation down immediately. She is very good at prioritizing our needs. Thank you Petal

Places of interest near Diablo Valley Post Acute

Address 1.9 miles from city center Info Estimated distance in miles from Concord's city center to Diablo Valley Post Acute's address, calculated via Google Maps.

Calculate Travel Distance to Diablo Valley Post Acute

Add your location

Address

Compare Nursing Homes around Contra Costa County

The information below is reported by the California Department of Social Services and Department of Public Health.

4 facilities compared · CMS & CA Dept. of Health data

The Reutlinger Community
NH
AL
IL
MC
Danville
120
Facility 120
CA AVG 103
Rank #561 / 1657
65.0%
Facility 65.0%
CA AVG 84.7%
Rank #1121 / 1537
-23%
5.32
Facility 5.32
CA AVG 4.22
Rank #27 / 354
-17%+26%
$0
Facility $0
CA AVG $56.5k
Rank #1 / 362
86
Facility 86
CA AVG 81
Rank #630 / 1401
17
Facility 17
CA AVG 50.2
Rank #26 / 361
3.4
Facility 3.4
CA AVG 4.6
Rank #107 / 361
-78A+
30
Facility 30
CA AVG 57
Rank #1720 / 2092
The Reutlinger Community
$21.7M
Facility $21.7M
CA AVG $17.0M
Rank #123 / 355
$11.8M
Facility $11.8M
CA AVG $7.0M
Rank #45 / 355
54.6%
Facility 54.6%
CA AVG 45.2%
Rank #48 / 355
55534
Bayberry Skilled Nursing & Healthcare Center
NH
MC
RC
Concord (Adobe Street)
99
Facility 99
CA AVG 103
Rank #725 / 1657
67.8%
Facility 67.8%
CA AVG 84.7%
Rank #1010 / 1537
-20%
5.01
Facility 5.01
CA AVG 4.22
Rank #44 / 354
-37%+19%
$0
Facility $0
CA AVG $56.5k
Rank #1 / 362
-
18
Facility 18
CA AVG 50.2
Rank #33 / 361
4.5
Facility 4.5
CA AVG 4.6
Rank #210 / 361
-81A+
96
Facility 96
CA AVG 57
Rank #43 / 2092
Gianelle Kaliangara
$10.5M
Facility $10.5M
CA AVG $17.0M
Rank #259 / 355
$6.5M
Facility $6.5M
CA AVG $7.0M
Rank #160 / 355
61.5%
Facility 61.5%
CA AVG 45.2%
Rank #14 / 355
56260
Walnut Creek Skilled Nursing & Rehabilitation Center
NH
Walnut Creek (Rossmoor)
153
Facility 153
CA AVG 103
Rank #330 / 1657
68.6%
Facility 68.6%
CA AVG 84.7%
Rank #987 / 1537
-19%
3.40
Facility 3.40
CA AVG 4.22
Rank #316 / 354
+39%-19%
$0
Facility $0
CA AVG $56.5k
Rank #1 / 362
92
Facility 92
CA AVG 81
Rank #308 / 1401
54
Facility 54
CA AVG 50.2
Rank #248 / 361
3.4
Facility 3.4
CA AVG 4.6
Rank #107 / 361
-105-
56
Facility 56
CA AVG 57
Rank #1180 / 2092
Dorothy Couto
$32.1M
Facility $32.1M
CA AVG $17.0M
Rank #11 / 355
$19.5M
Facility $19.5M
CA AVG $7.0M
Rank #4 / 355
60.7%
Facility 60.7%
CA AVG 45.2%
Rank #184 / 355
56327
Diablo Valley Post Acute
NH
Concord
190
Facility 190
CA AVG 103
Rank #179 / 1657
86.8%
Facility 86.8%
CA AVG 84.7%
Rank #414 / 1537
+2%
4.37
Facility 4.37
CA AVG 4.22
Rank #105 / 354
-25%+4%
$46.8k
Facility $46.8k
CA AVG $56.5k
Rank #309 / 362
-
26
Facility 26
CA AVG 50.2
Rank #86 / 361
3.7
Facility 3.7
CA AVG 4.6
Rank #135 / 361
-182-
54
Facility 54
CA AVG 57
Rank #1242 / 2092
Forrest Allen
$23.9M
Facility $23.9M
CA AVG $17.0M
Rank #83 / 355
$10.2M
Facility $10.2M
CA AVG $7.0M
Rank #71 / 355
42.6%
Facility 42.6%
CA AVG 45.2%
Rank #216 / 355
55150

Financial Assistance for
Nursing Home in California

Diablo Valley Post Acute is located in Concord, California.
Here are the financial assistance programs available to residents in California.

Get Financial aid guidance

Multipurpose Senior Services Program

MSSP (Medi-Cal Waiver)

Age 65+
General California resident, Medi-Cal eligible, nursing home risk.
Income Limits (2025) ~$2,829/month 300% FBR, individual
Asset Limits $2,000 (individual), $3,000 (couple).
CA

County-managed; waitlists possible.

Benefits
In-home support (4-6 hours/day) Respite care (14 days/year) Meals (~$6/meal) Transportation (8 trips/month) Care management

In-Home Supportive Services (IHSS)

California IHSS

Age 65+
General California resident, Medicaid-eligible or low-income.
Income Limits ~$1,732/month individual, Medi-Cal threshold
Asset Limits $2,000 individual
CA

Can hire family as caregivers.

Benefits
Personal care (up to 283 hours/month) Homemaker services Respite (varies)

Multipurpose Senior Services Program (MSSP)

CA MSSP

Age 65+
General California resident, Medi-Cal-eligible, nursing home-eligible but community-capable.
Income Limits ~$2,829/month 300% FBR, individual
Asset Limits $2,000 individual
CA

Available in 38 counties; waitlists common.

Benefits
Case management Respite care (up to 10 days/year) Minor home mods (avg. $500) Adult day care (~$50/day)

Property Tax Postponement Program (PTP)

CA PTP

Age 62+
General California resident, own and live in home, 40% equity.
Income Limits (2025) ~$51,500/year household, adjusted annually
Asset Limits Equity-based; no strict asset cap.
CA

Deferred taxes accrue interest (5% as of 2024); repaid upon sale/death.

Benefits
Property tax deferral (avg. $1,000-$3,000/year, varies by county)

Assisted Living Waiver (ALW)

CA ALW

Age 65+ or disabled
General California resident, Medi-Cal-eligible, nursing home-eligible.
Income Limits ~$2,829/month 300% FBR, individual
Asset Limits $2,000 individual
CA

Available in 15 counties (e.g., LA, Sacramento); waitlists common.

Benefits
Personal care in ALFs (5-7 hours/day) Medication management Social services

California CARES Program

CA CARES

Age
General Caregivers of California residents 60+ needing help with 3+ daily activities; no caregiver age limit.
Income Limits No strict limit; cost-sharing above ~$2,500/month threshold.
Asset Limits Not applicable; need-based.
CA

High demand in urban areas; complements IHSS respite.

Benefits
Respite care (up to 10 days/year) Counseling (4-6 sessions/year) Training (2-3 workshops/year) Supplies (~$200/year)

Frequently Asked Questions about Diablo Valley Post Acute

Is Diablo Valley Post Acute in a walkable area?

Diablo Valley Post Acute has a walk score of 54. Moderately walkable. Some errands can be accomplished on foot, with a mix of nearby amenities.

What is the occupancy rate at Diablo Valley Post Acute?

Diablo Valley Post Acute's occupancy is 86.8%.

Are there photos of Diablo Valley Post Acute?

Yes — there are 9 photos of Diablo Valley Post Acute in the photo gallery on this page.

What is the address of Diablo Valley Post Acute?

Diablo Valley Post Acute is located at 3806 Clayton Rd, Concord, CA 94521.

What is the phone number of Diablo Valley Post Acute?

(925) 689-2266 will put you in contact with the team at Diablo Valley Post Acute.

Is Diablo Valley Post Acute Medicare or Medicaid certified?

Yes — Diablo Valley Post Acute is a CMS-certified provider of Medicare and Medicaid.

Guides for Better Senior Living

Care Cost Calculator: See Prices in Your Area

Nursing Home Data Explorer

Don’t Wait Too Long: 7 Red Flag Signs Your Parent Needs Assisted Living Now

The True Cost of Assisted Living in 2025 – And How Families Are Paying For It

Understanding Senior Living Costs: Pricing Models, Discounts & Financial Assistance