Bethel Senior Living
Nursing Home, Adult Day Care, Assisted Living, Home Care, Hospice Care, Independent Living, Nursing Care & Respite Care · California, CA
CMS overall rating Info CMS (the Centers for Medicare & Medicaid Services) is the federal agency that rates nursing home quality. Its Overall Rating runs from 1 to 5 stars, combining health inspections, staffing, and quality measures, with inspections weighted most heavily.

Bethel Senior Living

Nursing Home, Adult Day Care, Assisted Living, Home Care, Hospice Care, Independent Living, Nursing Care & Respite Care · California, CA
CMS overall rating Info CMS (the Centers for Medicare & Medicaid Services) is the federal agency that rates nursing home quality. Its Overall Rating runs from 1 to 5 stars, combining health inspections, staffing, and quality measures, with inspections weighted most heavily.
Calculator: See prices in your area
Bethel Senior Living accepts Medicare, Medicaid, and private pay.

Overview of Bethel Senior Living

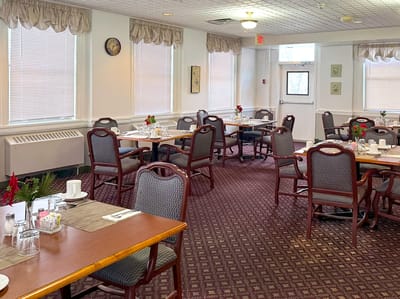
Bethel Lutheran Home owns Bethel Senior Living, a small 33-bed nursing community on Dockery Avenue in Selma, California, operated by Bethel Assisted Living LLC and Bayshire Central Valley LLC. The building houses 23 residents, running at a 71 percent occupancy rate under administrator Benjamin Carter. Stays average 385 days, meaning the daily workload centers mostly on permanent residential care rather than temporary post-hospital therapy.

The surrounding neighborhood provides good pedestrian access, earning a walk score of 83 out of 100, so visitors can easily take care of errands on foot. Inside, the floor crew logs an average of 4 hours and 36 minutes of direct care per resident each day, with nurse aides handling 3 hours and 46 minutes of that total.

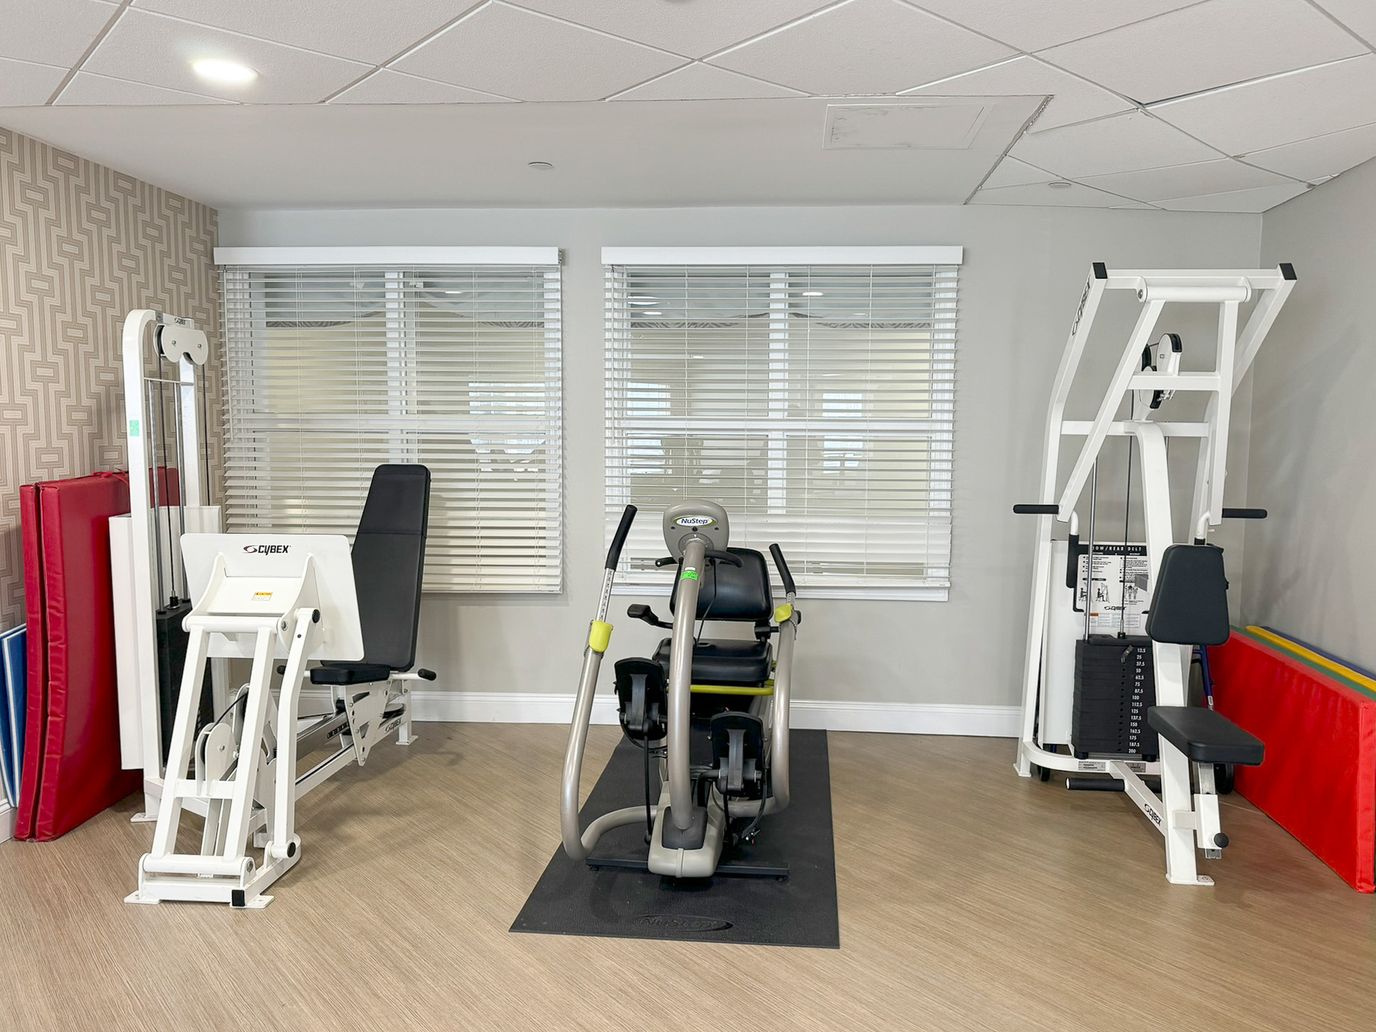
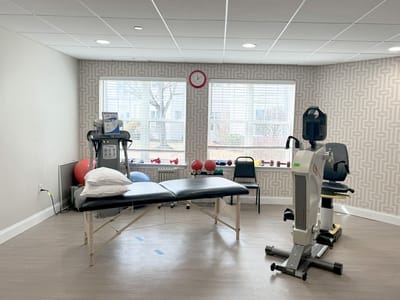
This round-the-clock staff runs physical rehabilitation programs, provides adult day health treatments, and coordinates on-site home care services for the residents. Government health inspectors monitor the property through routine compliance audits to ensure medical records and staffing ratios meet local health codes.

Families can contact the intake desk to verify current room openings or ask how the admission process works. The office staff can also arrange a convenient weekday morning to walk through the grounds and view the communal spaces.

Quality ratings

Measured by Centers for Medicare & Medicaid Services (CMS)

Overall rating Info The Overall CMS Rating combines results from health inspections, staffing levels and quality measures. Health inspections carry the most weight. Staffing and quality scores can increase or decrease the final rating based on performance compared to state and national standards.
▼ 36.5% Below CA avg. ▼ 36.5% Below CA avg.CA average: 3.1Click the badge to see the full State ranking.Click here to see the full State ranking.
Health Inspection Info Based on the results of the facility's three most recent standard inspections and any complaint investigations. CMS reviews the number, scope, and severity of deficiencies, with more recent findings weighted more heavily.
▲ 7.3% Above CA avg. ▲ 7.3% Above CA avg.CA average: 2.8Click the badge to see the full State ranking.Click here to see the full State ranking.
Staffing Info Measures average nursing staff hours per resident per day, including Registered Nurses (RNs) and total nursing staff. Ratings are adjusted based on the level of care residents require and are compared to state and national benchmarks.
▼ 68.1% Below CA avg. ▼ 68.1% Below CA avg.CA average: 3.1Click the badge to see the full State ranking.Click here to see the full State ranking.
Quality Measures Info Based on clinical and physical health indicators reported to CMS, such as hospital readmissions, falls, pressure ulcers, and improvements in mobility. These measures reflect how well residents' health needs are being managed.
▼ 51.0% Below CA avg. ▼ 51.0% Below CA avg.CA average: 4.1Click the badge to see the full State ranking.Click here to see the full State ranking.

Staffing hours breakdown

Info Daily nursing hours per resident by staff type, reported to CMS. Higher is generally better — compare this facility to state and national averages to see where staffing stands.

Hours per resident per day — compared to California state averages

Total nursing care / resident Info This home is ranked 80th out of 354 homes in California for nurse hours. Total adjusted nursing hours per resident per day, combining RN, LPN, and aide time. CMS adjusts this for case-mix so facilities can be fairly compared.
4h 36m per day
Rank #80 / 354Nurse hours — State benchmarkedThis home is ranked 80th out of 354 homes in California. Shows adjusted nurse hours per resident per day benchmarked to the California average, with a ranking across 354 California facilities. More hours mean more direct care. The national average is about 3.5 hrs; below 3.0 is a red flag.Ranking totals vary by category as each rank only includes facilities that report data for that metric. Homes missing that data point aren't included in the ranking.Click the rank badge to see the full State ranking.Click here to see the full State ranking.
This facility California avg (4h 13m per day)
vs California avg
+9%

1 of 1 metrics below state avg

Staff typeHours / Day / Residentvs state avg
Weekend Total Nursing Info Combined nursing hours (RN + LPN + Nurse Aide) per resident per day on weekends. Staffing often drops on weekends — this figure reveals whether the facility maintains adequate coverage outside of weekday hours. 3h 46m per day ▼ 8% State avg: 4h 5m per day · National avg: 3h 27m per day

Capacity and availability

Avg. Length of Stay
385 days
Bed community size
33-bed community Rank #1252 / 1657Bed count — State benchmarkedThis home is ranked 1252nd out of 1657 homes in California. Shows this facility's certified or reported bed count compared to other California facilities. Larger communities may offer more amenities, programs, and on-site services for residents and families.Ranking totals vary by category as each rank only includes facilities that report data for that metric. Homes missing that data point aren't included in the ranking.Click the rank badge to see the full State ranking.Click here to see the full State ranking.
A moderately sized community that may balance personal attention with shared amenities and social activities.
Walk Score
Walk Score: 83 / 100 Rank #338 / 2092Walk Score — State benchmarkedThis home is ranked 338th out of 2092 homes in California. Shows how walkable this facility's neighborhood is compared to the average Walk Score across California facilities. Higher scores benefit residents, families, and staff.Ranking totals vary by category as each rank only includes facilities that report data for that metric. Homes missing that data point aren't included in the ranking.Click the rank badge to see the full State ranking.Click here to see the full State ranking.
Very walkable. Most errands can be accomplished on foot, and many essentials are within a short walk.

About this community

Occupancy

Occupancy rate
71%
Rank #927 / 1537Occupancy rate — State benchmarkedThis home is ranked 927th out of 1537 homes in California. Shows this facility's occupancy rate versus the California average, with its Statewide rank out of 1537. Higher occupancy signals strong local demand and financial stability.Ranking totals vary by category as each rank only includes facilities that report data for that metric. Homes missing that data point aren't included in the ranking.Click the rank badge to see the full State ranking.Click here to see the full State ranking.
Similar to the California average: 72.8%
Occupied beds
23 / 33
Average occupied beds in California homes 87 beds

License Details

Facility TypeResidential Care Elderly
StatusPending
CountyFresno
CMS Certification Number555924

Ownership & Operating Entity

Bethel Senior Living is legally operated by Bethel Asst Living Llc;bayshire Central Valley Llc, and administrated by Benjamin Carter.

Owner NameBethel Asst Living LLC;Bayshire Central Valley LLC

Therapy & Rehabilitation

1 service
Rehabilitation Services

Staffing & Medical

1 service
24-Hour Staffing

Additional Services

2 services
Adult Day Health Services
Home Care

Amenities & Lifestyle

Specific ProgramsBethel Community Management

Contact Bethel Senior Living

Health Inspection History

Inspections since 2022
Total health inspections 5

California average 12.5


Last Health inspection on Aug 2025

Total health citations
45 Rank #204 / 361Health citations — State benchmarkedThis home is ranked 204th out of 361 homes in California. Shows this facility's total health deficiency citations benchmarked to the California State average, with a ranking across all 361 CA facilities. Lower citation counts earn a better rank.Ranking totals vary by category as each rank only includes facilities that report data for that metric. Homes missing that data point aren't included in the ranking.Click the rank badge to see the full State ranking.Click here to see the full State ranking.

California average 50.2

Citations per inspection
9 Rank #350 / 361Citations per inspection — State benchmarkedThis home is ranked 350th out of 361 homes in California. Shows average deficiency citations per CMS inspection for this facility versus the California mean across 361 facilities with citation data. Lower is better.Ranking totals vary by category as each rank only includes facilities that report data for that metric. Homes missing that data point aren't included in the ranking.Click the rank badge to see the full State ranking.Click here to see the full State ranking.

California average 4.65


Health citations are formal notices following inspections when they fail to comply with safety and care standards.

40 of 45 citations resulted from standard inspections; and 5 of 45 resulted from complaint investigations.

Breakdown of citation severity (last 4 years)
Critical health citations
0
100% better than California average

California average: 0.4


Serious health citations
0
100% better than California average

California average: 1

0 critical citations California average: 0.4

0 serious citations California average: 1

42 moderate citations California average: 47.2

3 minor citations California average: 1.5
Citations history (last 4 years)
Care Planning moderate citation Aug 22, 2025
Corrected

Resident Rights moderate citation Aug 22, 2025
Corrected

Administration moderate citation Nov 15, 2024
Corrected

Resident Rights moderate citation Nov 15, 2024
Corrected

Staffing Data

Reporting period: October 1 – December 31, 2025 (Q4 2025). Source: CMS Payroll-Based Journal report.

Total staff 80
Employees 74
Contractors 6
Staff to resident ratio 1.43 : 1
21% fewer staff per resident than California average
California average ratio: 1.81 : 1 California average ratio: 1.81 : 1See full California ranking
Avg staff/day 36
Average shift 6.9 hours
10% worse than California average
California average: 7.7 hours California average shift: 7.7 hoursSee full California ranking
Total staff hours (quarter) 22,962

Nursing staff breakdown

Q4 2025 · Oct 1 – Dec 31 More info This data comes from the CMS Payroll-Based Journal report covering October 1 – December 31, 2025.
Registered Nurse

Manages medical care and health needs.

RN Staff Info All 4 RN Staff are full-time employees. No contractors work on this role. 4
Average shift length Info Average shift length. Calculated as total hours divided by days worked and average staff per day. 6.2 hours
Licensed Practical Nurse

Assists with medical care and medications.

LPN Staff Info All 14 LPN Staff are full-time employees. No contractors work on this role. 14
Average shift length Info Average shift length. Calculated as total hours divided by days worked and average staff per day. 7.5 hours
Certified Nursing Assistant

Helps with daily care and mobility.

CNA Staff Info All 36 CNA Staff are full-time employees. No contractors work on this role. 36
Average shift length Info Average shift length. Calculated as total hours divided by days worked and average staff per day. 7.1 hours

Contractor staffing

Q4 2025 · Oct 1 – Dec 31 More info This data comes from the CMS Payroll-Based Journal report covering October 1 – December 31, 2025.

Total hours from contractors

1%

233 contractor hours this quarter

Speech Language Pathologist: 2 Physical Therapy Aide: 1 Physical Therapy Assistant: 1 Administrator: 1 Medical Director: 1

Staff by category

Q4 2025 · Oct 1 – Dec 31 More info This data comes from the CMS Payroll-Based Journal report covering October 1 – December 31, 2025.
Certified Nursing Assistant3603612,46592100%7.1
Licensed Practical Nurse140144,24992100%7.5
RN Director of Nursing4041,1486773%7.5
Other Dietary Services Staff3031,03292100%7.5
Nurse Practitioner1016808592%8
Speech Language Pathologist3256127582%3.6
Administrator1125286672%8
Dietitian1015006267%8.1
Mental Health Service Worker1014575762%8
Qualified Activities Professional1014196166%6.9
Physical Therapy Aide1123556470%5.5
Registered Nurse4042472022%6.2
Physical Therapy Assistant2131684145%2.8
Clinical Nurse Specialist1015478%7.6
Qualified Social Worker101471516%3.1
Medical Director011333%1
36 Certified Nursing Assistant
% of Days 100%
14 Licensed Practical Nurse
% of Days 100%
4 RN Director of Nursing
% of Days 73%
3 Other Dietary Services Staff
% of Days 100%
1 Nurse Practitioner
% of Days 92%
5 Speech Language Pathologist
% of Days 82%
2 Administrator
% of Days 72%
1 Dietitian
% of Days 67%
1 Mental Health Service Worker
% of Days 62%
1 Qualified Activities Professional
% of Days 66%
2 Physical Therapy Aide
% of Days 70%
4 Registered Nurse
% of Days 22%
3 Physical Therapy Assistant
% of Days 45%
1 Clinical Nurse Specialist
% of Days 8%
1 Qualified Social Worker
% of Days 16%
1 Medical Director
% of Days 3%

Penalties and fines

Federal penalties imposed by CMS for regulatory violations, including civil money penalties (fines) and denials of payment for new Medicare/Medicaid admissions.

Source: CMS Penalties Database

No penalties in the past 3 years

No civil money penalties or payment denials were reported in the last 3 years.

Quality of care over time

These measures show how residents usually do over time at this home, based on health outcomes and preventive care.

High-risk clinical events score Info A composite score based on pressure ulcers, falls with injury, weight loss, walking ability decline, and activities of daily living decline. 10.3
56% worse than California average

California average: 6.6

Functional decline score Info A composite score based on activities of daily living decline, walking ability decline, and incontinence. 22.4
98% worse than California average

California average: 11.3

Long-stay resident measures
Need for Help with Daily Activities Increased Info Percent of long-stay residents whose need for help with daily activities has increased 16.8%
52% worse than California average

California average: 11.1%

Walking Ability Worsened Info Percent of long-stay residents whose ability to move independently worsened 25.2%
110% worse than California average

California average: 12.0%

Low Risk Residents with Bowel/Bladder Incontinence Info Percent of low risk long-stay residents who lose control of their bowels or bladder 25.1%
123% worse than California average

California average: 11.3%

Falls with Major Injury Info Percent of long-stay residents experiencing one or more falls with major injury 5.3%
219% worse than California average

California average: 1.7%

High Risk Residents with Pressure Ulcers Info Percent of long-stay high risk residents with pressure ulcers 0.9%
81% better than California average

California average: 5.0%

Urinary Tract Infection Info Percent of long-stay residents with a urinary tract infection 2.0%
60% worse than California average

California average: 1.2%

Lost Too Much Weight Info Percent of long-stay residents who lose too much weight 3.5%
18% better than California average

California average: 4.2%

Depressive Symptoms Info Percent of long-stay residents who have depressive symptoms 0.0%
100% better than California average

California average: 6.7%

Antipsychotic Use Info Percent of long-stay residents who received an antipsychotic medication 8.6%
15% better than California average

California average: 10.1%

Pneumococcal Vaccine Info Percent of long-stay residents assessed and appropriately given the pneumococcal vaccine 100.0%
In line with California average

California average: 98.5%

Influenza Vaccine Info Percent of long-stay residents assessed and appropriately given the seasonal influenza vaccine 100.0%
In line with California average

California average: 98.2%

Short-stay resident measures
Pneumococcal Vaccine Info Percent of short-stay residents assessed and appropriately given the pneumococcal vaccine 89.4%
5% worse than California average

California average: 94.0%

Antipsychotic medication increase Info Percent of short-stay residents who newly received an antipsychotic medication 0.0%
100% better than California average

California average: 1.5%

Influenza Vaccine Info Percent of short-stay residents assessed and appropriately given the seasonal influenza vaccine 96.3%
In line with California average

California average: 93.2%

Breakdown by payment type

Medicare

38% of new residents, usually for short-term rehab.

Typical stay 1 - 2 months

Private pay

38% of new residents, often for short stays.

Typical stay 2 - 3 years

Medicaid

25% of new residents, often for long-term daily care.

Typical stay 10 - 11 months

Facility Characteristics

Source: CMS Long-Term Care Facility Characteristics (Data as of Jan 2026)

Total residents 56
Medicare
2
3.6% of residents
Medicaid
47
83.9% of residents
Private pay or other
7
12.5% of residents
Programs & Services
Residents Group

Residents meet regularly to discuss policies, care quality, and activities

Nurse Aide Training

State-approved Nurse Aide Training and Competency Evaluation Program on-site

Active Resident Council

Organized group of residents that meets regularly to discuss facility policies, quality of life, and activities.

Finances and operations

Based on CMS SNF Cost Report for fiscal year ending in 12/2023.

Governmental community
Operated by a subsidized facility district.
Net patient revenue Info Net patient revenue — what the home actually collects for resident care, after contractual allowances, bad debt and discounts are subtracted from its gross charges (CMS cost report, Worksheet G-3). It covers resident care only; money the home earns from other sources is shown separately as "Other income."
$7.0M
Net patient income Info Net patient income: net patient revenue minus the home's total operating expenses. A positive figure means it earns more from resident care than it spends to deliver it; a negative figure means the opposite. It excludes non-operating "other income."
-$1.6M
Governmental community Operated by a subsidized facility district.
Net patient revenue Info Net patient revenue — what the home actually collects for resident care, after contractual allowances, bad debt and discounts are subtracted from its gross charges (CMS cost report, Worksheet G-3). It covers resident care only; money the home earns from other sources is shown separately as "Other income."
$7.0M Rank #294 / 355Revenue — State benchmarkedThis home is ranked 294th out of 355 homes in California. Shows this facility's annual revenue compared to the California average. Higher revenue generally means more resources for staffing and capital — read alongside Payroll %.Ranking totals vary by category as each rank only includes facilities that report data for that metric. Homes missing that data point aren't included in the ranking.Click the rank badge to see the full State ranking.Click here to see the full State ranking.
Net patient income Info Net patient income: net patient revenue minus the home's total operating expenses. A positive figure means it earns more from resident care than it spends to deliver it; a negative figure means the opposite. It excludes non-operating "other income."
-$1.6M
Other income Info Money the home earns outside of resident care — such as investments, grants, rentals and other non-operating sources (CMS cost report, Worksheet G-3). It is tracked separately from net patient revenue: it is not part of that figure, and it is not included in net patient income.
$2.3M
Payroll costs Info Staff salaries plus wage-related costs — benefits such as payroll taxes, health insurance and retirement — from the home's own accounting records (CMS cost report, Worksheet A). Contract or agency labor is counted separately, under other operating costs. Rank #293 / 355Payroll — State benchmarkedThis home is ranked 293rd out of 355 homes in California. Shows total annual staff payroll benchmarked to the California average. Higher payroll investment relative to peers often signals better staffing and less reliance on cheaper contract labor.Ranking totals vary by category as each rank only includes facilities that report data for that metric. Homes missing that data point aren't included in the ranking.Click the rank badge to see the full State ranking.Click here to see the full State ranking.
$4.9M 70.3% of net patient revenue Info Payroll as a share of revenue: staff salaries and wage-related benefits divided by net patient revenue. A higher figure means more of each revenue dollar goes to staff pay. Rank #94 / 355Payroll % — State benchmarkedThis home is ranked 94th out of 355 homes in California. Shows payroll as a percentage of revenue versus the California average. Well-run California facilities typically land around 56–67% — the top third Statewide. Below 25% may signal understaffing or heavy agency use — read with Staffing ratings.Ranking totals vary by category as each rank only includes facilities that report data for that metric. Homes missing that data point aren't included in the ranking.Click the rank badge to see the full State ranking.Click here to see the full State ranking.
Other operating costs Info Everything it costs to run the home apart from payroll — food, utilities, supplies, maintenance, contract labor and administration. Calculated as total operating expense minus payroll (staff salaries and wage-related benefits).
$3.7M
Total costs Info The home's total operating expense for the year — all the costs of running it, salaries included (CMS cost report, Worksheet G-3).
$8.6M

Who this home usually serves

TYPE OF STAY

Mix of rehab and long-term care

This home supports both short-term rehab and long-term care, with residents staying for a wide range of durations.

New residents most often arrive under Medicare (38% of admissions), and a typical Medicare stay runs around 1 - 2 months.

Admissions
56 total

Coverage residents most often arrive under.

Medicare 38%
Private pay 38%
Medicaid 25%
Discharges
62 total

Coverage residents most often leave under.

Medicare 36%
Private pay 14%
Medicaid 50%

Places of interest near Bethel Senior Living

Address 0.0 miles from city center Info Estimated distance in miles from Selma's city center to Bethel Senior Living's address, calculated via Google Maps.

Calculate Travel Distance to Bethel Senior Living

Add your location

Address

Compare Nursing Home around California

The information below is reported by the California Department of Social Services and Department of Public Health.

5 facilities compared · CMS & CA Dept. of Health data

OakView Health Center
NH
AL
MC
Thousand Oaks (Mountclef Village)
63
Facility 63
CA AVG 103
Rank #1063 / 1657
79.4%
Facility 79.4%
CA AVG 84.7%
Rank #702 / 1537
-6%
5.21
Facility 5.21
CA AVG 4.22
Rank #31 / 354
-69%+24%
$0
Facility $0
CA AVG $56.5k
Rank #1 / 362
89
Facility 89
CA AVG 81
Rank #461 / 1401
9
Facility 9
CA AVG 50.2
Rank #4 / 361
1.5
Facility 1.5
CA AVG 4.6
Rank #2 / 361
-43A+
20
Facility 20
CA AVG 57
Rank #1846 / 2092
Bouchard Family Revocable Trust
$14.8M
Facility $14.8M
CA AVG $17.0M
Rank #210 / 355
$8.4M
Facility $8.4M
CA AVG $7.0M
Rank #164 / 355
56.8%
Facility 56.8%
CA AVG 45.2%
Rank #82 / 355
555857
The Reutlinger Community
NH
AL
IL
MC
Danville
120
Facility 120
CA AVG 103
Rank #561 / 1657
65.0%
Facility 65.0%
CA AVG 84.7%
Rank #1121 / 1537
-23%
5.32
Facility 5.32
CA AVG 4.22
Rank #27 / 354
-17%+26%
$0
Facility $0
CA AVG $56.5k
Rank #1 / 362
86
Facility 86
CA AVG 81
Rank #630 / 1401
17
Facility 17
CA AVG 50.2
Rank #26 / 361
3.4
Facility 3.4
CA AVG 4.6
Rank #107 / 361
-78A+
30
Facility 30
CA AVG 57
Rank #1720 / 2092
The Reutlinger Community
$21.7M
Facility $21.7M
CA AVG $17.0M
Rank #123 / 355
$11.8M
Facility $11.8M
CA AVG $7.0M
Rank #45 / 355
54.6%
Facility 54.6%
CA AVG 45.2%
Rank #48 / 355
55534
Bayshire Carlsbad
NH
AL
IL
MC
Carlsbad (Palamai)
125
Facility 125
CA AVG 103
Rank #526 / 1657
93.6%
Facility 93.6%
CA AVG 84.7%
Rank #225 / 1537
+11%
3.24
Facility 3.24
CA AVG 4.22
Rank #336 / 354
+54%-23%
$0
Facility $0
CA AVG $56.5k
Rank #1 / 362
79
Facility 79
CA AVG 81
Rank #881 / 1401
26
Facility 26
CA AVG 50.2
Rank #86 / 361
4.3
Facility 4.3
CA AVG 4.6
Rank #196 / 361
-117A+
59
Facility 59
CA AVG 57
Rank #1088 / 2092
Skilled Camino LLC
$12.9M
Facility $12.9M
CA AVG $17.0M
Rank #263 / 355
$5.1M
Facility $5.1M
CA AVG $7.0M
Rank #285 / 355
39.7%
Facility 39.7%
CA AVG 45.2%
Rank #201 / 355
555745
Heritage Gardens
NH
AL
IL
MC
Loma Linda
64
Facility 64
CA AVG 103
Rank #1051 / 1657
85.9%
Facility 85.9%
CA AVG 84.7%
Rank #437 / 1537
+1%
4.44
Facility 4.44
CA AVG 4.22
Rank #105 / 354
-14%+5%
$0
Facility $0
CA AVG $56.5k
Rank #1 / 362
71
Facility 71
CA AVG 81
Rank #1079 / 1401
45
Facility 45
CA AVG 50.2
Rank #204 / 361
3.8
Facility 3.8
CA AVG 4.6
Rank #152 / 361
155A+
47
Facility 47
CA AVG 57
Rank #1422 / 2092
Cotton Family Revocable Trust
$12.3M
Facility $12.3M
CA AVG $17.0M
Rank #241 / 355
$6.3M
Facility $6.3M
CA AVG $7.0M
Rank #235 / 355
51%
Facility 51%
CA AVG 45.2%
Rank #150 / 355
55183
Bethel Senior Living
NH
ADC
AL
HC
IL
NC
RC
Selma
33
Facility 33
CA AVG 103
Rank #1252 / 1657
71.0%
Facility 71.0%
CA AVG 84.7%
Rank #927 / 1537
-16%
4.61
Facility 4.61
CA AVG 4.22
Rank #80 / 354
-44%+9%
$0
Facility $0
CA AVG $56.5k
Rank #1 / 362
-
45
Facility 45
CA AVG 50.2
Rank #204 / 361
9.0
Facility 9.0
CA AVG 4.6
Rank #350 / 361
-51-
83
Facility 83
CA AVG 57
Rank #338 / 2092
Bethel Lutheran Home
$7.0M
Facility $7.0M
CA AVG $17.0M
Rank #294 / 355
$4.9M
Facility $4.9M
CA AVG $7.0M
Rank #293 / 355
70.3%
Facility 70.3%
CA AVG 45.2%
Rank #94 / 355
555924

Financial Assistance for
Nursing Home in California

Bethel Senior Living is located in SELMA, California.
Here are the financial assistance programs available to residents in California.

Get Financial aid guidance

Multipurpose Senior Services Program

MSSP (Medi-Cal Waiver)

Age 65+
General California resident, Medi-Cal eligible, nursing home risk.
Income Limits (2025) ~$2,829/month 300% FBR, individual
Asset Limits $2,000 (individual), $3,000 (couple).
CA

County-managed; waitlists possible.

Benefits
In-home support (4-6 hours/day) Respite care (14 days/year) Meals (~$6/meal) Transportation (8 trips/month) Care management

In-Home Supportive Services (IHSS)

California IHSS

Age 65+
General California resident, Medicaid-eligible or low-income.
Income Limits ~$1,732/month individual, Medi-Cal threshold
Asset Limits $2,000 individual
CA

Can hire family as caregivers.

Benefits
Personal care (up to 283 hours/month) Homemaker services Respite (varies)

Multipurpose Senior Services Program (MSSP)

CA MSSP

Age 65+
General California resident, Medi-Cal-eligible, nursing home-eligible but community-capable.
Income Limits ~$2,829/month 300% FBR, individual
Asset Limits $2,000 individual
CA

Available in 38 counties; waitlists common.

Benefits
Case management Respite care (up to 10 days/year) Minor home mods (avg. $500) Adult day care (~$50/day)

Property Tax Postponement Program (PTP)

CA PTP

Age 62+
General California resident, own and live in home, 40% equity.
Income Limits (2025) ~$51,500/year household, adjusted annually
Asset Limits Equity-based; no strict asset cap.
CA

Deferred taxes accrue interest (5% as of 2024); repaid upon sale/death.

Benefits
Property tax deferral (avg. $1,000-$3,000/year, varies by county)

Assisted Living Waiver (ALW)

CA ALW

Age 65+ or disabled
General California resident, Medi-Cal-eligible, nursing home-eligible.
Income Limits ~$2,829/month 300% FBR, individual
Asset Limits $2,000 individual
CA

Available in 15 counties (e.g., LA, Sacramento); waitlists common.

Benefits
Personal care in ALFs (5-7 hours/day) Medication management Social services

California CARES Program

CA CARES

Age
General Caregivers of California residents 60+ needing help with 3+ daily activities; no caregiver age limit.
Income Limits No strict limit; cost-sharing above ~$2,500/month threshold.
Asset Limits Not applicable; need-based.
CA

High demand in urban areas; complements IHSS respite.

Benefits
Respite care (up to 10 days/year) Counseling (4-6 sessions/year) Training (2-3 workshops/year) Supplies (~$200/year)

Frequently Asked Questions about Bethel Senior Living

Who is the owner of Bethel Senior Living?

The legal owner and operator of Bethel Senior Living is Bethel Asst Living Llc;Bayshire Central Valley Llc.

Is Bethel Senior Living in a walkable area?

Bethel Senior Living has a walk score of 83. Very walkable. Most errands can be accomplished on foot, and many essentials are within a short walk.

What is the occupancy rate at Bethel Senior Living?

Bethel Senior Living's occupancy is 71%.

Who is the administrator of Bethel Senior Living?

Benjamin Carter is the administrator of Bethel Senior Living.

How many beds does Bethel Senior Living have?

Bethel Senior Living has 33 beds.

Has Bethel Senior Living had any recent deficiencies or citations?

Bethel Senior Living has no recently reported deficiencies or citations.

Are there photos of Bethel Senior Living?

Yes — there are 20 photos of Bethel Senior Living in the photo gallery on this page.

Guides for Better Senior Living

Care Cost Calculator: See Prices in Your Area

Nursing Home Data Explorer

Don’t Wait Too Long: 7 Red Flag Signs Your Parent Needs Assisted Living Now

The True Cost of Assisted Living in 2025 – And How Families Are Paying For It

Understanding Senior Living Costs: Pricing Models, Discounts & Financial Assistance