Bishop Gadsden Episcopal Retirement Community
Nursing Home, Assisted Living, Independent Living & Memory Care · Charleston, SC
CMS overall rating Info CMS (the Centers for Medicare & Medicaid Services) is the federal agency that rates nursing home quality. Its Overall Rating runs from 1 to 5 stars, combining health inspections, staffing, and quality measures, with inspections weighted most heavily.

Bishop Gadsden Episcopal Retirement Community

Nursing Home, Assisted Living, Independent Living & Memory Care · Charleston, SC
CMS overall rating Info CMS (the Centers for Medicare & Medicaid Services) is the federal agency that rates nursing home quality. Its Overall Rating runs from 1 to 5 stars, combining health inspections, staffing, and quality measures, with inspections weighted most heavily.
Calculator: See prices in your area
Bishop Gadsden Episcopal Retirement Community accepts Medicare and private pay.

Overview of Bishop Gadsden Episcopal Retirement Community

Located on Bishop Gadsden Way in Charleston, South Carolina, Bishop Gadsden Episcopal Retirement Community is a skilled nursing and rehabilitation facility administered by Jonna Cook. The community serves residents recovering from hospitalization or surgery and those needing ongoing skilled nursing care. Rehabilitation services, respite care, and 24-hour nursing support are central to the care model. Families can choose from Medicare and private pay to cover rehabilitation stays.

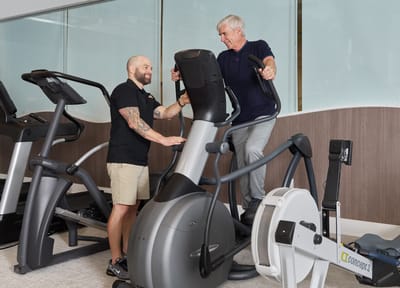
The facility mainly supports short-term recovery. Residents stay an average of 20 days, although longer-term care is also available. Nurse staffing averages 5 hours and 34 minutes per resident each day. Registered nurses, nurse aides, and licensed practical nurses provide this hands-on support because of the home’s strong focus on daily care.

A 2023 annual state inspection found no health deficiencies, which shows strong standards during that review. State oversight has identified periodic areas for improvement in clinical documentation, infection control practices, medication safety, and monitoring systems. The facility has been working on these operational areas.

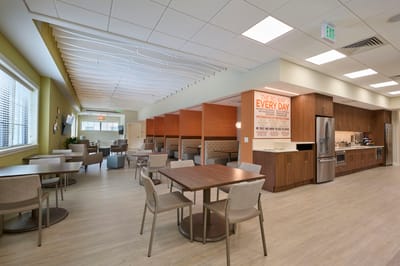
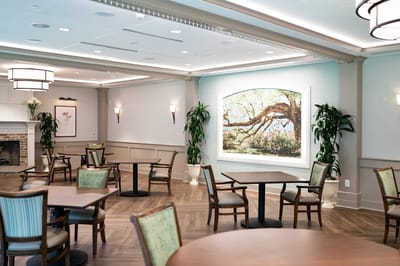
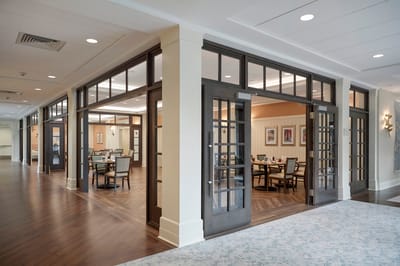
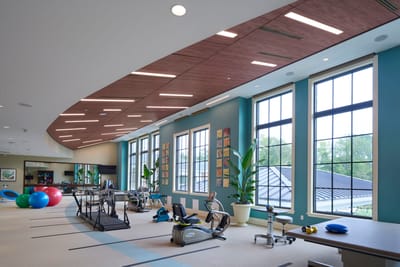
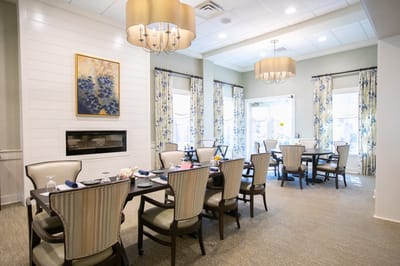
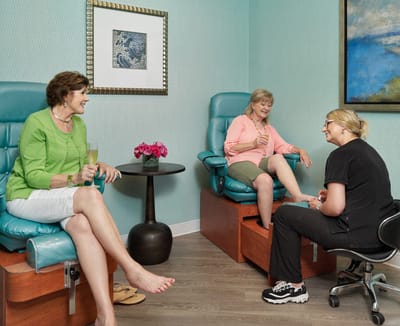
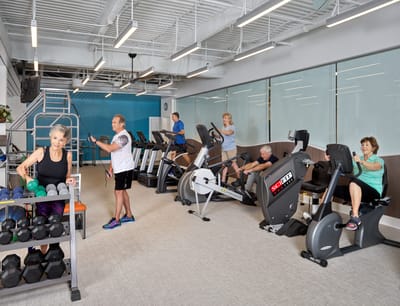
Beyond clinical care, residents have access to a wide range of amenities and services. A Wellness Center and on-site clinic with pharmacy support reduces the need for outside appointments. The dining program features fresh, locally sourced ingredients and includes both casual café and fine-dining options.

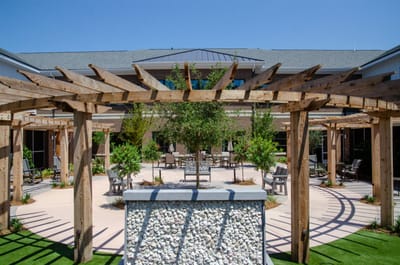
Residents can also enjoy a spa, community garden, nature trails, and a croquet court. Specialized programs such as BG Therapy, BG At Home, and the Embark Program further support recovery and quality of life during a resident’s rehabilitation and stay.

With 123 beds, the community has a midsize setting, which balances personalized care with a broad range of services and amenities.

Quality ratings

Measured by Centers for Medicare & Medicaid Services (CMS)

Overall rating Info The Overall CMS Rating combines results from health inspections, staffing levels and quality measures. Health inspections carry the most weight. Staffing and quality scores can increase or decrease the final rating based on performance compared to state and national standards.
▲ 75.8% Above SC avg. ▲ 75.8% Above SC avg.SC average: 2.8Click the badge to see the full State ranking.Click here to see the full State ranking.
Health Inspection Info Based on the results of the facility's three most recent standard inspections and any complaint investigations. CMS reviews the number, scope, and severity of deficiencies, with more recent findings weighted more heavily.
▲ 45.9% Above SC avg. ▲ 45.9% Above SC avg.SC average: 2.7Click the badge to see the full State ranking.Click here to see the full State ranking.
Staffing Info Measures average nursing staff hours per resident per day, including Registered Nurses (RNs) and total nursing staff. Ratings are adjusted based on the level of care residents require and are compared to state and national benchmarks.
▲ 72.9% Above SC avg. ▲ 72.9% Above SC avg.SC average: 2.9Click the badge to see the full State ranking.Click here to see the full State ranking.
Quality Measures Info Based on clinical and physical health indicators reported to CMS, such as hospital readmissions, falls, pressure ulcers, and improvements in mobility. These measures reflect how well residents' health needs are being managed.
▲ 48.7% Above SC avg. ▲ 48.7% Above SC avg.SC average: 3.4Click the badge to see the full State ranking.Click here to see the full State ranking.

Staffing hours breakdown

Info Daily nursing hours per resident by staff type, reported to CMS. Higher is generally better — compare this facility to state and national averages to see where staffing stands.

Hours per resident per day — compared to South Carolina state averages

Total nursing care / resident Info This home is ranked 8th out of 121 homes in South Carolina for nurse hours. Total adjusted nursing hours per resident per day, combining RN, LPN, and aide time. CMS adjusts this for case-mix so facilities can be fairly compared.
5h 34m per day
Rank #8 / 121Nurse hours — State benchmarkedThis home is ranked 8th out of 121 homes in South Carolina. Shows adjusted nurse hours per resident per day benchmarked to the South Carolina average, with a ranking across 121 South Carolina facilities. More hours mean more direct care. The national average is about 3.5 hrs; below 3.0 is a red flag.Rankings are based only on facilities in South Carolina that report data for that category. Facilities without available data are excluded from the ranking.Click the rank badge to see the full State ranking.Click here to see the full State ranking.
This facility South Carolina avg (4h 0m per day)
vs South Carolina avg
+39%

0 of 6 metrics below state avg

Standout metric Weekend RN is +195% above state avg
Staff typeHours / Day / Residentvs state avg
Registered Nurse (RN) Info RNs hold the highest nursing license and can assess residents, interpret test results, and direct care plans. More RN hours per day often signals stronger clinical oversight and faster response to health changes. 1h 27m per day ▲ 130% State avg: 38m per day · National avg: 41m per day
LPN / LVN Info Licensed Practical Nurses (LPNs) or Licensed Vocational Nurses (LVNs) deliver routine hands-on care — medication administration, wound dressing, and monitoring vital signs. They work under RN supervision and make up a large share of daily bedside care. 1h 17m per day ▲ 26% State avg: 1h 1m per day · National avg: 52m per day
Nurse Aide Info Certified Nurse Aides (CNAs) provide the most direct day-to-day assistance: bathing, dressing, feeding, and mobility. Nurse aide hours are typically the largest staffing category and directly affect residents' quality of life. 2h 51m per day ▲ 29% State avg: 2h 13m per day · National avg: 2h 21m per day
Weekend Total Nursing Info Combined nursing hours (RN + LPN + Nurse Aide) per resident per day on weekends. Staffing often drops on weekends — this figure reveals whether the facility maintains adequate coverage outside of weekday hours. 5h 11m per day ▲ 55% State avg: 3h 20m per day · National avg: 3h 26m per day
Physical Therapist Info Hours per resident per day provided by licensed Physical Therapists (PTs) or PT Assistants. PT services help residents recover mobility after injury or illness and are especially important for post-acute (short-stay) rehabilitation. 14m per day ▲ 185% State avg: 5m per day · National avg: 4m per day
Weekend RN Info Registered nurse hours specifically on weekends. Facilities sometimes reduce RN presence on Saturdays and Sundays — a low weekend RN figure compared to weekday hours can indicate reduced clinical oversight when most administrative staff are absent. 1h 11m per day ▲ 195% State avg: 24m per day · National avg: 29m per day

Capacity and availability

Avg. Length of Stay
20 days
Bed community size
123-bed community Rank #59 / 309Bed count — State benchmarkedThis home is ranked 59th out of 309 homes in South Carolina. Shows this facility's certified or reported bed count compared to other South Carolina facilities. Larger communities may offer more amenities, programs, and on-site services for residents and families.Rankings are based only on facilities in South Carolina that report data for that category. Facilities without available data are excluded from the ranking.Click the rank badge to see the full State ranking.Click here to see the full State ranking.
A larger shared setting that may offer more common spaces and organized community services.

About this community

License Details

Facility TypeHl- Community Residential Care Facility
StatusActive
CountyCharleston
License NumberCRC-0451
Business TypeNon-Profit Corporation
CMS Certification Number425411

Ownership & Operating Entity

Bishop Gadsden Episcopal Retirement Community is legally operated by Bishop Gadsden Episcopal Retirement Community, and administered by Jonna Cook.

Owner NameBishop Gadsden Episcopal Retirement Community

Staffing

Key information about the people who lead and staff this community.

Leadership

ContactMr. C. William Trawick, Executive Director
Administrator Emailjonna.cook@bishopgadsden.org

Staff Details

Total Employees
190
Full-Time Employees
190

Therapy & Rehabilitation

2 services
Rehabilitation Services
Respite Care

Staffing & Medical

1 service
24-Hour Staffing

Memory & Specialized Care

1 service
Dedicated Alzheimer's Unit

Contact Information

Amenities & Lifestyle

Wellness Center
Spa
Community Garden
Nature Trails
Croquet Court
On-Site Clinic
Pharmacy
Dining Options
Activities
Specific ProgramsSkilled Care, Short Term Rehab, BG Therapy, BG At Home, The Embark Program, Calendar of Events, Culinary
Religious Services
Volunteer Program

Contact Bishop Gadsden Episcopal Retirement Community

Inspection History

In South Carolina, the Department of Public Health, Bureau of Healthcare Quality conducts unannounced inspections to ensure care providers meet all health and safety codes.

Since 2022 · 4 years of data 11 deficiencies

Inspection Scorecard Info This scorecard compares key inspection, deficiency, and complaint metrics at this facility against the South Carolina state average. Metrics rated ≥15% worse than average are highlighted in red; those ≥15% better are highlighted in green.

Since 2022 vs. South Carolina state average
Overall vs. SC average 0 Worse No metrics in this bucket. 2 Better Metrics better than South Carolina average:
• Total deficiencies (8% below)
• Deficiencies per year (7% below)
Latest Inspection April 25, 2025 Routine

Deficiencies Info Deficiencies are formal regulatory issues recorded during state inspections.

This FacilitySC Averagevs. SC Avg
Total deficiencies Info Formal regulatory issues recorded by inspectors across all inspection types. 1112 This facility has 8% fewer total deficiencies than a typical South Carolina nursing home (11 vs. SC avg 12).↓ 8% better
Deficiencies per year Info Average deficiencies per year since 2022. 2.83 This facility has 7% fewer deficiencies per year than a typical South Carolina nursing home (2.8 vs. SC avg 3).↓ 7% better

Inspection Reports Summary Info An editor-reviewed summary of the themes and findings across this facility's recent inspection reports.

  • The September 25, 2023 annual inspection found no health deficiencies.
  • The February 17, 2022 inspection cited immediate jeopardy for inadequate COVID-19 screening and multiple medication, food safety, and infection control failures.
  • The April 25, 2025 inspection found four deficiencies involving catheter care, wander guard monitoring, pain management, and oxygen therapy documentation.

Health Inspection History

Inspections since 2022
Total health inspections 3

South Carolina average 3.9


Last Health inspection on Apr 2025

Total health citations
10 Rank #49 / 122Health citations — State benchmarkedThis home is ranked 49th out of 122 homes in South Carolina. Shows this facility's total health deficiency citations benchmarked to the South Carolina State average, with a ranking across all 122 SC facilities. Lower citation counts earn a better rank.Rankings are based only on facilities in South Carolina that report data for that category. Facilities without available data are excluded from the ranking.Click the rank badge to see the full State ranking.Click here to see the full State ranking.

South Carolina average 13.7

Citations per inspection
3.33 Rank #65 / 122Citations per inspection — State benchmarkedThis home is ranked 65th out of 122 homes in South Carolina. Shows average deficiency citations per CMS inspection for this facility versus the South Carolina mean across 122 facilities with citation data. Lower is better.Rankings are based only on facilities in South Carolina that report data for that category. Facilities without available data are excluded from the ranking.Click the rank badge to see the full State ranking.Click here to see the full State ranking.

South Carolina average 3.44


Health citations are formal notices following inspections when they fail to comply with safety and care standards.

All 10 citations resulted from standard inspections.

Breakdown of citation severity (last 4 years)
Critical health citations
1
In line with South Carolina average

South Carolina average: 1


Serious health citations
0
100% better than South Carolina average

South Carolina average: 0.3

1 critical citation South Carolina average: 1

0 serious citations South Carolina average: 0.3

9 moderate citations South Carolina average: 12.3

0 minor citations South Carolina average: 0.1
Citations history (last 4 years)
Quality of Care moderate citation Apr 25, 2025
Corrected

Care Planning moderate citation Apr 25, 2025
Corrected

Care Planning moderate citation Apr 25, 2025
Corrected

Nursing Services moderate citation Mar 20, 2024
Corrected

Staffing Data

Reporting period: October 1 – December 31, 2025 (Q4 2025). Source: CMS Payroll-Based Journal report.

Total staff 206
Employees 154
Contractors 52
Staff to resident ratio 9.36 : 1
410% more staff per resident than South Carolina average
South Carolina average ratio: 1.84 : 1 South Carolina average ratio: 1.84 : 1See full South Carolina ranking
Avg staff/day 69
Average shift 2.6 hours
67% worse than South Carolina average
South Carolina average: 7.9 hours South Carolina average shift: 7.9 hoursSee full South Carolina ranking
Total staff hours (quarter) 16,245

Nursing staff breakdown

Q4 2025 · Oct 1 – Dec 31 More info This data comes from the CMS Payroll-Based Journal report covering October 1 – December 31, 2025.
Registered Nurse

Manages medical care and health needs.

RN Staff Info 31 total: 29 full-time employees and 2 contractors. 31
Average shift length Info Average shift length. Calculated as total hours divided by days worked and average staff per day. 3.4 hours
Licensed Practical Nurse

Assists with medical care and medications.

LPN Staff Info 36 total: 20 full-time employees and 16 contractors. 36
Average shift length Info Average shift length. Calculated as total hours divided by days worked and average staff per day. 3.2 hours
Certified Nursing Assistant

Helps with daily care and mobility.

CNA Staff Info 91 total: 64 full-time employees and 27 contractors. 91
Average shift length Info Average shift length. Calculated as total hours divided by days worked and average staff per day. 2.3 hours

Contractor staffing

Q4 2025 · Oct 1 – Dec 31 More info This data comes from the CMS Payroll-Based Journal report covering October 1 – December 31, 2025.

Total hours from contractors

5.9%

960 contractor hours this quarter

Certified Nursing Assistant: 27 Licensed Practical Nurse: 16 Medical Director: 3 Registered Nurse: 2 Feeding Assistant: 2 Qualified Social Worker: 1 Occupational Therapy Assistant: 1

Staff by category

Q4 2025 · Oct 1 – Dec 31 More info This data comes from the CMS Payroll-Based Journal report covering October 1 – December 31, 2025.
Certified Nursing Assistant6427916,80192100%2.3
Registered Nurse292313,08892100%3.4
Licensed Practical Nurse2016362,76492100%3.2
Respiratory Therapy Technician100105667582%2.4
Speech Language Pathologist7075007683%1.9
Qualified Social Worker4154157582%2.1
RN Director of Nursing2022846672%2.3
Mental Health Service Worker2022736571%2.3
Physical Therapy Assistant3032687885%1.8
Feeding Assistant0222586571%2.3
Clinical Nurse Specialist3032386267%2.3
Occupational Therapy Aide1011466470%2.3
Nurse Practitioner1011396166%2.3
Administrator1011305762%2.3
Medical Director0331276166%2
Physical Therapy Aide2021075661%1.9
Respiratory Therapist303794650%1.7
Dietitian101532729%1.9
Other Dietary Services Staff101522%2.6
Occupational Therapy Assistant011433%1.4
91 Certified Nursing Assistant
% of Days 100%
31 Registered Nurse
% of Days 100%
36 Licensed Practical Nurse
% of Days 100%
10 Respiratory Therapy Technician
% of Days 82%
7 Speech Language Pathologist
% of Days 83%
5 Qualified Social Worker
% of Days 82%
2 RN Director of Nursing
% of Days 72%
2 Mental Health Service Worker
% of Days 71%
3 Physical Therapy Assistant
% of Days 85%
2 Feeding Assistant
% of Days 71%
3 Clinical Nurse Specialist
% of Days 67%
1 Occupational Therapy Aide
% of Days 70%
1 Nurse Practitioner
% of Days 66%
1 Administrator
% of Days 62%
3 Medical Director
% of Days 66%
2 Physical Therapy Aide
% of Days 61%
3 Respiratory Therapist
% of Days 50%
1 Dietitian
% of Days 29%
1 Other Dietary Services Staff
% of Days 2%
1 Occupational Therapy Assistant
% of Days 3%

Penalties and fines

Federal penalties imposed by CMS for regulatory violations, including civil money penalties (fines) and denials of payment for new Medicare/Medicaid admissions.

Source: CMS Penalties Database

No penalties in the past 3 years

No civil money penalties or payment denials were reported in the last 3 years.

Quality of care over time

These measures show how residents usually do over time at this home, based on health outcomes and preventive care.

Short-stay resident measures
Significantly above average South Carolina avg: 2.8 Info CMS star rating based on short-stay quality measure performance. 5 stars = much above average, 1 star = much below average.
Pneumococcal Vaccine Info Percent of short-stay residents assessed and appropriately given the pneumococcal vaccine 99.9%
26% better than South Carolina average

South Carolina average: 79.5%

Antipsychotic medication increase Info Percent of short-stay residents who newly received an antipsychotic medication 0.9%
47% better than South Carolina average

South Carolina average: 1.7%

Influenza Vaccine Info Percent of short-stay residents assessed and appropriately given the seasonal influenza vaccine 92.0%
18% better than South Carolina average

South Carolina average: 78.0%

Re-hospitalized after SNF stay Info Percentage of short-stay residents who were re-hospitalized after their nursing home admission. 20.1%
19% better than South Carolina average

South Carolina average: 24.7%

Emergency department visits Info Percentage of short-stay residents who had an outpatient emergency department visit. 14.9%
6% worse than South Carolina average

South Carolina average: 14.1%

Falls with major injury Info Percentage of SNF residents who experience falls with major injury during their stay. 0.7%
10% better than South Carolina average

South Carolina average: 0.8%

Ability to care for self at discharge Info Percentage of residents at or above expected ability to care for themselves at discharge. 72.7%
35% better than South Carolina average

South Carolina average: 53.7%

Successful return to home or community Info Rate of successful return to home or community from a skilled nursing facility. 65.1%
29% better than South Carolina average

South Carolina average: 50.6%

Breakdown by payment type

Medicare

63% of new residents, usually for short-term rehab.

Typical stay 19 days

Private pay

37% of new residents, often for short stays.

Typical stay 5 - 6 months

Facility Characteristics

Source: CMS Long-Term Care Facility Characteristics (Data as of Jan 2026)

Total residents 22
Medicare
22
100% of residents
Programs & Services
Residents Group

Residents meet regularly to discuss policies, care quality, and activities

CCRC

Part of a Continuing Care Retirement Community offering multiple care levels

Active Resident Council

Organized group of residents that meets regularly to discuss facility policies, quality of life, and activities.

Finances and operations

Based on CMS SNF Cost Report for fiscal year ending in 12/2023.

Nonprofit
Nonprofit Corporation
Net patient revenue Info Net patient revenue — what the home actually collects for resident care, after contractual allowances, bad debt and discounts are subtracted from its gross charges (CMS cost report, Worksheet G-3). It covers resident care only; money the home earns from other sources is shown separately as "Other income."
$51.8M
Net patient income Info Net patient income: net patient revenue minus the home's total operating expenses. A positive figure means it earns more from resident care than it spends to deliver it; a negative figure means the opposite. It excludes non-operating "other income."
-$15.2M
Nonprofit Nonprofit Corporation
Net patient revenue Info Net patient revenue — what the home actually collects for resident care, after contractual allowances, bad debt and discounts are subtracted from its gross charges (CMS cost report, Worksheet G-3). It covers resident care only; money the home earns from other sources is shown separately as "Other income."
$51.8M Rank #1 / 125Revenue — State benchmarkedThis home is ranked 1st out of 125 homes in South Carolina. Shows this facility's annual revenue compared to the South Carolina average. Higher revenue generally means more resources for staffing and capital — read alongside Payroll %.Rankings are based only on facilities in South Carolina that report data for that category. Facilities without available data are excluded from the ranking.Click the rank badge to see the full State ranking.Click here to see the full State ranking.
Net patient income Info Net patient income: net patient revenue minus the home's total operating expenses. A positive figure means it earns more from resident care than it spends to deliver it; a negative figure means the opposite. It excludes non-operating "other income."
-$15.2M
Other income Info Money the home earns outside of resident care — such as investments, grants, rentals and other non-operating sources (CMS cost report, Worksheet G-3). It is tracked separately from net patient revenue: it is not part of that figure, and it is not included in net patient income.
$16.4M
Payroll costs Info Staff salaries plus wage-related costs — benefits such as payroll taxes, health insurance and retirement — from the home's own accounting records (CMS cost report, Worksheet A). Contract or agency labor is counted separately, under other operating costs. Rank #1 / 125Payroll — State benchmarkedThis home is ranked 1st out of 125 homes in South Carolina. Shows total annual staff payroll benchmarked to the South Carolina average. Higher payroll investment relative to peers often signals better staffing and less reliance on cheaper contract labor.Rankings are based only on facilities in South Carolina that report data for that category. Facilities without available data are excluded from the ranking.Click the rank badge to see the full State ranking.Click here to see the full State ranking.
$30.8M 59.5% of net patient revenue Info Payroll as a share of revenue: staff salaries and wage-related benefits divided by net patient revenue. A higher figure means more of each revenue dollar goes to staff pay. Rank #87 / 125Payroll % — State benchmarkedThis home is ranked 87th out of 125 homes in South Carolina. Shows payroll as a percentage of revenue versus the South Carolina average. Well-run South Carolina facilities typically land around 53–64% — the top third Statewide. Below 25% may signal understaffing or heavy agency use — read with Staffing ratings.Rankings are based only on facilities in South Carolina that report data for that category. Facilities without available data are excluded from the ranking.Click the rank badge to see the full State ranking.Click here to see the full State ranking.
Other operating costs Info Everything it costs to run the home apart from payroll — food, utilities, supplies, maintenance, contract labor and administration. Calculated as total operating expense minus payroll (staff salaries and wage-related benefits).
$36.2M
Total costs Info The home's total operating expense for the year — all the costs of running it, salaries included (CMS cost report, Worksheet G-3).
$67.0M

Who this home usually serves

TYPE OF STAY

Mostly short-term rehab stays

Most residents typically stay for a few weeks or months before returning home or moving on.

Most new residents arrive under Medicare (63% of admissions), and a typical Medicare stay runs around 19 days.

Admissions
403 total

Coverage residents most often arrive under.

Medicare 63%
Private pay 37%
Discharges
377 total

Coverage residents most often leave under.

Medicare 60%
Private pay 40%

Places of interest near Bishop Gadsden Episcopal Retirement Community

Address 1 Bishop Gadsden Way, Charleston, SC 29412-3506

Calculate Travel Distance to Bishop Gadsden Episcopal Retirement Community

Add your location

Address

Compare Nursing Homes around Charleston

The information below is reported by the South Carolina Department of Public Health, Bureau of Healthcare Quality.

5 facilities compared · CMS & SC Dept. of Health data

Nhc Healthcare Charleston
NH
HC
NC
Charleston
132
Facility 132
SC AVG 90
Rank #37 / 309
77.1%
Facility 77.1%
SC AVG 82.1%
Rank #93 / 131
-6%
5.09
Facility 5.09
SC AVG 4.00
Rank #12 / 121
+37%+27%
$0
Facility $0
SC AVG $34.8k
Rank #1 / 123
4
Facility 4
SC AVG 13.7
Rank #8 / 122
2.0
Facility 2.0
SC AVG 3.4
Rank #14 / 122
-81A+-Gregory Bartlett
$16.1M
Facility $16.1M
SC AVG $13.0M
Rank #19 / 125
$9.1M
Facility $9.1M
SC AVG $5.4M
Rank #15 / 125
56.3%
Facility 56.3%
SC AVG 44%
Rank #70 / 125
425381
Bishop Gadsden Episcopal Retirement Community
NH
AL
IL
MC
Charleston
123
Facility 123
SC AVG 90
Rank #59 / 309
--
5.57
Facility 5.57
SC AVG 4.00
Rank #8 / 121
+61%+39%
$0
Facility $0
SC AVG $34.8k
Rank #1 / 123
10
Facility 10
SC AVG 13.7
Rank #49 / 122
3.3
Facility 3.3
SC AVG 3.4
Rank #65 / 122
126--Lynne L Kerrison
$51.8M
Facility $51.8M
SC AVG $13.0M
Rank #1 / 125
$30.8M
Facility $30.8M
SC AVG $5.4M
Rank #1 / 125
59.5%
Facility 59.5%
SC AVG 44%
Rank #87 / 125
425411
Kempton of Charleston
NH
AL
MC
Charleston
89
Facility 89
SC AVG 90
Rank #142 / 309
60.5%
Facility 60.5%
SC AVG 82.1%
Rank #115 / 131
-26%
4.44
Facility 4.44
SC AVG 4.00
Rank #32 / 121
+8%+11%
$6.0k
Facility $6.0k
SC AVG $34.8k
Rank #63 / 123
4
Facility 4
SC AVG 13.7
Rank #8 / 122
2.0
Facility 2.0
SC AVG 3.4
Rank #14 / 122
-20--Spring Street Senior Housing Opco LLC
$6.3M
Facility $6.3M
SC AVG $13.0M
Rank #109 / 125
$4.8M
Facility $4.8M
SC AVG $5.4M
Rank #97 / 125
75.9%
Facility 75.9%
SC AVG 44%
Rank #17 / 125
425418
Wellmore of Daniel Island
NH
AL
IL
MC
NC
Charleston (Daniel Island)
174
Facility 174
SC AVG 90
Rank #16 / 309
29.3%
Facility 29.3%
SC AVG 82.1%
Rank #125 / 131
-64%
4.60
Facility 4.60
SC AVG 4.00
Rank #23 / 121
+3%+15%
$12.7k
Facility $12.7k
SC AVG $34.8k
Rank #85 / 123
18
Facility 18
SC AVG 13.7
Rank #96 / 122
3.6
Facility 3.6
SC AVG 3.4
Rank #73 / 122
148-
12
Facility 12
SC AVG 32
Rank #185 / 232
Wdi Parent LLC
$7.7M
Facility $7.7M
SC AVG $13.0M
Rank #21 / 125
$6.9M
Facility $6.9M
SC AVG $5.4M
Rank #31 / 125
89.2%
Facility 89.2%
SC AVG 44%
Rank #101 / 125
425414
Ashley River Healthcare
NH
Charleston (Sandhurst)
125
Facility 125
SC AVG 90
Rank #56 / 309
69.9%
Facility 69.9%
SC AVG 82.1%
Rank #106 / 131
-15%
3.77
Facility 3.77
SC AVG 4.00
Rank #61 / 121
-41%-6%
$46.2k
Facility $46.2k
SC AVG $34.8k
Rank #115 / 123
27
Facility 27
SC AVG 13.7
Rank #114 / 122
5.4
Facility 5.4
SC AVG 3.4
Rank #110 / 122
397-
45
Facility 45
SC AVG 32
Rank #60 / 232
-
$8.9M
Facility $8.9M
SC AVG $13.0M
Rank #107 / 125
$5.8M
Facility $5.8M
SC AVG $5.4M
Rank #81 / 125
65.2%
Facility 65.2%
SC AVG 44%
Rank #4 / 125
425362

Financial Assistance for
Nursing Home in South Carolina

Bishop Gadsden Episcopal Retirement Community is located in CHARLESTON, South Carolina.
Here are the financial assistance programs available to residents in South Carolina.

Get Financial aid guidance

Community Long Term Care (CLTC)

SC Medicaid CLTC

Age 65+ or disabled
General South Carolina resident, Medicaid-eligible, nursing home-level care need.
Income Limits (2025) ~$2,829/month 300% FBR, individual
Asset Limits $2,000 (individual), $3,000 (couple).
SC

High rural demand; waitlists possible.

Benefits
Personal care (5-7 hours/day) Respite (240 hours/year) Adult day care ($60/day) Home modifications ($1,500 avg.)

South Carolina Respite Care Program

SC NFCSP Respite

Age Caregiver of someone 60+ (or with dementia)
General South Carolina resident.
Income Limits No strict limit; prioritizes low-income.
Asset Limits Not applicable.
SC

Limited slots; rural/urban balance.

Benefits
In-home respite (4-6 hours/day) Adult day care (~$60/day) Short-term facility care (up to 5 days)

Medicare Savings Program (MSP)

South Carolina Medicare Savings Program

Age 65+ or disabled
General SC resident, Medicare Part A/B.
Income Limits (2025) ~$2,510/month (QMB), ~$3,380/month (SLMB), ~$3,598/month (QI)—individual.
Asset Limits $9,430 (individual), $14,130 (couple).
SC

Three tiers; includes Extra Help for Part D; no waitlist.

Benefits
Covers Part B premiums ($174.70/month) Deductibles ($240/year) Copays (~20%)

VA Aid and Attendance (A&A) and Housebound Benefits

South Carolina VA Aid and Attendance/Housebound

Age 65+ or disabled veteran/spouse
General SC resident, wartime service, need for ADL help (A&A) or homebound.
Income Limits (2025) Net income < ~$1,984/month (veteran with dependent, A&A); pension offsets income.
Asset Limits ~$155,356 net worth limit
SC

High veteran population; supports rural/urban care needs.

Benefits
Cash (~$1,433-$2,642/month veteran, ~$951-$1,318 spouse) for care costs (e.g., in-home, assisted living)

Senior Farmers’ Market Nutrition Program (SFMNP)

South Carolina SFMNP

Age 60+
General SC resident, low-income.
Income Limits (2025) ~$2,322/month individual, 185% FPL
Asset Limits Not assessed.
SC

Vouchers (~$50/season); serves ~20,000 annually via 10 AAAs.

Benefits
Vouchers (~$50/season) for fresh produce at approved markets

Homestead Exemption Program

South Carolina Homestead Exemption

Age 65+ (or disabled/blind)
General SC resident 1+ year, homeowner.
Income Limits (2025) None; tax-based eligibility.
Asset Limits Not assessed; home-focused.
SC

Saves ~$500-$1,000/year avg.; applies to primary residence.

Benefits
Property tax exemption (~$50,000 value, ~$500-$1,000/year savings)

Elderly Simplified Application Project (ESAP)

South Carolina ESAP (SNAP for Seniors)

Age 60+
General SC resident, no earned income, not on SCCAP.
Income Limits (2025) ~$1,732/month 133% FPL, individual
Asset Limits $4,250 individual, higher than standard SNAP
SC

Simplified process; serves ~50,000 seniors annually.

Benefits
EBT card for food (~$100-$300/month based on income)

Frequently Asked Questions about Bishop Gadsden Episcopal Retirement Community

What is the license number of Bishop Gadsden Episcopal Retirement Community?

According to SC state health department records, Bishop Gadsden Episcopal Retirement Community's license number is CRC-0451.

What is the occupancy rate at Bishop Gadsden Episcopal Retirement Community?

Bishop Gadsden Episcopal Retirement Community's occupancy is 79.7%.

What is the best email address for Bishop Gadsden Episcopal Retirement Community?

The team at Bishop Gadsden Episcopal Retirement Community can be reached at JONNA.COOK@BISHOPGADSDEN.ORG.

Does Bishop Gadsden Episcopal Retirement Community operate as a for-profit or non-profit?

Bishop Gadsden Episcopal Retirement Community is registered as a non-profit in SC.

Who is the administrator of Bishop Gadsden Episcopal Retirement Community?

Jonna Cook is the administrator of Bishop Gadsden Episcopal Retirement Community.

How many beds does Bishop Gadsden Episcopal Retirement Community have?

Bishop Gadsden Episcopal Retirement Community has 123 beds.

Are there photos of Bishop Gadsden Episcopal Retirement Community?

Yes — there are 19 photos of Bishop Gadsden Episcopal Retirement Community in the photo gallery on this page.

Guides for Better Senior Living

Care Cost Calculator: See Prices in Your Area

Nursing Home Data Explorer

Don’t Wait Too Long: 7 Red Flag Signs Your Parent Needs Assisted Living Now

The True Cost of Assisted Living in 2025 – And How Families Are Paying For It

Understanding Senior Living Costs: Pricing Models, Discounts & Financial Assistance