Bridgewalk on Harden
Nursing Home & Skilled Nursing · Lakeland, FL
CMS overall rating Info The Overall CMS Rating is scored from 1 to 5 stars and combines results from health inspections, staffing levels, and quality measures. Health inspections carry the most weight. Staffing and quality scores can increase or decrease the final rating based on performance compared to state and national standards.

Bridgewalk on Harden

Nursing Home & Skilled Nursing · Lakeland, FL
CMS overall rating Info The Overall CMS Rating is scored from 1 to 5 stars and combines results from health inspections, staffing levels, and quality measures. Health inspections carry the most weight. Staffing and quality scores can increase or decrease the final rating based on performance compared to state and national standards.
Calculator: See prices in your area
Bridgewalk on Harden accepts Medicare, Medicaid, and private pay.

Overview of Bridgewalk on Harden

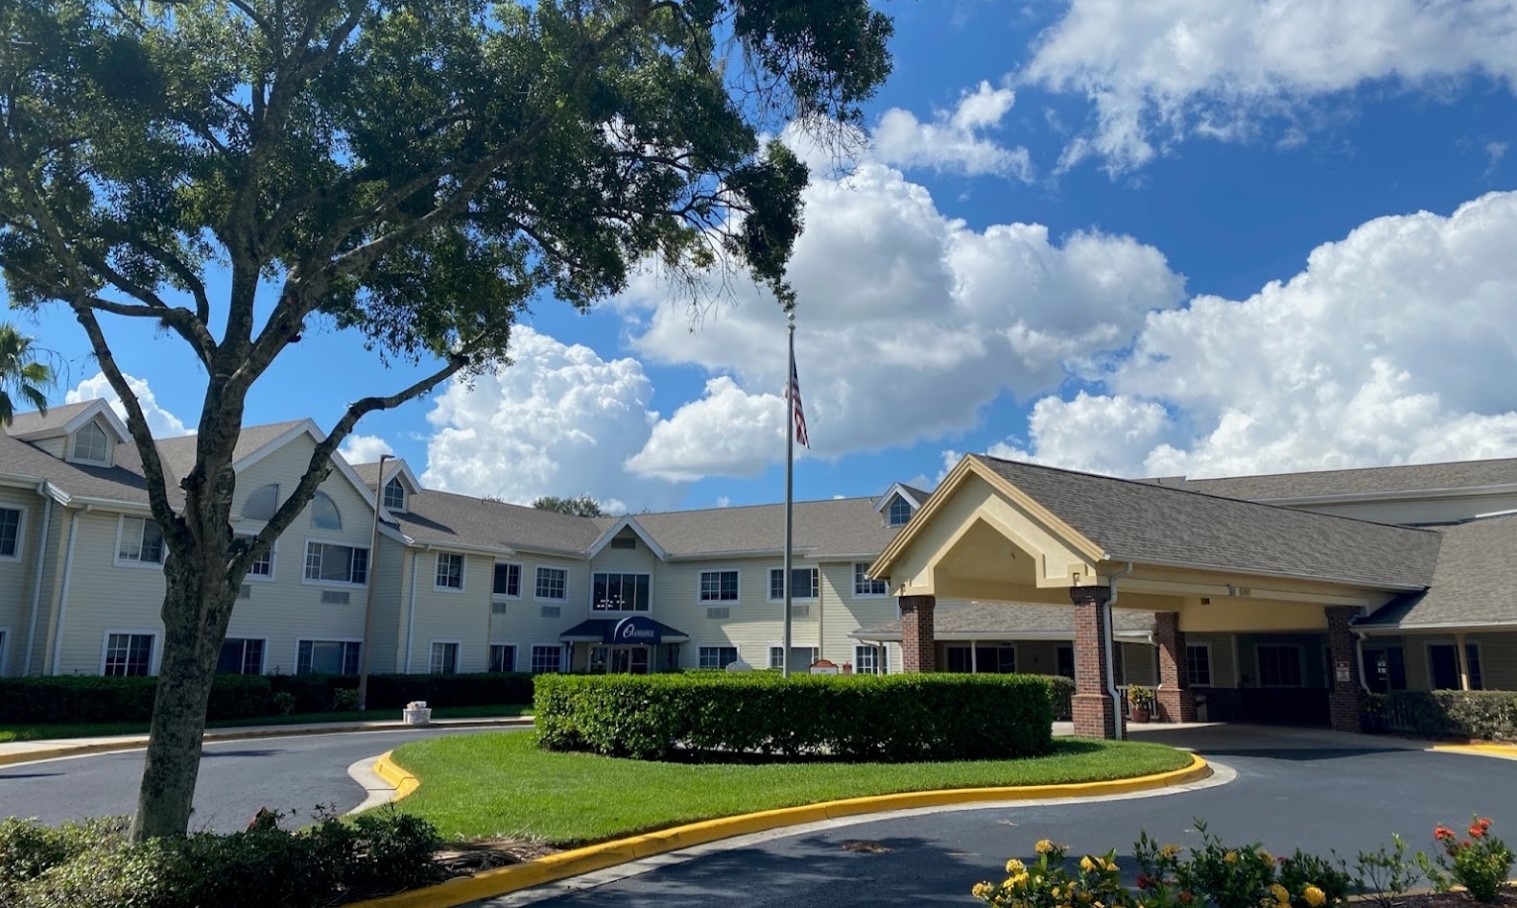
Bridgewalk on Harden is a skilled nursing facility located in Lakeland, FL, specializing in skilled nursing, long-term care, and rehabilitation services. This skilled nursing facility aims to provide the best care their residents and patients need, while providing them with services and amenities that helps in making their stay comfortable.

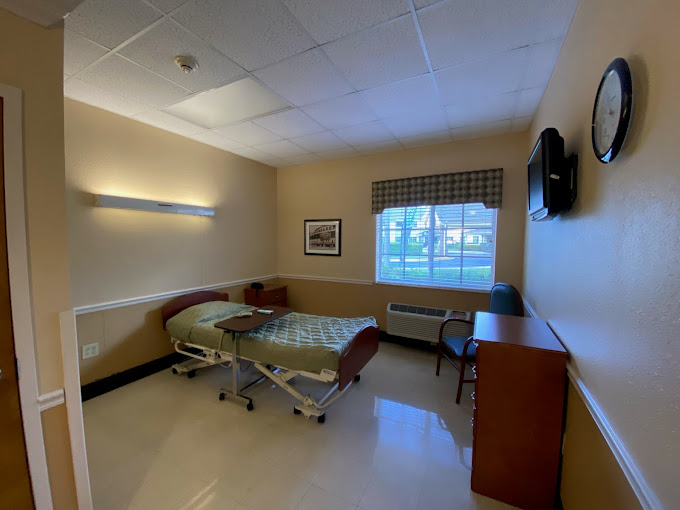
Part of the skilled nursing services they provide is 24hr availability of nursing staff; from licensed RN and LPN, to certified nursing assistants. They also provide a variety of therapy services and programs depending on the needs of the residents and patients. Furthermore, meals, assistance with daily living activities, medication management and administration, as well as grooming services are also provided.

Quality ratings

Measured by Centers for Medicare & Medicaid Services (CMS)

Overall rating Info The Overall CMS Rating combines results from health inspections, staffing levels and quality measures. Health inspections carry the most weight. Staffing and quality scores can increase or decrease the final rating based on performance compared to state and national standards.
▼ 68.5% Below FL avg. ▼ 68.5% Below FL avg.Click the badge to see the full State ranking.Click here to see the full State ranking.
Health Inspection Info Based on the results of the facility's three most recent standard inspections and any complaint investigations. CMS reviews the number, scope, and severity of deficiencies, with more recent findings weighted more heavily.
▼ 64.4% Below FL avg. ▼ 64.4% Below FL avg.Click the badge to see the full State ranking.Click here to see the full State ranking.
Staffing Info Measures average nursing staff hours per resident per day, including Registered Nurses (RNs) and total nursing staff. Ratings are adjusted based on the level of care residents require and are compared to state and national benchmarks.
▼ 70.4% Below FL avg. ▼ 70.4% Below FL avg.Click the badge to see the full State ranking.Click here to see the full State ranking.
Quality Measures Info Based on clinical and physical health indicators reported to CMS, such as hospital readmissions, falls, pressure ulcers, and improvements in mobility. These measures reflect how well residents' health needs are being managed.
▼ 26.1% Below FL avg. ▼ 26.1% Below FL avg.Click the badge to see the full State ranking.Click here to see the full State ranking.

Staffing hours breakdown

Info Daily nursing hours per resident by staff type, reported to CMS. Higher is generally better — compare this facility to state and national averages to see where staffing stands.

Hours per resident per day — compared to Florida state averages

Total nursing care / resident Info This home is ranked 231st out of 252 homes in Florida. Total adjusted nursing hours per resident per day, combining RN, LPN, and aide time. CMS adjusts this for case-mix so facilities can be fairly compared.
3h 25m per day
Rank #231 / 252Nurse hours — State benchmarkedThis home is ranked 231st out of 252 homes in Florida. Shows adjusted nurse hours per resident per day benchmarked to the Florida average, with a ranking across 252 Florida SNFs. More hours mean more direct care. The national average is about 3.5 hrs; below 3.0 is a red flag.Click the rank badge to see the full State ranking.Click here to see the full State ranking.
This facility Florida avg (4h 2m per day)
vs Florida avg
-15%

4 of 6 metrics below state avg

Standout metric Physical Therapist is +180% above state avg
Staff type Hours / Day / Resident vs state avg
Registered Nurse (RN) Info RNs hold the highest nursing license and can assess residents, interpret test results, and direct care plans. More RN hours per day often signals stronger clinical oversight and faster response to health changes. 20m per day ▼ 55% State avg: 44m per day · National avg: 41m per day
LPN / LVN Info Licensed Practical Nurses (LPNs) or Licensed Vocational Nurses (LVNs) deliver routine hands-on care — medication administration, wound dressing, and monitoring vital signs. They work under RN supervision and make up a large share of daily bedside care. 1h 3m per day ▲ 34% State avg: 47m per day · National avg: 52m per day
Nurse Aide Info Certified Nurse Aides (CNAs) provide the most direct day-to-day assistance: bathing, dressing, feeding, and mobility. Nurse aide hours are typically the largest staffing category and directly affect residents' quality of life. 2h 6m per day ▼ 10% State avg: 2h 20m per day · National avg: 2h 21m per day
Total Nursing (Weekend) Info Combined nursing hours (RN + LPN + Nurse Aide) per resident per day on weekends. Staffing often drops on weekends — this figure reveals whether the facility maintains adequate coverage outside of weekday hours. 2h 54m per day ▼ 18% State avg: 3h 31m per day · National avg: 3h 26m per day
Physical Therapist Info Hours per resident per day provided by licensed Physical Therapists (PTs) or PT Assistants. PT services help residents recover mobility after injury or illness and are especially important for post-acute (short-stay) rehabilitation. 14m per day ▲ 180% State avg: 5m per day · National avg: 4m per day
RN (Weekend) Info Registered nurse hours specifically on weekends. Facilities sometimes reduce RN presence on Saturdays and Sundays — a low weekend RN figure compared to weekday hours can indicate reduced clinical oversight when most administrative staff are absent. 19m per day ▼ 41% State avg: 32m per day · National avg: 29m per day

Types of Care at Bridgewalk on Harden

Skilled Nursing

Capacity and availability

This home usually has availability

Occupancy lower than 85% suggests more openings may be available.

Lower occupancy than the Florida average: 84.3%
Occupancy rate 72.9% Rank #211 / 255Occupancy rate — State benchmarkedThis home is ranked 211th out of 255 homes in Florida. Shows this facility's occupancy rate versus the Florida average, with its Statewide rank out of 255. Higher occupancy signals strong local demand and financial stability.Click the rank badge to see the full State ranking.Click here to see the full State ranking.
Avg. Length of Stay 121 days
Occupancy rate
72.9% Rank #211 / 255Occupancy rate — State benchmarkedThis home is ranked 211th out of 255 homes in Florida. Shows this facility's occupancy rate versus the Florida average, with its Statewide rank out of 255. Higher occupancy signals strong local demand and financial stability.Click the rank badge to see the full State ranking.Click here to see the full State ranking.
Avg. Length of Stay
121 days
Walk Score
Walk Score: 24 / 100 Rank #182 / 259Walk Score — State benchmarkedThis home is ranked 182nd out of 259 homes in Florida. Shows how walkable this facility's neighborhood is compared to the average Walk Score across Florida SNFs. Higher scores benefit residents, families, and staff.Click the rank badge to see the full State ranking.Click here to see the full State ranking.
Car-dependent. Most errands require a car, with limited nearby walkable options.

About this community

License Details

RCFE Number13770961

Safety & Compliance

Safety Features24-Hour awake care staff.

Therapy & Rehabilitation

6 services
Rehabilitation Services
Respite Care
Short-Term Rehab
Physical Therapy
Occupational Therapy
Speech Therapy

Staffing & Medical

1 service
24-Hour Staffing

Additional Services

12 services
Short-Term Rehabilitation
Hospice / Palliative Care
Lab & X-Ray Services
Podiatry Services
Neurology Consultations
Cardiology Consultations
Mental Health Services
Swallowing Disorders
Balance Coordination
Stroke Recovery
Cardiac Rehabilitation
Cognitive Therapy

Amenities & Lifestyle

Licensed Rns And Lpns
Certified Nursing Assistants
Housekeeping And Laundry Services
Delicious Meals And Spacious Dining Room
Scheduled Transportation To Doctor Appointments
Daily Social Activities And Entertainment
Community Events
Salon And Barber Services
Family Gathering Spaces
Charming Outdoor Areas
In-Room Television With Cable Service
Private Phone Line
ActivitiesDaily social activities and entertainment.

Dining & Nutrition

Food DescriptionDelicious meals and snacks provided.

Contact Bridgewalk on Harden

Staffing Data

Reporting period: October 1 – December 31, 2025 (Q4 2025). Source: CMS Payroll-Based Journal report.

Total staff 118
Employees 115
Contractors 3
Staff to resident ratio 1.23:1
19% worse than Florida average
Florida average ratio: 1.52:1 Florida average ratio: 1.52:1See full Florida ranking
Avg staff/day 46
Average shift 7.4 hours
6% worse than Florida average
Florida average: 7.9 hours Florida average shift: 7.9 hoursSee full Florida ranking
Total staff hours (quarter) 31,275

Nursing staff breakdown

Q4 2025 · Oct 1 – Dec 31 More info This data comes from the CMS Payroll-Based Journal report covering October 1 – December 31, 2025.
Registered Nurse

Manages medical care and health needs.

Total count 5
Average shift length Info Average shift length. Calculated as total hours divided by days worked and average staff per day. 6.9 hours

No contractors work on this role.

Licensed Practical Nurse

Assists with medical care and medications.

Total count 26
Average shift length Info Average shift length. Calculated as total hours divided by days worked and average staff per day. 7.2 hours

No contractors work on this role.

Certified Nursing Assistant

Helps with daily care and mobility.

Total count 50
Average shift length Info Average shift length. Calculated as total hours divided by days worked and average staff per day. 7.8 hours

No contractors work on this role.

Contractor staffing

Q4 2025 · Oct 1 – Dec 31 More info This data comes from the CMS Payroll-Based Journal report covering October 1 – December 31, 2025.

Total hours from contractors

0.7%

230 contractor hours this quarter

Medical Director: 1 Occupational Therapy Aide: 1 Occupational Therapy Assistant: 1

Staff by category

Q4 2025 · Oct 1 – Dec 31 More info This data comes from the CMS Payroll-Based Journal report covering October 1 – December 31, 2025.
Certified Nursing Assistant 50 0 50 15,765 91 99% 7.8
Licensed Practical Nurse 26 0 26 6,999 91 99% 7.2
Respiratory Therapy Technician 8 0 8 1,437 76 83% 6.6
Registered Nurse 5 0 5 1,392 90 98% 6.9
Clinical Nurse Specialist 2 0 2 952 68 74% 8
RN Director of Nursing 2 0 2 946 66 72% 8
Physical Therapy Assistant 8 0 8 763 74 80% 5.5
Physical Therapist 6 0 6 733 31 34% 7.8
Nurse Practitioner 1 0 1 520 65 71% 8
Administrator 1 0 1 480 60 65% 8
Mental Health Service Worker 1 0 1 464 58 63% 8
Other Dietary Services Staff 3 0 3 404 55 60% 7.3
Qualified Social Worker 1 0 1 191 49 53% 3.9
Occupational Therapy Aide 0 1 1 114 27 29% 4.2
Medical Director 0 1 1 68 24 26% 2.8
Occupational Therapy Assistant 0 1 1 48 9 10% 5.3
Medication Aide/Technician 1 0 1 1 1 1% 1.1
50 Certified Nursing Assistant
% of Days 99%
26 Licensed Practical Nurse
% of Days 99%
8 Respiratory Therapy Technician
% of Days 83%
5 Registered Nurse
% of Days 98%
2 Clinical Nurse Specialist
% of Days 74%
2 RN Director of Nursing
% of Days 72%
8 Physical Therapy Assistant
% of Days 80%
6 Physical Therapist
% of Days 34%
1 Nurse Practitioner
% of Days 71%
1 Administrator
% of Days 65%
1 Mental Health Service Worker
% of Days 63%
3 Other Dietary Services Staff
% of Days 60%
1 Qualified Social Worker
% of Days 53%
1 Occupational Therapy Aide
% of Days 29%
1 Medical Director
% of Days 26%
1 Occupational Therapy Assistant
% of Days 10%
1 Medication Aide/Technician
% of Days 1%

Penalties and fines

Includes penalties issued in 2023

Federal penalties imposed by CMS for regulatory violations, including civil money penalties (fines) and denials of payment for new Medicare/Medicaid admissions.

Source: CMS Penalties Database (Data as of Jan 2026)

Total fines amount $181K Rank #243 / 257Federal fines — State benchmarkedThis home is ranked 243rd out of 257 homes in Florida. Shows this facility's cumulative CMS federal fine dollars versus the Florida average among facilities with fines, and where it ranks among 257 skilled nursing facilities in the pool. Lower total dollars mean a better rank.Click the rank badge to see the full State ranking.Click here to see the full State ranking.
151% higher than Florida average

Florida average: $72K

Number of fines 3
14% more fines than Florida average

Florida average: 2.6

Payment Denials Info Serious action where Medicare and/or Medicaid temporarily stops payments for new residents until issues are fixed. 0
100% fewer payment denials than Florida average

Florida average: 0.1

Fines amount comparison
This facility $181K
Florida average $72K
Penalty History

Penalties are imposed by CMS for violations of federal nursing home regulations.

3 penalties in the past 3 years

Multiple penalties were reported in the last 3 years.

Civil Money Penalty Info Fines imposed for noncompliance, which can be assessed per day or per instance of violation. Oct 23, 2023
$5K
Civil Money Penalty Info Fines imposed for noncompliance, which can be assessed per day or per instance of violation. Oct 11, 2023
$163K
Civil Money Penalty Info Fines imposed for noncompliance, which can be assessed per day or per instance of violation. Oct 2, 2023
$14K

Last updated: Jan 2026

Quality of care over time

These measures show how residents usually do over time at this home, based on health outcomes and preventive care.

High-risk clinical events score Info A composite score based on pressure ulcers, falls with injury, weight loss, walking ability decline, and activities of daily living decline. 8.2
11% worse than Florida average

Florida average: 7.4

Functional decline score Info A composite score based on activities of daily living decline, walking ability decline, and incontinence. 14.6
18% worse than Florida average

Florida average: 12.4

Long-stay resident measures
Above average Florida avg: 4.5 Info CMS star rating based on long-stay quality measure performance. 5 stars = significantly above average, 1 star = significantly below average.
Need for Help with Daily Activities Increased Info Percent of long-stay residents whose need for help with daily activities has increased 9.6%
9% better than Florida average

Florida average: 10.5%

Walking Ability Worsened Info Percent of long-stay residents whose ability to move independently worsened 18.8%
45% worse than Florida average

Florida average: 12.9%

Low Risk Residents with Bowel/Bladder Incontinence Info Percent of low risk long-stay residents who lose control of their bowels or bladder 15.4%
14% worse than Florida average

Florida average: 13.5%

Falls with Major Injury Info Percent of long-stay residents experiencing one or more falls with major injury 3.2%
19% worse than Florida average

Florida average: 2.6%

High Risk Residents with Pressure Ulcers Info Percent of long-stay high risk residents with pressure ulcers 5.6%
5% worse than Florida average

Florida average: 5.4%

Urinary Tract Infection Info Percent of long-stay residents with a urinary tract infection 2.2%
154% worse than Florida average

Florida average: 0.9%

Lost Too Much Weight Info Percent of long-stay residents who lose too much weight 3.9%
35% better than Florida average

Florida average: 6.0%

Depressive Symptoms Info Percent of long-stay residents who have depressive symptoms 0.4%
90% better than Florida average

Florida average: 3.3%

Antipsychotic Use Info Percent of long-stay residents who received an antipsychotic medication 1.9%
76% better than Florida average

Florida average: 8.0%

Pneumococcal Vaccine Info Percent of long-stay residents assessed and appropriately given the pneumococcal vaccine 99.1%
In line with Florida average

Florida average: 97.7%

Influenza Vaccine Info Percent of long-stay residents assessed and appropriately given the seasonal influenza vaccine 96.4%
In line with Florida average

Florida average: 99.2%

Hospitalizations per 1,000 days Info Number of hospitalizations per 1,000 long-stay resident days. 2.01
In line with Florida average

Florida average: 2.10

ED visits per 1,000 days Info Number of outpatient emergency department visits per 1,000 long-stay resident days. 0.99
16% better than Florida average

Florida average: 1.18

Short-stay resident measures
Significantly below average Florida avg: 3.1 Info CMS star rating based on short-stay quality measure performance. 5 stars = much above average, 1 star = much below average.
Pneumococcal Vaccine Info Percent of short-stay residents assessed and appropriately given the pneumococcal vaccine 95.9%
In line with Florida average

Florida average: 94.0%

Antipsychotic medication increase Info Percent of short-stay residents who newly received an antipsychotic medication 2.0%
32% worse than Florida average

Florida average: 1.5%

Influenza Vaccine Info Percent of short-stay residents assessed and appropriately given the seasonal influenza vaccine 91.1%
In line with Florida average

Florida average: 94.7%

Re-hospitalized after SNF stay Info Percentage of short-stay residents who were re-hospitalized after their nursing home admission. 28.6%
9% worse than Florida average

Florida average: 26.2%

Emergency department visits Info Percentage of short-stay residents who had an outpatient emergency department visit. 14.7%
58% worse than Florida average

Florida average: 9.3%

Falls with major injury Info Percentage of SNF residents who experience falls with major injury during their stay. 1.1%
40% worse than Florida average

Florida average: 0.8%

Ability to care for self at discharge Info Percentage of residents at or above expected ability to care for themselves at discharge. 37.5%
30% worse than Florida average

Florida average: 53.7%

Successful return to home or community Info Rate of successful return to home or community from a skilled nursing facility. 44.2%
13% worse than Florida average

Florida average: 50.6%

Breakdown by payment type

Medicare

66% of new residents, usually for short-term rehab.

Typical stay 18 days

Private pay

12% of new residents, often for short stays.

Typical stay 6 - 7 months

Medicaid

22% of new residents, often for long-term daily care.

Typical stay 11 months

Facility Characteristics

Source: CMS Long-Term Care Facility Characteristics (Data as of Jan 2026)

Total residents 96
Medicare
15
15.6% of residents
Medicaid
71
74% of residents
Private pay or other
10
10.4% of residents
Programs & Services
Residents Group

Residents meet regularly to discuss policies, care quality, and activities

Active Resident Council

Organized group of residents that meets regularly to discuss facility policies, quality of life, and activities.

Finances and operations

Privately-owned community
Home revenue
$10.9M
Operating loss
-$800.2K
Privately-owned community
Home revenue
$10.9M Rank #217 / 256Revenue — State benchmarkedThis home is ranked 217th out of 256 homes in Florida. Shows this facility's annual revenue compared to the Florida SNF average. Higher revenue generally means more resources for staffing and capital — read alongside Payroll %.Click the rank badge to see the full State ranking.Click here to see the full State ranking.
Operating loss
-$800.2K
Payroll costs Info The portion of the home's budget spent on staff, including nurses, caregivers, and other employees who support care and operations. Rank #182 / 256Payroll — State benchmarkedThis home is ranked 182nd out of 256 homes in Florida. Shows total annual staff payroll benchmarked to the Florida average. Higher payroll investment relative to peers often signals better staffing and less reliance on cheaper contract labor.Click the rank badge to see the full State ranking.Click here to see the full State ranking.
$6.4M
58.4% of revenue Rank #20 / 256Payroll % — State benchmarkedThis home is ranked 20th out of 256 homes in Florida. Shows payroll as a percentage of revenue versus the Florida average. Well-run Florida SNFs typically land around 49–56% — the top third Statewide. Below 25% may signal understaffing or heavy agency use — read with Staffing ratings.Click the rank badge to see the full State ranking.Click here to see the full State ranking.
Other operating costs Info All remaining costs needed to run the home, such as food, utilities, building maintenance, supplies and administrative expenses.
$5.3M
Total costs $11.7M

Who this home usually serves

TYPE OF STAY

Mostly short-term rehab stays

Most residents typically stay for a few weeks or months before returning home or moving on.

Places of interest near Bridgewalk on Harden

Address 3.6 miles from city center Info Estimated distance in miles from Lakeland's city center to Bridgewalk on Harden's address, calculated via Google Maps. — 3.96 miles to nearest hospital (Pediatric Gastroenterology, Hepatology and Nutrition of Florida)

Calculate Travel Distance to Bridgewalk on Harden

Add your location

Address

Financial Assistance for
Nursing Home in Florida

Bridgewalk on Harden is located in Lakeland, Florida.
Here are the financial assistance programs available to residents in Florida.

Get Financial aid guidance

Long-Term Care Waiver

Florida Medicaid LTC Waiver

Age 65+ or 21+ disabled
General Florida resident, Medicaid- eligible, nursing home-level care need.
Income Limits (2025) ~$2,829/month 300% FBR, individual
Asset Limits $2,000 (individual), $3,000 (couple).
FL

High demand; waitlists common.

Benefits
In-home care (6-8 hours/day) Assisted living Respite (240 hours/year) Case management

Community Care for the Elderly (CCE)

Florida CCE

Age 60+
General Florida resident, at risk of nursing home.
Income Limits ~$2,000/month varies
Asset Limits $5,000 individual
FL

Limited funding; regional variation.

Benefits
Homemaker services (3-5 hours/week) Adult day care (~$60/day) Respite (up to 10 days/year)

Home Care for the Elderly (HCE)

Florida Home Care for the Elderly

Age 60+
General Florida resident, at risk of nursing home placement; caregiver must be approved.
Income Limits (2025) ~$2,829/month individual, aligned with Medicaid thresholds
Asset Limits ~$2,000 (individual); varies by case manager discretion.
FL

Limited funding (~3,500 served annually); prioritizes low-income frail seniors.

Benefits
Basic subsidy (~$160/month) for housing/medical costs; special subsidies for supplies/services (e.g., incontinence supplies, ~$50-$200/month)

Program of All-Inclusive Care for the Elderly (PACE)

Florida Medicaid PACE

Age 55+
General Florida resident, nursing home-level care need, safe with PACE support.
Income Limits (2025) ~$2,829/month 300% FBR
Asset Limits $2,000 (individual), $3,000 (couple).
FL

Limited to specific counties (e.g., Hillsborough, Miami-Dade); ~10 sites statewide.

Benefits
Personal care (5-7 hours/day) Medical care Meals Transportation Therapy

Optional State Supplementation (OSS)

Florida Optional State Supplementation

Age 65+ or disabled
General Florida resident, living in approved facility, receiving SSI or low-income.
Income Limits (2025) ~$1,004/month individual, including SSI
Asset Limits $2,000 (individual), $3,000 (couple).
FL

Limited to specific facility types; ~$78.40/month max supplement.

Benefits
Cash payment (~$78.40/month) for room/board or personal needs in facilities

Compare Nursing Home around Lakeland

The information below is reported by the Florida Agency for Health Care Administration (AHCA).

3 facilities compared · CMS & FL Dept. of Health data

Filter by care type
Highlands Lake Center
NH

Nursing Home Licensed facility providing 24/7 skilled nursing care for residents with complex, ongoing medical needs. Staffed by RNs, LPNs, and CNAs. Inspected and star-rated annually by CMS. Accepts Medicare (short-term rehab) and Medicaid (long-term care).

RC

Respite Care Short-term temporary care — days to weeks — to give family caregivers a break. Full care provided during the stay. Often used after hospitalization or to trial a facility before a permanent placement decision.

Lakeland 179 93.8% +11% 3.66 -4% -9% $3.8k 35 4.4 - 159 9 Cynthia Ayala $20.3M $10.4M 51.5% 105620
Lakeland Nursing and Rehabilitation Center
NH

Nursing Home Licensed facility providing 24/7 skilled nursing care for residents with complex, ongoing medical needs. Staffed by RNs, LPNs, and CNAs. Inspected and star-rated annually by CMS. Accepts Medicare (short-term rehab) and Medicaid (long-term care).

Lakeland (Tigertown) 185 74.6% -11% 3.61 -33% -11% $791.9k 33 5.5 3 161 57 Palm Terrace J Dek Operations LLC $26.8M $8.9M 33.2% 105354
Bridgewalk on Harden
NH

Nursing Home Licensed facility providing 24/7 skilled nursing care for residents with complex, ongoing medical needs. Staffed by RNs, LPNs, and CNAs. Inspected and star-rated annually by CMS. Accepts Medicare (short-term rehab) and Medicaid (long-term care).

Lakeland 120 72.9% -13% 3.42 -65% -15% $181.4k 19 3.2 4 92 24 Louis Garrard $10.9M $6.4M 58.4% 106138

Frequently Asked Questions about Bridgewalk on Harden

Is Bridgewalk on Harden in a walkable area?

Bridgewalk on Harden has a walk score of 24. Car-dependent. Most errands require a car, with limited nearby walkable options.

What is the occupancy rate at Bridgewalk on Harden?

Bridgewalk on Harden's occupancy is 72.9%.

Are there photos of Bridgewalk on Harden?

Yes — there are 6 photos of Bridgewalk on Harden in the photo gallery on this page.

What is the phone number of Bridgewalk on Harden?

(863) 619-2102 will put you in contact with the team at Bridgewalk on Harden.

Is Bridgewalk on Harden Medicare or Medicaid certified?

Yes — Bridgewalk on Harden is a CMS-certified provider of Medicare and Medicaid.

Guides for Better Senior Living

Care Cost Calculator: See Prices in Your Area

Nursing Home Data Explorer

Don’t Wait Too Long: 7 Red Flag Signs Your Parent Needs Assisted Living Now

The True Cost of Assisted Living in 2025 – And How Families Are Paying For It

Understanding Senior Living Costs: Pricing Models, Discounts & Financial Assistance

Explore Open Rooms
1 Contact details
2 What type of senior care service are you looking for?
3 What budget do you have in mind for senior care?
4 How soon do you need to find care?
5 Additional details

Thank you for your interest!

Our team will be in touch shortly to help with next steps.