Brighton Care Center
CMS overall rating Info CMS (the Centers for Medicare & Medicaid Services) is the federal agency that rates nursing home quality. Its Overall Rating runs from 1 to 5 stars, combining health inspections, staffing, and quality measures, with inspections weighted most heavily.

Brighton Care Center

CMS overall rating Info CMS (the Centers for Medicare & Medicaid Services) is the federal agency that rates nursing home quality. Its Overall Rating runs from 1 to 5 stars, combining health inspections, staffing, and quality measures, with inspections weighted most heavily.
Calculator: See prices in your area
Brighton Care Center accepts Medicare, Medicaid, and private pay.

Overview of Brighton Care Center

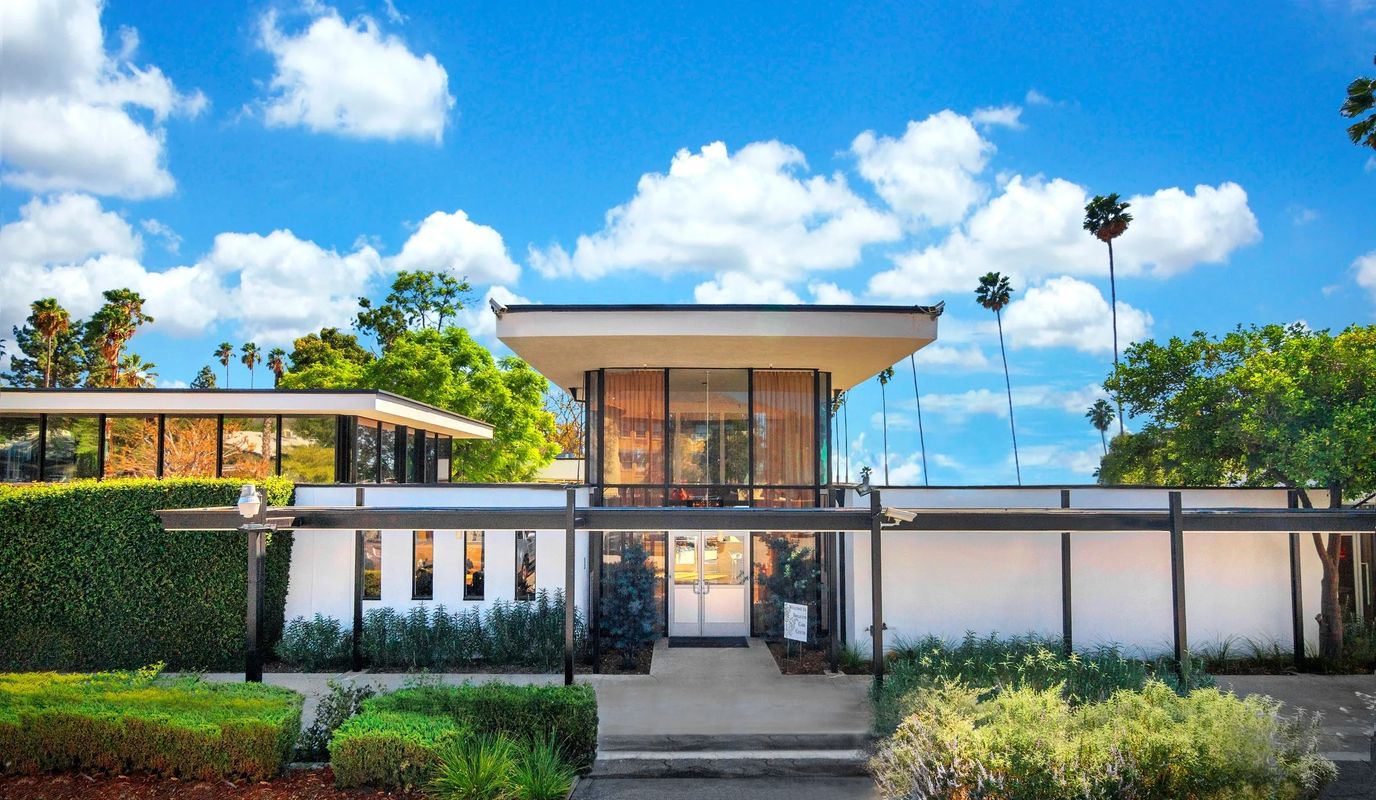
Brighton Care Center is one of Pasadena’s nursing facilities providing skilled nursing services to its residents. They boast of their top quality 24/7 skilled nursing care, ensuring that residents receive both medical care and assistance with daily living activities. Furthermore, medication management, and coordination with other healthcare providers and transportation services are offered for scheduled medical appointments, ensuring that residents medical needs are well met.
Brighton values the role of food in keeping a healthy body; providing the residents with quality meals that are both tasty and nutritious, and prepared with consideration to their dietary needs and restrictions. They also offer housekeeping and laundry services to keep the residents’ environment clean and sanitized, as well as make their stay comfortable.

Quality ratings

Measured by Centers for Medicare & Medicaid Services (CMS)

Overall rating Info The Overall CMS Rating combines results from health inspections, staffing levels and quality measures. Health inspections carry the most weight. Staffing and quality scores can increase or decrease the final rating based on performance compared to state and national standards.
▼ 36.5% Below CA avg. ▼ 36.5% Below CA avg.CA average: 3.1Click the badge to see the full State ranking.Click here to see the full State ranking.
Health Inspection Info Based on the results of the facility's three most recent standard inspections and any complaint investigations. CMS reviews the number, scope, and severity of deficiencies, with more recent findings weighted more heavily.
▼ 28.5% Below CA avg. ▼ 28.5% Below CA avg.CA average: 2.8Click the badge to see the full State ranking.Click here to see the full State ranking.
Staffing Info Measures average nursing staff hours per resident per day, including Registered Nurses (RNs) and total nursing staff. Ratings are adjusted based on the level of care residents require and are compared to state and national benchmarks.
▼ 36.3% Below CA avg. ▼ 36.3% Below CA avg.CA average: 3.1Click the badge to see the full State ranking.Click here to see the full State ranking.
Quality Measures Info Based on clinical and physical health indicators reported to CMS, such as hospital readmissions, falls, pressure ulcers, and improvements in mobility. These measures reflect how well residents' health needs are being managed.
▼ 51.0% Below CA avg. ▼ 51.0% Below CA avg.CA average: 4.1Click the badge to see the full State ranking.Click here to see the full State ranking.

Staffing hours breakdown

Info Daily nursing hours per resident by staff type, reported to CMS. Higher is generally better — compare this facility to state and national averages to see where staffing stands.

Hours per resident per day — compared to California state averages

Total nursing care / resident Info This home is ranked 138th out of 354 homes in California for nurse hours. Total adjusted nursing hours per resident per day, combining RN, LPN, and aide time. CMS adjusts this for case-mix so facilities can be fairly compared.
4h 10m per day
Rank #138 / 354Nurse hours — State benchmarkedThis home is ranked 138th out of 354 homes in California. Shows adjusted nurse hours per resident per day benchmarked to the California average, with a ranking across 354 California facilities. More hours mean more direct care. The national average is about 3.5 hrs; below 3.0 is a red flag.Rankings are based only on facilities in California that report data for that category. Facilities without available data are excluded from the ranking.Click the rank badge to see the full State ranking.Click here to see the full State ranking.
This facility California avg (4h 13m per day)
vs California avg
-1%

4 of 6 metrics below state avg

Standout metric Physical Therapist is +9% above state avg
Staff typeHours / Day / Residentvs state avg
Registered Nurse (RN) Info RNs hold the highest nursing license and can assess residents, interpret test results, and direct care plans. More RN hours per day often signals stronger clinical oversight and faster response to health changes. 29m per day ▼ 25% State avg: 39m per day · National avg: 41m per day
LPN / LVN Info Licensed Practical Nurses (LPNs) or Licensed Vocational Nurses (LVNs) deliver routine hands-on care — medication administration, wound dressing, and monitoring vital signs. They work under RN supervision and make up a large share of daily bedside care. 1h 17m per day ▲ 5% State avg: 1h 13m per day · National avg: 52m per day
Nurse Aide Info Certified Nurse Aides (CNAs) provide the most direct day-to-day assistance: bathing, dressing, feeding, and mobility. Nurse aide hours are typically the largest staffing category and directly affect residents' quality of life. 2h 27m per day ▼ 8% State avg: 2h 39m per day · National avg: 2h 21m per day
Weekend Total Nursing Info Combined nursing hours (RN + LPN + Nurse Aide) per resident per day on weekends. Staffing often drops on weekends — this figure reveals whether the facility maintains adequate coverage outside of weekday hours. 3h 38m per day ▼ 11% State avg: 4h 5m per day · National avg: 3h 26m per day
Physical Therapist Info Hours per resident per day provided by licensed Physical Therapists (PTs) or PT Assistants. PT services help residents recover mobility after injury or illness and are especially important for post-acute (short-stay) rehabilitation. 5m per day ▲ 9% State avg: 5m per day · National avg: 4m per day
Weekend RN Info Registered nurse hours specifically on weekends. Facilities sometimes reduce RN presence on Saturdays and Sundays — a low weekend RN figure compared to weekday hours can indicate reduced clinical oversight when most administrative staff are absent. 20m per day ▼ 32% State avg: 30m per day · National avg: 29m per day

Capacity and availability

This home usually has availability

Lower occupancy than the California average: 84.7%
Occupancy rate
82.9% Rank #615 / 1537Occupancy rate — State benchmarkedThis home is ranked 615th out of 1537 homes in California. Shows this facility's occupancy rate versus the California average, with its Statewide rank out of 1537. Higher occupancy signals strong local demand and financial stability.Rankings are based only on facilities in California that report data for that category. Facilities without available data are excluded from the ranking.Click the rank badge to see the full State ranking.Click here to see the full State ranking.
Avg. Length of Stay
63 days
Bed community size
99-bed community Rank #725 / 1657Bed count — State benchmarkedThis home is ranked 725th out of 1657 homes in California. Shows this facility's certified or reported bed count compared to other California facilities. Larger communities may offer more amenities, programs, and on-site services for residents and families.Rankings are based only on facilities in California that report data for that category. Facilities without available data are excluded from the ranking.Click the rank badge to see the full State ranking.Click here to see the full State ranking.
A larger shared setting that may offer more common spaces and organized community services.
Walk Score
Walk Score: 62 / 100 Rank #982 / 2092Walk Score — State benchmarkedThis home is ranked 982nd out of 2092 homes in California. Shows how walkable this facility's neighborhood is compared to the average Walk Score across California facilities. Higher scores benefit residents, families, and staff.Rankings are based only on facilities in California that report data for that category. Facilities without available data are excluded from the ranking.Click the rank badge to see the full State ranking.Click here to see the full State ranking.
Moderately walkable. Some errands can be accomplished on foot, with a mix of nearby amenities.

Contact Brighton Care Center

Staffing Data

Reporting period: October 1 – December 31, 2025 (Q4 2025). Source: CMS Payroll-Based Journal report.

Total staff 146
Employees 109
Contractors 37
Staff to resident ratio 1.80 : 1
0% compared with California average
California average ratio: 1.81 : 1 California average ratio: 1.81 : 1See full California ranking
Avg staff/day 64
Average shift 7.2 hours
6% worse than California average
California average: 7.7 hours California average shift: 7.7 hoursSee full California ranking
Total staff hours (quarter) 42,366

Nursing staff breakdown

Q4 2025 · Oct 1 – Dec 31 More info This data comes from the CMS Payroll-Based Journal report covering October 1 – December 31, 2025.
Registered Nurse

Manages medical care and health needs.

RN Staff Info All 9 RN Staff are full-time employees. No contractors work on this role. 9
Average shift length Info Average shift length. Calculated as total hours divided by days worked and average staff per day. 7.6 hours
Licensed Practical Nurse

Assists with medical care and medications.

LPN Staff Info All 27 LPN Staff are full-time employees. No contractors work on this role. 27
Average shift length Info Average shift length. Calculated as total hours divided by days worked and average staff per day. 7.7 hours
Certified Nursing Assistant

Helps with daily care and mobility.

CNA Staff Info All 55 CNA Staff are full-time employees. No contractors work on this role. 55
Average shift length Info Average shift length. Calculated as total hours divided by days worked and average staff per day. 7.1 hours

Contractor staffing

Q4 2025 · Oct 1 – Dec 31 More info This data comes from the CMS Payroll-Based Journal report covering October 1 – December 31, 2025.

Total hours from contractors

13.6%

5,772 contractor hours this quarter

Speech Language Pathologist: 11 Qualified Activities Professional: 7 Physical Therapy Assistant: 5 Physical Therapy Aide: 5 Respiratory Therapy Technician: 4 Qualified Social Worker: 2 Occupational Therapy Aide: 1 Occupational Therapy Assistant: 1 Medical Director: 1

Staff by category

Q4 2025 · Oct 1 – Dec 31 More info This data comes from the CMS Payroll-Based Journal report covering October 1 – December 31, 2025.
Certified Nursing Assistant5505519,34792100%7.1
Licensed Practical Nurse270277,55592100%7.7
Registered Nurse9092,82792100%7.6
RN Director of Nursing6062,5346975%8
Speech Language Pathologist011111,5218896%6.5
Physical Therapy Assistant0551,4768087%6.5
Other Dietary Services Staff5051,38792100%7.2
Mental Health Service Worker2028806368%7.4
Qualified Activities Professional0778347076%11.5
Physical Therapy Aide0558348592%6.1
Respiratory Therapy Technician0447187177%5.7
Clinical Nurse Specialist2025286874%7.5
Administrator1015126470%8
Nurse Practitioner1015126470%8
Dietitian1015126470%8
Occupational Therapy Aide0112113639%5.9
Qualified Social Worker0221294145%3.1
Occupational Therapy Assistant0112633%8.7
Medical Director0112455%4.8
55 Certified Nursing Assistant
% of Days 100%
27 Licensed Practical Nurse
% of Days 100%
9 Registered Nurse
% of Days 100%
6 RN Director of Nursing
% of Days 75%
11 Speech Language Pathologist
% of Days 96%
5 Physical Therapy Assistant
% of Days 87%
5 Other Dietary Services Staff
% of Days 100%
2 Mental Health Service Worker
% of Days 68%
7 Qualified Activities Professional
% of Days 76%
5 Physical Therapy Aide
% of Days 92%
4 Respiratory Therapy Technician
% of Days 77%
2 Clinical Nurse Specialist
% of Days 74%
1 Administrator
% of Days 70%
1 Nurse Practitioner
% of Days 70%
1 Dietitian
% of Days 70%
1 Occupational Therapy Aide
% of Days 39%
2 Qualified Social Worker
% of Days 45%
1 Occupational Therapy Assistant
% of Days 3%
1 Medical Director
% of Days 5%

Penalties and fines

Federal penalties imposed by CMS for regulatory violations, including civil money penalties (fines) and denials of payment for new Medicare/Medicaid admissions.

Source: CMS Penalties Database

No penalties in the past 3 years

No civil money penalties or payment denials were reported in the last 3 years.

Quality of care over time

These measures show how residents usually do over time at this home, based on health outcomes and preventive care.

High-risk clinical events score Info A composite score based on pressure ulcers, falls with injury, weight loss, walking ability decline, and activities of daily living decline. 8.4
27% worse than California average

California average: 6.6

Functional decline score Info A composite score based on activities of daily living decline, walking ability decline, and incontinence. 6.4
43% better than California average

California average: 11.3

Long-stay resident measures
Average California avg: 4.2 Info CMS star rating based on long-stay quality measure performance. 5 stars = significantly above average, 1 star = significantly below average.
Need for Help with Daily Activities Increased Info Percent of long-stay residents whose need for help with daily activities has increased 10.2%
8% better than California average

California average: 11.1%

Walking Ability Worsened Info Percent of long-stay residents whose ability to move independently worsened 5.7%
52% better than California average

California average: 12.0%

Low Risk Residents with Bowel/Bladder Incontinence Info Percent of low risk long-stay residents who lose control of their bowels or bladder 3.3%
70% better than California average

California average: 11.3%

Falls with Major Injury Info Percent of long-stay residents experiencing one or more falls with major injury 0.9%
46% better than California average

California average: 1.7%

High Risk Residents with Pressure Ulcers Info Percent of long-stay high risk residents with pressure ulcers 12.1%
144% worse than California average

California average: 5.0%

Urinary Tract Infection Info Percent of long-stay residents with a urinary tract infection 2.8%
124% worse than California average

California average: 1.2%

Lost Too Much Weight Info Percent of long-stay residents who lose too much weight 13.2%
214% worse than California average

California average: 4.2%

Depressive Symptoms Info Percent of long-stay residents who have depressive symptoms 0.0%
100% better than California average

California average: 6.7%

Antipsychotic Use Info Percent of long-stay residents who received an antipsychotic medication 12.9%
28% worse than California average

California average: 10.1%

Pneumococcal Vaccine Info Percent of long-stay residents assessed and appropriately given the pneumococcal vaccine 100.0%
In line with California average

California average: 98.5%

Influenza Vaccine Info Percent of long-stay residents assessed and appropriately given the seasonal influenza vaccine 100.0%
In line with California average

California average: 98.2%

Hospitalizations per 1,000 days Info Number of hospitalizations per 1,000 long-stay resident days. 1.88
16% better than California average

California average: 2.25

ED visits per 1,000 days Info Number of outpatient emergency department visits per 1,000 long-stay resident days. 0.68
57% better than California average

California average: 1.59

Short-stay resident measures
Below average California avg: 3.5 Info CMS star rating based on short-stay quality measure performance. 5 stars = much above average, 1 star = much below average.
Pneumococcal Vaccine Info Percent of short-stay residents assessed and appropriately given the pneumococcal vaccine 100.0%
6% better than California average

California average: 94.0%

Antipsychotic medication increase Info Percent of short-stay residents who newly received an antipsychotic medication 1.5%
In line with California average

California average: 1.5%

Influenza Vaccine Info Percent of short-stay residents assessed and appropriately given the seasonal influenza vaccine 95.8%
In line with California average

California average: 93.2%

Re-hospitalized after SNF stay Info Percentage of short-stay residents who were re-hospitalized after their nursing home admission. 26.2%
13% worse than California average

California average: 23.2%

Emergency department visits Info Percentage of short-stay residents who had an outpatient emergency department visit. 8.7%
22% better than California average

California average: 11.2%

Falls with major injury Info Percentage of SNF residents who experience falls with major injury during their stay. 0.7%
8% better than California average

California average: 0.8%

Ability to care for self at discharge Info Percentage of residents at or above expected ability to care for themselves at discharge. 37.8%
30% worse than California average

California average: 53.7%

Successful return to home or community Info Rate of successful return to home or community from a skilled nursing facility. 48.0%
5% worse than California average

California average: 50.6%

Breakdown by payment type

Medicare

28% of new residents, usually for short-term rehab.

Typical stay 1 months

Private pay

54% of new residents, often for short stays.

Typical stay 19 days

Medicaid

18% of new residents, often for long-term daily care.

Typical stay 7 - 8 months

Facility Characteristics

Source: CMS Long-Term Care Facility Characteristics (Data as of Jan 2026)

Total residents 81
Medicare
7
8.6% of residents
Medicaid
6
7.4% of residents
Private pay or other
68
84% of residents

Finances and operations

Based on CMS SNF Cost Report for fiscal year ending in 12/2023.

For-profit
Operated by a single business entity.
Net patient revenue Info Net patient revenue — what the home actually collects for resident care, after contractual allowances, bad debt and discounts are subtracted from its gross charges (CMS cost report, Worksheet G-3). It covers resident care only; money the home earns from other sources is shown separately as "Other income."
$12.4M
Net patient income Info Net patient income: net patient revenue minus the home's total operating expenses. A positive figure means it earns more from resident care than it spends to deliver it; a negative figure means the opposite. It excludes non-operating "other income."
-$562.4K
For-profit Operated by a single business entity.
Net patient revenue Info Net patient revenue — what the home actually collects for resident care, after contractual allowances, bad debt and discounts are subtracted from its gross charges (CMS cost report, Worksheet G-3). It covers resident care only; money the home earns from other sources is shown separately as "Other income."
$12.4M Rank #212 / 355Revenue — State benchmarkedThis home is ranked 212th out of 355 homes in California. Shows this facility's annual revenue compared to the California average. Higher revenue generally means more resources for staffing and capital — read alongside Payroll %.Rankings are based only on facilities in California that report data for that category. Facilities without available data are excluded from the ranking.Click the rank badge to see the full State ranking.Click here to see the full State ranking.
Net patient income Info Net patient income: net patient revenue minus the home's total operating expenses. A positive figure means it earns more from resident care than it spends to deliver it; a negative figure means the opposite. It excludes non-operating "other income."
-$562.4K
Other income Info Money the home earns outside of resident care — such as investments, grants, rentals and other non-operating sources (CMS cost report, Worksheet G-3). It is tracked separately from net patient revenue: it is not part of that figure, and it is not included in net patient income.
$551.4K
Payroll costs Info Staff salaries plus wage-related costs — benefits such as payroll taxes, health insurance and retirement — from the home's own accounting records (CMS cost report, Worksheet A). Contract or agency labor is counted separately, under other operating costs. Rank #200 / 355Payroll — State benchmarkedThis home is ranked 200th out of 355 homes in California. Shows total annual staff payroll benchmarked to the California average. Higher payroll investment relative to peers often signals better staffing and less reliance on cheaper contract labor.Rankings are based only on facilities in California that report data for that category. Facilities without available data are excluded from the ranking.Click the rank badge to see the full State ranking.Click here to see the full State ranking.
$6.0M 48.2% of net patient revenue Info Payroll as a share of revenue: staff salaries and wage-related benefits divided by net patient revenue. A higher figure means more of each revenue dollar goes to staff pay. Rank #134 / 355Payroll % — State benchmarkedThis home is ranked 134th out of 355 homes in California. Shows payroll as a percentage of revenue versus the California average. Well-run California facilities typically land around 55–67% — the top third Statewide. Below 25% may signal understaffing or heavy agency use — read with Staffing ratings.Rankings are based only on facilities in California that report data for that category. Facilities without available data are excluded from the ranking.Click the rank badge to see the full State ranking.Click here to see the full State ranking.
Other operating costs Info Everything it costs to run the home apart from payroll — food, utilities, supplies, maintenance, contract labor and administration. Calculated as total operating expense minus payroll (staff salaries and wage-related benefits).
$7.0M
Total costs Info The home's total operating expense for the year — all the costs of running it, salaries included (CMS cost report, Worksheet G-3).
$13.0M

Who this home usually serves

TYPE OF STAY

Mix of rehab and long-term care

This home supports both short-term rehab and long-term care, with residents staying for a wide range of durations.

Most new residents arrive under private pay (54% of admissions), and a typical private pay stay runs around 19 days.

Admissions
514 total

Coverage residents most often arrive under.

Medicare 28%
Private pay 54%
Medicaid 18%
Discharges
474 total

Coverage residents most often leave under.

Medicare 20%
Private pay 54%
Medicaid 25%

Places of interest near Brighton Care Center

Address 2.4 miles from city center Info Estimated distance in miles from Pasadena's city center to Brighton Care Center's address, calculated via Google Maps. — 4.92 miles to nearest hospital (Adventist Health Glendale)

Calculate Travel Distance to Brighton Care Center

Add your location

Address

Compare Nursing Homes around Pasadena

The information below is reported by the California Department of Social Services and Department of Public Health.

5 facilities compared · CMS & CA Dept. of Health data

Villa Gardens Retirement Community
NH
NC
Pasadena (East Villa Street)
340
Facility 340
CA AVG 103
Rank #39 / 1657
--
3.57
Facility 3.57
CA AVG 4.22
Rank #269 / 354
-23%-15%
$70.3k
Facility $70.3k
CA AVG $56.5k
Rank #326 / 362
76
Facility 76
CA AVG 81
Rank #946 / 1401
65
Facility 65
CA AVG 50.2
Rank #286 / 361
5.0
Facility 5.0
CA AVG 4.6
Rank #243 / 361
491-
79
Facility 79
CA AVG 57
Rank #451 / 2092
Providence Group Of California LLC
$11.6M
Facility $11.6M
CA AVG $17.0M
Rank #243 / 355
$6.2M
Facility $6.2M
CA AVG $7.0M
Rank #249 / 355
53.8%
Facility 53.8%
CA AVG 45.2%
Rank #176 / 355
55551
Foothill Heights Care Center
NH
ADC
AL
RC
Pasadena (North Central)
49
Facility 49
CA AVG 103
Rank #1138 / 1657
86.1%
Facility 86.1%
CA AVG 84.7%
Rank #432 / 1537
+2%
3.97
Facility 3.97
CA AVG 4.22
Rank #184 / 354
-53%-6%
$9.4k
Facility $9.4k
CA AVG $56.5k
Rank #240 / 362
-
49
Facility 49
CA AVG 50.2
Rank #224 / 361
3.1
Facility 3.1
CA AVG 4.6
Rank #77 / 361
-42A+
69
Facility 69
CA AVG 57
Rank #768 / 2092
Foothill Heights Care Center LLC
$7.1M
Facility $7.1M
CA AVG $17.0M
Rank #286 / 355
$3.6M
Facility $3.6M
CA AVG $7.0M
Rank #326 / 355
50.4%
Facility 50.4%
CA AVG 45.2%
Rank #302 / 355
555894
Two Palms Care Center
NH
Pasadena (Pasadena Council District 4)
112
Facility 112
CA AVG 103
Rank #631 / 1657
--- --
$0
Facility $0
CA AVG $56.5k
Rank #1 / 362
64
Facility 64
CA AVG 81
Rank #1247 / 1401
38
Facility 38
CA AVG 50.2
Rank #160 / 361
5.4
Facility 5.4
CA AVG 4.6
Rank #273 / 361
-21A+
49
Facility 49
CA AVG 57
Rank #1370 / 2092
Estrella Choy
$7.1M
Facility $7.1M
CA AVG $17.0M
Rank #339 / 355
$3.3M
Facility $3.3M
CA AVG $7.0M
Rank #316 / 355
46.2%
Facility 46.2%
CA AVG 45.2%
Rank #18 / 355
55464
Brighton Care Center
NH
Pasadena (North Central)
99
Facility 99
CA AVG 103
Rank #725 / 1657
82.9%
Facility 82.9%
CA AVG 84.7%
Rank #615 / 1537
-2%
4.17
Facility 4.17
CA AVG 4.22
Rank #138 / 354
-30%-1%
$0
Facility $0
CA AVG $56.5k
Rank #1 / 362
-
63
Facility 63
CA AVG 50.2
Rank #279 / 361
3.5
Facility 3.5
CA AVG 4.6
Rank #115 / 361
186-
62
Facility 62
CA AVG 57
Rank #982 / 2092
Rachel Rodriquez
$12.4M
Facility $12.4M
CA AVG $17.0M
Rank #212 / 355
$6.0M
Facility $6.0M
CA AVG $7.0M
Rank #200 / 355
48.2%
Facility 48.2%
CA AVG 45.2%
Rank #134 / 355
555338
Pasadena Nursing Center
NH
ADC
RC
Pasadena (North Central)
108
Facility 108
CA AVG 103
Rank #666 / 1657
75.0%
Facility 75.0%
CA AVG 84.7%
Rank #824 / 1537
-11%
4.14
Facility 4.14
CA AVG 4.22
Rank #160 / 354
-3%-2%
$9.1k
Facility $9.1k
CA AVG $56.5k
Rank #235 / 362
62
Facility 62
CA AVG 81
Rank #1271 / 1401
85
Facility 85
CA AVG 50.2
Rank #318 / 361
4.3
Facility 4.3
CA AVG 4.6
Rank #196 / 361
481-
64
Facility 64
CA AVG 57
Rank #923 / 2092
Gardena Retirement Center, Inc
$7.2M
Facility $7.2M
CA AVG $17.0M
Rank #293 / 355
$4.4M
Facility $4.4M
CA AVG $7.0M
Rank #296 / 355
61.3%
Facility 61.3%
CA AVG 45.2%
Rank #108 / 355
555213

Financial Assistance for
Nursing Home in California

Brighton Care Center is located in Pasadena, California.
Here are the financial assistance programs available to residents in California.

Get Financial aid guidance

Multipurpose Senior Services Program

MSSP (Medi-Cal Waiver)

Age 65+
General California resident, Medi-Cal eligible, nursing home risk.
Income Limits (2025) ~$2,829/month 300% FBR, individual
Asset Limits $2,000 (individual), $3,000 (couple).
CA

County-managed; waitlists possible.

Benefits
In-home support (4-6 hours/day) Respite care (14 days/year) Meals (~$6/meal) Transportation (8 trips/month) Care management

In-Home Supportive Services (IHSS)

California IHSS

Age 65+
General California resident, Medicaid-eligible or low-income.
Income Limits ~$1,732/month individual, Medi-Cal threshold
Asset Limits $2,000 individual
CA

Can hire family as caregivers.

Benefits
Personal care (up to 283 hours/month) Homemaker services Respite (varies)

Multipurpose Senior Services Program (MSSP)

CA MSSP

Age 65+
General California resident, Medi-Cal-eligible, nursing home-eligible but community-capable.
Income Limits ~$2,829/month 300% FBR, individual
Asset Limits $2,000 individual
CA

Available in 38 counties; waitlists common.

Benefits
Case management Respite care (up to 10 days/year) Minor home mods (avg. $500) Adult day care (~$50/day)

Property Tax Postponement Program (PTP)

CA PTP

Age 62+
General California resident, own and live in home, 40% equity.
Income Limits (2025) ~$51,500/year household, adjusted annually
Asset Limits Equity-based; no strict asset cap.
CA

Deferred taxes accrue interest (5% as of 2024); repaid upon sale/death.

Benefits
Property tax deferral (avg. $1,000-$3,000/year, varies by county)

Assisted Living Waiver (ALW)

CA ALW

Age 65+ or disabled
General California resident, Medi-Cal-eligible, nursing home-eligible.
Income Limits ~$2,829/month 300% FBR, individual
Asset Limits $2,000 individual
CA

Available in 15 counties (e.g., LA, Sacramento); waitlists common.

Benefits
Personal care in ALFs (5-7 hours/day) Medication management Social services

California CARES Program

CA CARES

Age
General Caregivers of California residents 60+ needing help with 3+ daily activities; no caregiver age limit.
Income Limits No strict limit; cost-sharing above ~$2,500/month threshold.
Asset Limits Not applicable; need-based.
CA

High demand in urban areas; complements IHSS respite.

Benefits
Respite care (up to 10 days/year) Counseling (4-6 sessions/year) Training (2-3 workshops/year) Supplies (~$200/year)

Frequently Asked Questions about Brighton Care Center

What neighborhood is Brighton Care Center in?

Brighton Care Center is in the North Central neighborhood.

Is Brighton Care Center in a walkable area?

Brighton Care Center has a walk score of 62. Moderately walkable. Some errands can be accomplished on foot, with a mix of nearby amenities.

What is the occupancy rate at Brighton Care Center?

Brighton Care Center's occupancy is 82.9%.

Does Brighton Care Center operate as a for-profit or non-profit?

Brighton Care Center is registered as a for-profit.

Are there photos of Brighton Care Center?

Yes — there are 4 photos of Brighton Care Center in the photo gallery on this page.

What is the address of Brighton Care Center?

Brighton Care Center is located at 1836 N Fair Oaks Ave, Pasadena, CA 91103.

What is the phone number of Brighton Care Center?

(626) 796-6135 will put you in contact with the team at Brighton Care Center.

Guides for Better Senior Living

Care Cost Calculator: See Prices in Your Area

Nursing Home Data Explorer

Don’t Wait Too Long: 7 Red Flag Signs Your Parent Needs Assisted Living Now

The True Cost of Assisted Living in 2025 – And How Families Are Paying For It

Understanding Senior Living Costs: Pricing Models, Discounts & Financial Assistance