


Hospitalizations per 1,000 days
 Number of hospitalizations per 1,000 long-stay resident days.
1.17
Number of hospitalizations per 1,000 long-stay resident days.
1.17
California average: 2.25
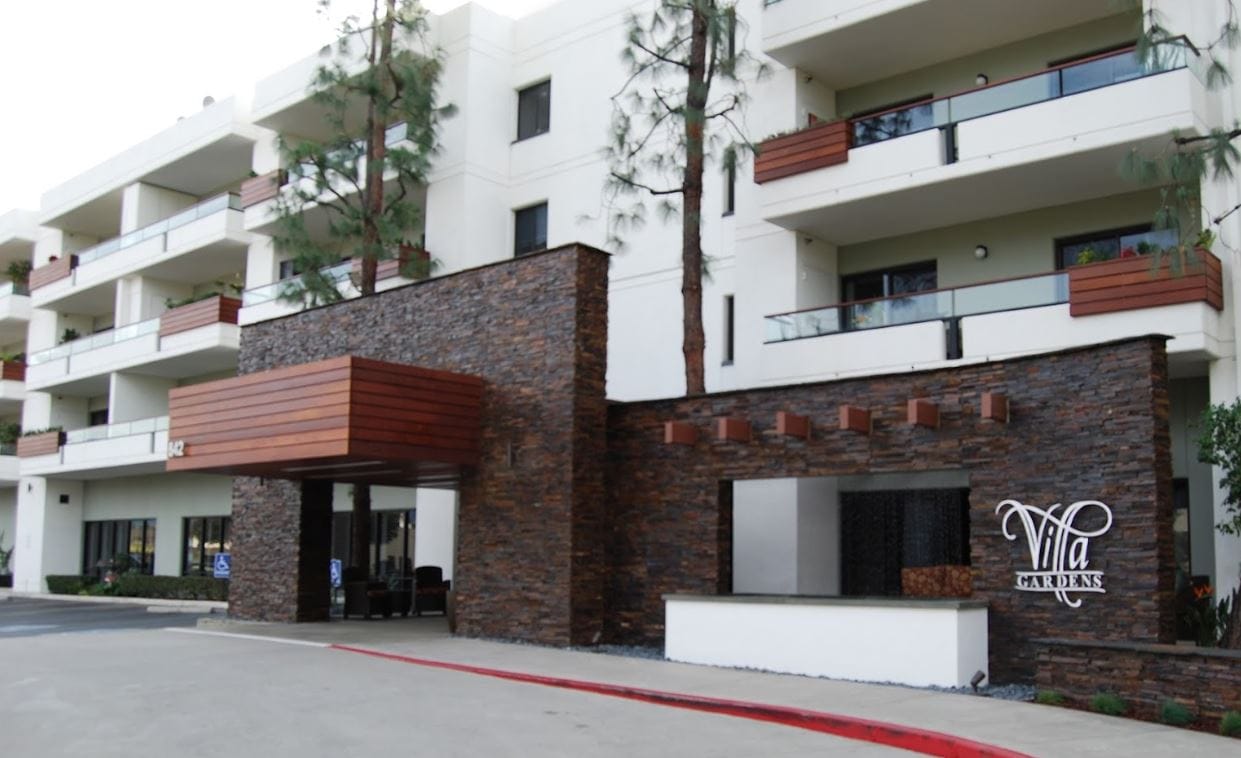


Front Porch Communities and Services operates Villa Gardens Health Center, a 340-bed nursing home situated on Villa Street in Pasadena. This facility has been in business for 26 years under the leadership of administrator Shaun Rushforth, handling regional long-term placements and post-acute rehabilitation. The surrounding neighborhood carries a very high walkability profile, which allows visiting guests and family members to manage most standard errands on foot without needing a vehicle.
The daily floor routine tracks medical care and physical rehabilitation through an on-site nursing team. Daily staffing allocations provide an average of 1 hour and 46 minutes of direct licensed practical nurse coverage per resident, which is combined with registered nurse oversight and nurse aide physical assistance. This workforce handles clinical schedules, medication shifts, and personal mobility monitoring around the clock.
State regulatory inspectors have focused on standard compliance themes at the property, including infection tracking protocols, building environment oversight, medication management systems, and medical chart documentation. The internal team utilizes these regular agency reviews to align its daily administrative and clinical routines. Every day workflows combine these regulatory updates with standard property maintenance, room cleaning, and meal services to keep the large building organized.
Prospective representatives can evaluate how the management team coordinates its daily nursing hours, state compliance records, and pedestrian-friendly neighborhood access. The community links these primary operations with standard institutional features.
| Staff type | Hours / Day / Resident | vs state avg |
|---|---|---|
|
Registered Nurse (RN)
| 20m per day | ▼ 49% State avg: 39m per day · National avg: 41m per day |
|
LPN / LVN
| 1h 46m per day | ▲ 45% State avg: 1h 13m per day · National avg: 52m per day |
|
Nurse Aide
| 3h 4m per day | ▲ 16% State avg: 2h 39m per day · National avg: 2h 21m per day |
|
Weekend Total Nursing
| 4h 39m per day | ▲ 14% State avg: 4h 5m per day · National avg: 3h 26m per day |
|
Physical Therapist
| 8m per day | ▲ 60% State avg: 5m per day · National avg: 4m per day |
|
Weekend RN
| 12m per day | ▼ 60% State avg: 30m per day · National avg: 29m per day |
Villa Gardens Health Center is legally operated by Front Porch Communities And Services, and administered by Shaun Rushforth.
Key information about the people who lead and staff this community.
In California, the Department of Social Services (for assisted living facilities) and the Department of Public Health (for nursing homes) conduct inspections to ensure resident safety and regulatory compliance.
5 points below the California average for nursing homes (81/100)
Rank #945 / 1399 in California Inspection Score — State benchmarked This home is ranked 945th out of 1399 homes in California for Inspection Score. Shows this facility's inspection score compared to the California average among 1399 comparable communities in the ranking pool. Facilities with the same value for a metric share the same rank. Rankings are based only on facilities in California that report data for that category. Facilities without available data are excluded from the ranking. This is a proprietary Assisted Living Magazine score. Inspection score: 76 out of 100. Letter grade C. 5 points below the California average for nursing homes (81/100)
Citations
| This Facility | CA Average | vs. CA Avg |
|---|---|---|---|
|
Total citations
| 10 | 10 | This facility has total citations in line with the California average (10 vs. CA avg 10).— At avg |
|
Serious citations (Type A)
| 6 | 3 | This facility has 100% more serious citations (type a) than a typical California nursing home (6 vs. CA avg 3).↑ 100% worse |
|
Moderate citations (Type B)
| 4 | 4 | This facility has moderate citations (type b) in line with the California average (4 vs. CA avg 4).— At avg |
|
Citations per year
| 2 | 2 | This facility has citations per year in line with the California average (2 vs. CA avg 2).— At avg |
|
Citations per inspection
| 0.7 | 3.3 | This facility has 79% fewer citations per inspection than a typical California nursing home (0.7 vs. CA avg 3.3).↓ 79% better |
Inspections & Visits
| This Facility | CA Average | vs. CA Avg |
|---|---|---|---|
|
Total visits
| 14 | 16 | This facility has 13% fewer total visits than a typical California nursing home (14 vs. CA avg 16).↓ 13% better |
|
Complaint visits
| 3 | 13 | This facility has 77% fewer complaint visits than a typical California nursing home (3 vs. CA avg 13).↓ 77% better |
|
Other visits
| 6 | 7 | This facility has 14% fewer other visits than a typical California nursing home (6 vs. CA avg 7).↓ 14% better |
|
Official inspections
| 5 | 4 | This facility has 25% more official inspections than a typical California nursing home (5 vs. CA avg 4).↑ 25% worse |
|
Complaint investigations
| 3 | 10 | This facility has 70% fewer complaint investigations than a typical California nursing home (3 vs. CA avg 10).↓ 70% better |
These measures show how residents usually do over time at this home, based on health outcomes and preventive care.
California average: 2.25
California average: 1.59
California average: 23.2%
California average: 11.2%
California average: 0.8%
California average: 53.7%
California average: 50.6%
Quality measures are calculated from Minimum Data Set (MDS) assessments. For most measures, lower percentages indicate better care quality.
![]() 1.2 miles from city center
1.2 miles from city center
![]() Estimated distance in miles from Pasadena's city center to Villa Gardens Health Center's address, calculated via Google Maps.
— 5.41 miles to nearest hospital (USC Arcadia Hospital)
Estimated distance in miles from Pasadena's city center to Villa Gardens Health Center's address, calculated via Google Maps.
— 5.41 miles to nearest hospital (USC Arcadia Hospital)
Add your location
The information below is reported by the California Department of Social Services and Department of Public Health.
| Villa Gardens Retirement Community | NH SNF | Pasadena (East Villa Street) | 340
Facility
340
CA AVG
104
Rank
#39 / 1648 | - | - | 3.57
Facility
3.57
CA AVG
4.22
Rank
#253 / 327 | -23% | -15% | $70.3k
Facility
$70.3k
CA AVG
$56.5k
Rank
#300 / 334 | 76
Facility
76
CA AVG
81
Rank
#945 / 1399 | 65
Facility
65
CA AVG
50.2
Rank
#263 / 327 | 5.0
Facility
5.0
CA AVG
4.6
Rank
#222 / 327 | 4 | 19 | - |
79
Facility
79
CA AVG
57
Rank
#450 / 2087 | Providence Group Of California LLC | $11.6MFiscal year ending 12/2023
Facility
$11.6MFiscal year ending 12/2023
CA AVG
$17.0M
Rank
#228 / 327 | $6.2MFiscal year ending 12/2023
Facility
$6.2MFiscal year ending 12/2023
CA AVG
$7.0M
Rank
#240 / 327 | 53.8%Fiscal year ending 12/2023
Facility
53.8%Fiscal year ending 12/2023
CA AVG
45.2%
Rank
#182 / 327 | 55551 | ||||
| Villa Gardens | NH SNF | Pasadena | 340
Facility
340
CA AVG
104
Rank
#39 / 1648 | - | - | 5.18
Facility
5.18
CA AVG
4.22
Rank
#29 / 327 | -12% | +23% | $0
Facility
$0
CA AVG
$56.5k
Rank
#1 / 334 | 84
Facility
84
CA AVG
81
Rank
#730 / 1399 | 38
Facility
38
CA AVG
50.2
Rank
#146 / 327 | 7.6
Facility
7.6
CA AVG
4.6
Rank
#310 / 327 | - | 19 | - |
92
Facility
92
CA AVG
57
Rank
#137 / 2087 | Shaun Rushforth | $10.0MFiscal year ending 03/2024
Facility
$10.0MFiscal year ending 03/2024
CA AVG
$17.0M
Rank
#45 / 327 | $12.0MFiscal year ending 03/2024
Facility
$12.0MFiscal year ending 03/2024
CA AVG
$7.0M
Rank
#66 / 327 | 120%Fiscal year ending 03/2024
Facility
120%Fiscal year ending 03/2024
CA AVG
45.2%
Rank
#265 / 327 | 555429 | ||||
| Foothill Heights Care Center | NH ADC AL RC SNF | Pasadena (North Central) | 49
Facility
49
CA AVG
104
Rank
#1131 / 1648 |
85.9%
Facility
85.9%
CA AVG
73.8
Rank
#436 / 1496 | +16% | 3.97
Facility
3.97
CA AVG
4.22
Rank
#175 / 327 | -53% | -6% | $9.4k
Facility
$9.4k
CA AVG
$56.5k
Rank
#223 / 334 | - | 49
Facility
49
CA AVG
50.2
Rank
#204 / 327 | 3.1
Facility
3.1
CA AVG
4.6
Rank
#70 / 327 | - | 42 | A+ |
69
Facility
69
CA AVG
57
Rank
#767 / 2087 | Foothill Heights Care Center LLC | $7.1MFiscal year ending 12/2023
Facility
$7.1MFiscal year ending 12/2023
CA AVG
$17.0M
Rank
#267 / 327 | $3.6MFiscal year ending 12/2023
Facility
$3.6MFiscal year ending 12/2023
CA AVG
$7.0M
Rank
#311 / 327 | 50.4%Fiscal year ending 12/2023
Facility
50.4%Fiscal year ending 12/2023
CA AVG
45.2%
Rank
#282 / 327 | 555894 | ||||
| St. Vincent Health Care | NH SNF | Pasadena (North Central) | 78
Facility
78
CA AVG
104
Rank
#935 / 1648 |
90.6%
Facility
90.6%
CA AVG
73.8
Rank
#329 / 1496 | +23% | 4.10
Facility
4.10
CA AVG
4.22
Rank
#152 / 327 | -45% | -3% | $0
Facility
$0
CA AVG
$56.5k
Rank
#1 / 334 | - | 52
Facility
52
CA AVG
50.2
Rank
#215 / 327 | 17.3
Facility
17.3
CA AVG
4.6
Rank
#327 / 327 | - | 71 | - |
62
Facility
62
CA AVG
57
Rank
#980 / 2087 | Robert Barrett | $10.5MFiscal year ending 12/2023
Facility
$10.5MFiscal year ending 12/2023
CA AVG
$17.0M
Rank
#248 / 327 | $4.8MFiscal year ending 12/2023
Facility
$4.8MFiscal year ending 12/2023
CA AVG
$7.0M
Rank
#243 / 327 | 45.8%Fiscal year ending 12/2023
Facility
45.8%Fiscal year ending 12/2023
CA AVG
45.2%
Rank
#127 / 327 | 555119 |
Villa Gardens Health Center is located in Pasadena, California.
Here are the financial assistance programs available to residents in California.
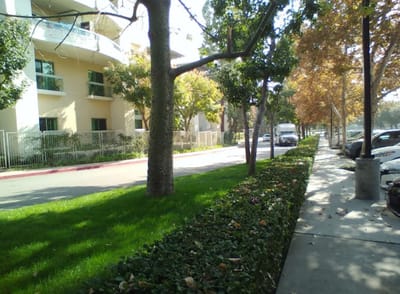
Villa Gardens Health Center is in the East Villa Street neighborhood of Pasadena.
Villa Gardens Health Center is legally operated by Front Porch Communities And Services, and administered by Shaun Rushforth.
Villa Gardens Health Center has a walk score of 79. Very walkable. Most errands can be accomplished on foot, and many essentials are within a short walk.
Villa Gardens Health Center's occupancy is 5.6%.
No, Villa Gardens Health Center has a no-pet policy.
Shaun Rushforth is the administrator of Villa Gardens Health Center.
Villa Gardens Health Center has 340 beds.
Care Cost Calculator: See Prices in Your Area
Nursing Home Data Explorer
Don’t Wait Too Long: 7 Red Flag Signs Your Parent Needs Assisted Living Now
The True Cost of Assisted Living in 2025 – And How Families Are Paying For It
Understanding Senior Living Costs: Pricing Models, Discounts & Financial Assistance


