Villa Gardens
Nursing Home & Nursing Care · Pasadena, CA
CMS overall rating Info CMS (the Centers for Medicare & Medicaid Services) is the federal agency that rates nursing home quality. Its Overall Rating runs from 1 to 5 stars, combining health inspections, staffing, and quality measures, with inspections weighted most heavily.

Villa Gardens

Nursing Home & Nursing Care · Pasadena, CA
CMS overall rating Info CMS (the Centers for Medicare & Medicaid Services) is the federal agency that rates nursing home quality. Its Overall Rating runs from 1 to 5 stars, combining health inspections, staffing, and quality measures, with inspections weighted most heavily.
Calculator: See prices in your area
Villa Gardens accepts Medicare and private pay.

Overview of Villa Gardens

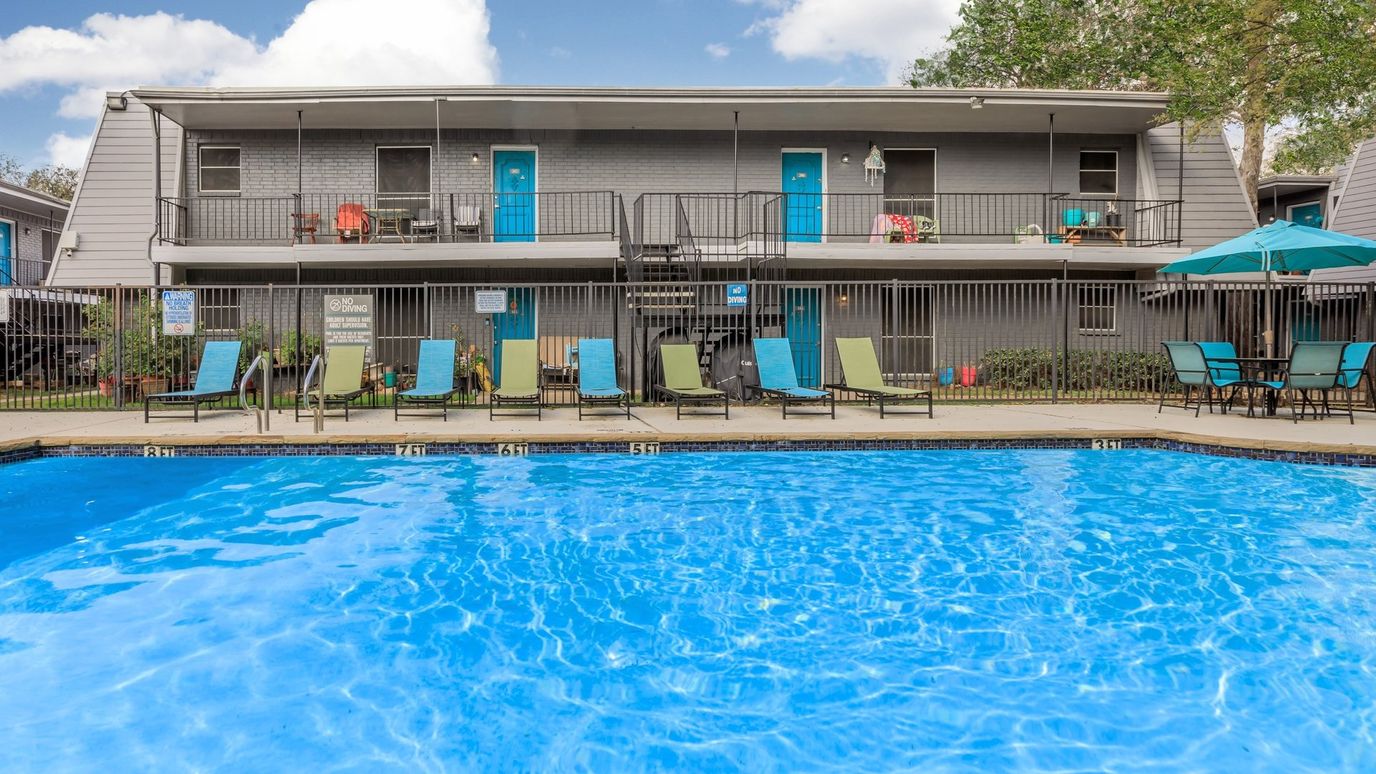
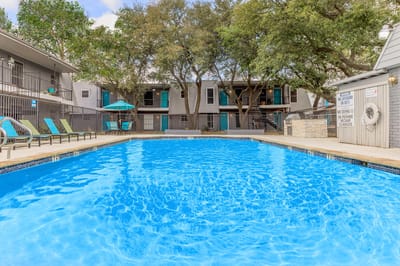
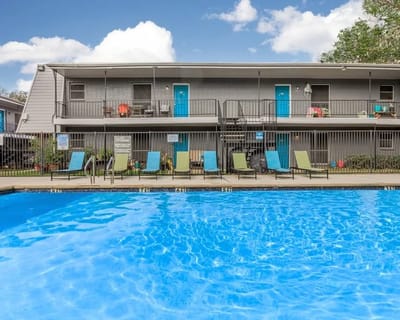
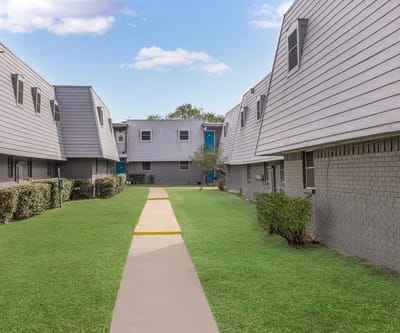
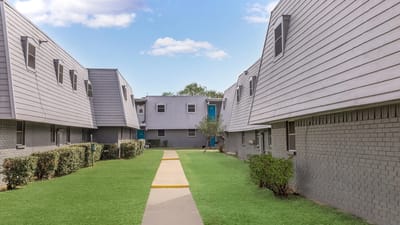
Villa Gardens is a large, 340-bed Continuing Care Retirement Community managed by Front Porch Communities and Services that has been operating for 26 years. The property supports multiple tiers of care on a single campus, but its skilled nursing wing maintains a short-term rehabilitation focus, logging a brief 50-day average length of stay. Payment options are restricted to Medicare and private-pay accounts. Situated just half a mile from the city center, the gated property has a walkability score of 92 out of 100, which allows employees and visiting guests to handle everyday errands entirely on foot.

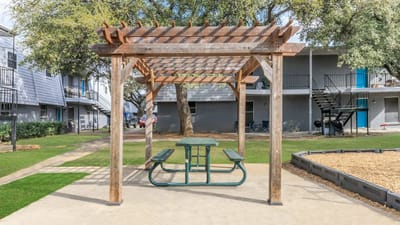
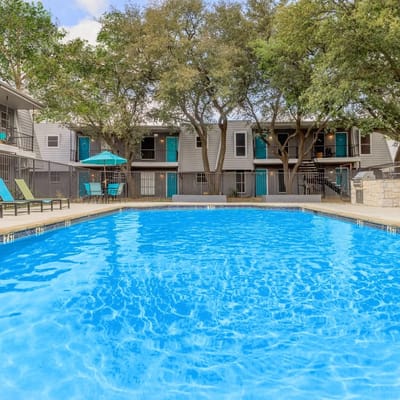
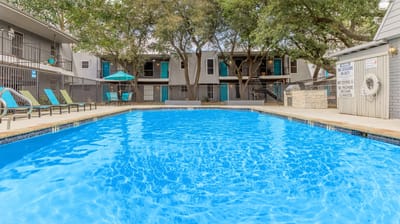
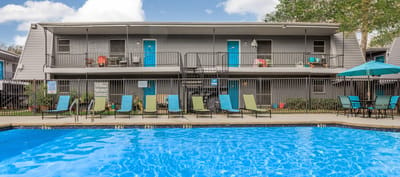
An extensive daily care schedule is backed by a solid lineup of campus amenities and an on-site nurse aide training program. Direct care records from the California Department of Public Health show that the nursing staff delivers an average of 5 hours and 11 minutes of hands-on care per resident each day, a staffing level that remains steady through the weekends. The gated campus features a swimming pool, a sports court, a landscaped barbecue area, chef-prepared meals, and covered parking.

On the regulatory side, public inspection logs from state agencies show that inspectors have occasionally cited the facility for minor deficiencies involving environmental upkeep, infection control, pharmacy tracking, and quality of care. The administration resolved each of these findings following the reviews, and the property carries zero critical or serious enforcement penalties.

Interested individuals researching comprehensive retirement communities or short-term physical therapy options can use these state regulatory filings to assess the property’s operational background. The public documents outline a spacious, highly walkable campus that provides exceptionally high daily nursing hours and extensive lifestyle amenities, balanced against standard regulatory fixes in basic care and maintenance charting.

Quality ratings

Measured by Centers for Medicare & Medicaid Services (CMS)

Overall rating Info The Overall CMS Rating combines results from health inspections, staffing levels and quality measures. Health inspections carry the most weight. Staffing and quality scores can increase or decrease the final rating based on performance compared to state and national standards.
▲ 27.0% Above CA avg. ▲ 27.0% Above CA avg.CA average: 3.1Click the badge to see the full State ranking.Click here to see the full State ranking.
Health Inspection Info Based on the results of the facility's three most recent standard inspections and any complaint investigations. CMS reviews the number, scope, and severity of deficiencies, with more recent findings weighted more heavily.
▲ 7.3% Above CA avg. ▲ 7.3% Above CA avg.CA average: 2.8Click the badge to see the full State ranking.Click here to see the full State ranking.
Staffing Info Measures average nursing staff hours per resident per day, including Registered Nurses (RNs) and total nursing staff. Ratings are adjusted based on the level of care residents require and are compared to state and national benchmarks.
▲ 27.5% Above CA avg. ▲ 27.5% Above CA avg.CA average: 3.1Click the badge to see the full State ranking.Click here to see the full State ranking.
Quality Measures Info Based on clinical and physical health indicators reported to CMS, such as hospital readmissions, falls, pressure ulcers, and improvements in mobility. These measures reflect how well residents' health needs are being managed.
▲ 22.4% Above CA avg. ▲ 22.4% Above CA avg.CA average: 4.1Click the badge to see the full State ranking.Click here to see the full State ranking.

Staffing hours breakdown

Info Daily nursing hours per resident by staff type, reported to CMS. Higher is generally better — compare this facility to state and national averages to see where staffing stands.

Hours per resident per day — compared to California state averages

Total nursing care / resident Info This home is ranked 31st out of 354 homes in California for nurse hours. Total adjusted nursing hours per resident per day, combining RN, LPN, and aide time. CMS adjusts this for case-mix so facilities can be fairly compared.
5h 11m per day
Rank #31 / 354Nurse hours — State benchmarkedThis home is ranked 31st out of 354 homes in California. Shows adjusted nurse hours per resident per day benchmarked to the California average, with a ranking across 354 California facilities. More hours mean more direct care. The national average is about 3.5 hrs; below 3.0 is a red flag.Rankings are based only on facilities in California that report data for that category. Facilities without available data are excluded from the ranking.Click the rank badge to see the full State ranking.Click here to see the full State ranking.
This facility California avg (4h 13m per day)
vs California avg
+23%

2 of 6 metrics below state avg

Standout metric LPN / LVN is +41% above state avg
Staff type Hours / Day / Resident vs state avg
Registered Nurse (RN) Info RNs hold the highest nursing license and can assess residents, interpret test results, and direct care plans. More RN hours per day often signals stronger clinical oversight and faster response to health changes. 33m per day ▼ 19% State avg: 40m per day · National avg: 41m per day
LPN / LVN Info Licensed Practical Nurses (LPNs) or Licensed Vocational Nurses (LVNs) deliver routine hands-on care — medication administration, wound dressing, and monitoring vital signs. They work under RN supervision and make up a large share of daily bedside care. 1h 42m per day ▲ 41% State avg: 1h 12m per day · National avg: 52m per day
Nurse Aide Info Certified Nurse Aides (CNAs) provide the most direct day-to-day assistance: bathing, dressing, feeding, and mobility. Nurse aide hours are typically the largest staffing category and directly affect residents' quality of life. 3h 1m per day ▲ 14% State avg: 2h 39m per day · National avg: 2h 20m per day
Weekend Total Nursing Info Combined nursing hours (RN + LPN + Nurse Aide) per resident per day on weekends. Staffing often drops on weekends — this figure reveals whether the facility maintains adequate coverage outside of weekday hours. 4h 39m per day ▲ 14% State avg: 4h 5m per day · National avg: 3h 27m per day
Physical Therapist Info Hours per resident per day provided by licensed Physical Therapists (PTs) or PT Assistants. PT services help residents recover mobility after injury or illness and are especially important for post-acute (short-stay) rehabilitation. 8m per day ▲ 25% State avg: 6m per day · National avg: 4m per day
Weekend RN Info Registered nurse hours specifically on weekends. Facilities sometimes reduce RN presence on Saturdays and Sundays — a low weekend RN figure compared to weekday hours can indicate reduced clinical oversight when most administrative staff are absent. 19m per day ▼ 38% State avg: 31m per day · National avg: 29m per day

Capacity and availability

Avg. Length of Stay
50 days
Bed community size
340-bed community Rank #39 / 1657Bed count — State benchmarkedThis home is ranked 39th out of 1657 homes in California. Shows this facility's certified or reported bed count compared to other California facilities. Larger communities may offer more amenities, programs, and on-site services for residents and families.Rankings are based only on facilities in California that report data for that category. Facilities without available data are excluded from the ranking.Click the rank badge to see the full State ranking.Click here to see the full State ranking.
A large-scale community that may provide a wide range of amenities, services, and structured programs.
Years in operation
26 years in operation Rank #205 / 1487Years in operation — State benchmarkedThis home is ranked 205th out of 1487 homes in California. Shows how long this facility has been in operation compared to other California facilities. Longer operating histories may benefit residents, families, and staff.Rankings are based only on facilities in California that report data for that category. Facilities without available data are excluded from the ranking.Click the rank badge to see the full State ranking.Click here to see the full State ranking.
A longer operating history, which may indicate experience navigating regulations and delivering ongoing care.
Walk Score
Walk Score: 92 / 100 Rank #137 / 2092Walk Score — State benchmarkedThis home is ranked 137th out of 2092 homes in California. Shows how walkable this facility's neighborhood is compared to the average Walk Score across California facilities. Higher scores benefit residents, families, and staff.Rankings are based only on facilities in California that report data for that category. Facilities without available data are excluded from the ranking.Click the rank badge to see the full State ranking.Click here to see the full State ranking.
Walker's paradise. Daily errands do not require a car, with many shops and services nearby.

About this community

License Details

Facility TypeRcfe-continuing Care Retirement Community
StatusLicensed
IssuanceJune 30, 1999
CountyLos Angeles
CMS Certification Number555429

Ownership & Operating Entity

Villa Gardens is administered by Shaun Rushforth.

Owner NameFront Porch Communities And Services

Additional Policies & Features

Pets Allowed

Amenities & Lifestyle

Beautiful Landscaping
Covered Parking
Easy Access To Freeways
Easy Access To Shopping
Gated Access
Guest Parking
Laundry Facility
On-Call Maintenance
Pet Friendly
Picnic Area With Barbecue
Play Area
Public Parks Nearby
Shimmering Swimming Pool
Sports Court
Touring HoursMonday - Friday 9:00 AM - 6:00 PM, Saturday 10:00 AM - 5:00 PM

Contact Villa Gardens

Inspection History

In California, the Department of Social Services (for assisted living facilities) and the Department of Public Health (for nursing homes) conduct inspections to ensure resident safety and regulatory compliance.

Inspection Score Info A composite 0–100 score combining this facility's inspections, citations, complaints, and enforcement actions relative to the California state average. The score below shows how many points this facility sits above or below the typical California nursing home score (the benchmark); higher is better.

3 points above the California average for nursing homes (81/100)

Rank #731 / 1401 in California Inspection Score — State benchmarked This home is ranked 731st out of 1401 homes in California. Shows this facility's inspection score compared to the California average among 1401 comparable communities in the ranking pool. Rankings are based only on facilities in California that report data for that category. Facilities without available data are excluded from the ranking. Inspection score: 84 out of 100. Letter grade B. 3 points above the California average for nursing homes (81/100)

Inspection Scorecard Info This scorecard compares key inspection, citation, and complaint metrics at this facility against the California state average. Metrics rated ≥15% worse than average are highlighted in red; those ≥15% better are highlighted in green.

Since 2021 vs. California state average
Overall vs. CA average 1 Worse Metrics worse than California average:
• Official inspections (25% above)
8 Better Metrics better than California average:
• Total citations (10% below)
• Citations per year (10% below)
• Citations per inspection (82% below)
• Total visits (13% below)
• Complaint visits (77% below)
• Other visits (14% below)
• Total complaints (86% below)
• Complaints per year (86% below)
Latest Inspection November 25, 2025 Complaint Investigation

Citations Info Citations are formal regulatory issues recorded during state inspections.

This Facility CA Average vs. CA Avg
Total citations Info Formal regulatory issues recorded by inspectors across all inspection types. 9 10 This facility has 10% fewer total citations than a typical California nursing home (9 vs. CA avg 10).↓ 10% better
Citations per year Info Average citations per year since 2021. 1.8 2 This facility has 10% fewer citations per year than a typical California nursing home (1.8 vs. CA avg 2).↓ 10% better
Citations per inspection Info Average citations per inspection. 0.6 3.3 This facility has 82% fewer citations per inspection than a typical California nursing home (0.6 vs. CA avg 3.3).↓ 82% better

Inspections & Visits Info State inspections evaluate whether the facility meets health and safety standards.

This Facility CA Average vs. CA Avg
Total visits Info Combined count of complaint visits, other regulatory visits, and official scheduled inspections. 14 16 This facility has 13% fewer total visits than a typical California nursing home (14 vs. CA avg 16).↓ 13% better
Complaint visits Info On-site visits triggered by formal complaints filed by residents, families, or staff. 3 13 This facility has 77% fewer complaint visits than a typical California nursing home (3 vs. CA avg 13).↓ 77% better Rank #441 / 1397 Complaint visits — State benchmarked This home is ranked 441st out of 1397 homes in California. Shows this facility's # of complaint visits compared to the California average among 1397 comparable communities in the ranking pool. Rankings are based only on facilities in California that report data for that category. Facilities without available data are excluded from the ranking.
Other visits Info Regulatory visits that are neither routine inspections nor complaint investigations — administrative check-ins, follow-up reviews, licensing-related visits. 6 7 This facility has 14% fewer other visits than a typical California nursing home (6 vs. CA avg 7).↓ 14% better
Official inspections Info Routine, scheduled inspections conducted by state regulators to evaluate whether the facility meets federal and state standards. 5 4 This facility has 25% more official inspections than a typical California nursing home (5 vs. CA avg 4).↑ 25% worse

Complaints & Investigations Info Complaints are formal concerns filed by residents, families, or staff. Investigations are on-site follow-ups.

This Facility CA Average vs. CA Avg
Total complaints Info Formal expressions of concern made by residents, families, or staff. 2 14 This facility has 86% fewer total complaints than a typical California nursing home (2 vs. CA avg 14).↓ 86% better
Complaints per year Info Average complaints per year since 2021. 0.4 2.8 This facility has 86% fewer complaints per year than a typical California nursing home (0.4 vs. CA avg 2.8).↓ 86% better

Inspection Reports Summary Info An editor-reviewed summary of the themes and findings across this facility's recent inspection reports.

  • The most recent inspection on November 25, 2025 substantiated one abuse-related deficiency, and the facility terminated the responsible staff and provided in-service training.
  • The May 9, 2025 annual inspection found two safety deficiencies: water temperature above 120°F in two rooms and missing skid mats in nine showers.
  • The June 18, 2024 inspection cited two deficiencies including one staff member lacking background clearance, resulting in civil penalties and required plans of correction.

Health Inspection History

Inspections since 2022
Total health inspections 5

California average 12.5


Last Health inspection on Oct 2024

Total health citations
38 Rank #160 / 361Health citations — State benchmarkedThis home is ranked 160th out of 361 homes in California. Shows this facility's total health deficiency citations benchmarked to the California State average, with a ranking across all 361 CA facilities. Lower citation counts earn a better rank.Rankings are based only on facilities in California that report data for that category. Facilities without available data are excluded from the ranking.Click the rank badge to see the full State ranking.Click here to see the full State ranking.

California average 50.2

Citations per inspection
7.6 Rank #341 / 361Citations per inspection — State benchmarkedThis home is ranked 341st out of 361 homes in California. Shows average deficiency citations per CMS inspection for this facility versus the California mean across 361 facilities with citation data. Lower is better.Rankings are based only on facilities in California that report data for that category. Facilities without available data are excluded from the ranking.Click the rank badge to see the full State ranking.Click here to see the full State ranking.

California average 4.65


Health citations are formal notices following inspections when they fail to comply with safety and care standards.

34 of 38 citations resulted from standard inspections; and 4 of 38 resulted from complaint investigations.

Breakdown of citation severity (last 4 years)
Critical health citations
0
100% better than California average

California average: 0.4


Serious health citations
0
100% better than California average

California average: 1

0 critical citations California average: 0.4

0 serious citations California average: 1

38 moderate citations California average: 47.2

0 minor citations California average: 1.5
Citations history (last 4 years)
Environmental moderate citation Oct 04, 2024
Corrected

Infection Control moderate citation Oct 04, 2024
Corrected

Nutrition moderate citation Oct 04, 2024
Corrected

Nutrition moderate citation Oct 04, 2024
Corrected

Staffing Data

Reporting period: October 1 – December 31, 2025 (Q4 2025). Source: CMS Payroll-Based Journal report.

Total staff 90
Employees 60
Contractors 30
Staff to resident ratio 2.43 : 1
34% more staff per resident than California average
California average ratio: 1.81 : 1 California average ratio: 1.81 : 1See full California ranking
Avg staff/day 34
Average shift 7.6 hours
0% compared with California average
California average: 7.7 hours California average shift: 7.7 hoursSee full California ranking
Total staff hours (quarter) 23,716

Nursing staff breakdown

Q4 2025 · Oct 1 – Dec 31 More info This data comes from the CMS Payroll-Based Journal report covering October 1 – December 31, 2025.
Registered Nurse

Manages medical care and health needs.

RN Staff Info 7 total: 5 full-time employees and 2 contractors. 7
Average shift length Info Average shift length. Calculated as total hours divided by days worked and average staff per day. 8.4 hours
Licensed Practical Nurse

Assists with medical care and medications.

LPN Staff Info 19 total: 16 full-time employees and 3 contractors. 19
Average shift length Info Average shift length. Calculated as total hours divided by days worked and average staff per day. 8.2 hours
Certified Nursing Assistant

Helps with daily care and mobility.

CNA Staff Info 35 total: 32 full-time employees and 3 contractors. 35
Average shift length Info Average shift length. Calculated as total hours divided by days worked and average staff per day. 7.7 hours

Contractor staffing

Q4 2025 · Oct 1 – Dec 31 More info This data comes from the CMS Payroll-Based Journal report covering October 1 – December 31, 2025.

Total hours from contractors

13.5%

3,211 contractor hours this quarter

Respiratory Therapy Technician: 5 Speech Language Pathologist: 4 Physical Therapy Aide: 4 Certified Nursing Assistant: 3 Licensed Practical Nurse: 3 Occupational Therapy Assistant: 3 Registered Nurse: 2 Physical Therapy Assistant: 2 Qualified Social Worker: 2 Administrator: 1 Other Physician: 1

Staff by category

Q4 2025 · Oct 1 – Dec 31 More info This data comes from the CMS Payroll-Based Journal report covering October 1 – December 31, 2025.
Certified Nursing Assistant 32 3 35 11,551 92 100% 7.7
Licensed Practical Nurse 16 3 19 4,981 92 100% 8.2
Registered Nurse 5 2 7 1,576 92 100% 8.4
RN Director of Nursing 4 0 4 1,548 70 76% 8.3
Physical Therapy Assistant 0 2 2 523 71 77% 7.4
Speech Language Pathologist 0 4 4 519 70 76% 6.3
Nurse Practitioner 1 0 1 512 64 70% 8
Other Dietary Services Staff 1 0 1 493 60 65% 8.2
Respiratory Therapy Technician 0 5 5 486 73 79% 5.7
Physical Therapy Aide 0 4 4 454 68 74% 6.7
Mental Health Service Worker 1 0 1 424 53 58% 8
Qualified Social Worker 0 2 2 316 58 63% 5.5
Administrator 0 1 1 264 66 72% 4
Occupational Therapy Assistant 0 3 3 50 8 9% 5.5
Other Physician 0 1 1 21 3 3% 7
35 Certified Nursing Assistant
% of Days 100%
19 Licensed Practical Nurse
% of Days 100%
7 Registered Nurse
% of Days 100%
4 RN Director of Nursing
% of Days 76%
2 Physical Therapy Assistant
% of Days 77%
4 Speech Language Pathologist
% of Days 76%
1 Nurse Practitioner
% of Days 70%
1 Other Dietary Services Staff
% of Days 65%
5 Respiratory Therapy Technician
% of Days 79%
4 Physical Therapy Aide
% of Days 74%
1 Mental Health Service Worker
% of Days 58%
2 Qualified Social Worker
% of Days 63%
1 Administrator
% of Days 72%
3 Occupational Therapy Assistant
% of Days 9%
1 Other Physician
% of Days 3%

Penalties and fines

Federal penalties imposed by CMS for regulatory violations, including civil money penalties (fines) and denials of payment for new Medicare/Medicaid admissions.

Source: CMS Penalties Database

No penalties in the past 3 years

No civil money penalties or payment denials were reported in the last 3 years.

Quality of care over time

These measures show how residents usually do over time at this home, based on health outcomes and preventive care.

High-risk clinical events score Info A composite score based on pressure ulcers, falls with injury, weight loss, walking ability decline, and activities of daily living decline. 12.5
88% worse than California average

California average: 6.6

Functional decline score Info A composite score based on activities of daily living decline, walking ability decline, and incontinence. 25.6
126% worse than California average

California average: 11.3

Long-stay resident measures
Need for Help with Daily Activities Increased Info Percent of long-stay residents whose need for help with daily activities has increased 24.3%
120% worse than California average

California average: 11.1%

Walking Ability Worsened Info Percent of long-stay residents whose ability to move independently worsened 23.5%
96% worse than California average

California average: 12.0%

Low Risk Residents with Bowel/Bladder Incontinence Info Percent of low risk long-stay residents who lose control of their bowels or bladder 29.1%
158% worse than California average

California average: 11.3%

Falls with Major Injury Info Percent of long-stay residents experiencing one or more falls with major injury 7.2%
334% worse than California average

California average: 1.7%

High Risk Residents with Pressure Ulcers Info Percent of long-stay high risk residents with pressure ulcers 3.9%
21% better than California average

California average: 5.0%

Urinary Tract Infection Info Percent of long-stay residents with a urinary tract infection 1.1%
15% better than California average

California average: 1.2%

Lost Too Much Weight Info Percent of long-stay residents who lose too much weight 3.4%
19% better than California average

California average: 4.2%

Depressive Symptoms Info Percent of long-stay residents who have depressive symptoms 0.0%
100% better than California average

California average: 6.7%

Antipsychotic Use Info Percent of long-stay residents who received an antipsychotic medication 0.0%
100% better than California average

California average: 10.1%

Pneumococcal Vaccine Info Percent of long-stay residents assessed and appropriately given the pneumococcal vaccine 100.0%
In line with California average

California average: 98.5%

Influenza Vaccine Info Percent of long-stay residents assessed and appropriately given the seasonal influenza vaccine 100.0%
In line with California average

California average: 98.2%

Short-stay resident measures
Pneumococcal Vaccine Info Percent of short-stay residents assessed and appropriately given the pneumococcal vaccine 98.0%
In line with California average

California average: 94.0%

Antipsychotic medication increase Info Percent of short-stay residents who newly received an antipsychotic medication 0.6%
57% better than California average

California average: 1.5%

Influenza Vaccine Info Percent of short-stay residents assessed and appropriately given the seasonal influenza vaccine 97.4%
In line with California average

California average: 93.2%

Breakdown by payment type

Medicare

78% of new residents, usually for short-term rehab.

Typical stay 21 days

Private pay

21% of new residents, often for short stays.

Typical stay 9 - 10 months

Facility Characteristics

Source: CMS Long-Term Care Facility Characteristics (Data as of Jan 2026)

Total residents 37
Medicare
12
32.4% of residents
Medicaid
10
27% of residents
Private pay or other
15
40.5% of residents
Programs & Services
Residents Group

Residents meet regularly to discuss policies, care quality, and activities

Nurse Aide Training

State-approved Nurse Aide Training and Competency Evaluation Program on-site

CCRC

Part of a Continuing Care Retirement Community offering multiple care levels

Active Resident Council

Organized group of residents that meets regularly to discuss facility policies, quality of life, and activities.

Finances and operations

Based on CMS SNF Cost Report for fiscal year ending in 03/2024.

Nonprofit
Nonprofit Corporation
Net patient revenue Info Net patient revenue — what the home actually collects for resident care, after contractual allowances, bad debt and discounts are subtracted from its gross charges (CMS cost report, Worksheet G-3). It covers resident care only; money the home earns from other sources is shown separately as "Other income."
$10.0M
Net patient income Info Net patient income: net patient revenue minus the home's total operating expenses. A positive figure means it earns more from resident care than it spends to deliver it; a negative figure means the opposite. It excludes non-operating "other income."
-$16.8M
Nonprofit Nonprofit Corporation
Net patient revenue Info Net patient revenue — what the home actually collects for resident care, after contractual allowances, bad debt and discounts are subtracted from its gross charges (CMS cost report, Worksheet G-3). It covers resident care only; money the home earns from other sources is shown separately as "Other income."
$10.0M Rank #48 / 355Revenue — State benchmarkedThis home is ranked 48th out of 355 homes in California. Shows this facility's annual revenue compared to the California average. Higher revenue generally means more resources for staffing and capital — read alongside Payroll %.Rankings are based only on facilities in California that report data for that category. Facilities without available data are excluded from the ranking.Click the rank badge to see the full State ranking.Click here to see the full State ranking.
Net patient income Info Net patient income: net patient revenue minus the home's total operating expenses. A positive figure means it earns more from resident care than it spends to deliver it; a negative figure means the opposite. It excludes non-operating "other income."
-$16.8M
Other income Info Money the home earns outside of resident care — such as investments, grants, rentals and other non-operating sources (CMS cost report, Worksheet G-3). It is tracked separately from net patient revenue: it is not part of that figure, and it is not included in net patient income.
$20.4M
Payroll costs Info Staff salaries plus wage-related costs — benefits such as payroll taxes, health insurance and retirement — from the home's own accounting records (CMS cost report, Worksheet A). Contract or agency labor is counted separately, under other operating costs. Rank #63 / 355Payroll — State benchmarkedThis home is ranked 63rd out of 355 homes in California. Shows total annual staff payroll benchmarked to the California average. Higher payroll investment relative to peers often signals better staffing and less reliance on cheaper contract labor.Rankings are based only on facilities in California that report data for that category. Facilities without available data are excluded from the ranking.Click the rank badge to see the full State ranking.Click here to see the full State ranking.
$12.0M 120% of net patient revenue Info Payroll as a share of revenue: staff salaries and wage-related benefits divided by net patient revenue. A higher figure means more of each revenue dollar goes to staff pay. Rank #282 / 355Payroll % — State benchmarkedThis home is ranked 282nd out of 355 homes in California. Shows payroll as a percentage of revenue versus the California average. Well-run California facilities typically land around 55–67% — the top third Statewide. Below 25% may signal understaffing or heavy agency use — read with Staffing ratings.Rankings are based only on facilities in California that report data for that category. Facilities without available data are excluded from the ranking.Click the rank badge to see the full State ranking.Click here to see the full State ranking.
Other operating costs Info Everything it costs to run the home apart from payroll — food, utilities, supplies, maintenance, contract labor and administration. Calculated as total operating expense minus payroll (staff salaries and wage-related benefits).
$14.8M
Total costs Info The home's total operating expense for the year — all the costs of running it, salaries included (CMS cost report, Worksheet G-3).
$26.8M

Who this home usually serves

TYPE OF STAY

Mostly short-term rehab stays

Most residents typically stay for a few weeks or months before returning home or moving on.

Most new residents arrive under Medicare (78% of admissions), and a typical Medicare stay runs around 21 days.

Admissions
279 total

Coverage residents most often arrive under.

Medicare 78%
Private pay 21%
Discharges
292 total

Coverage residents most often leave under.

Medicare 67%
Private pay 30%
Medicaid 3%

Places of interest near Villa Gardens

Address 0.5 miles from city center Info Estimated distance in miles from Pasadena's city center to Villa Gardens's address, calculated via Google Maps.

Calculate Travel Distance to Villa Gardens

Add your location

Address

Compare Nursing Homes around Pasadena

The information below is reported by the California Department of Social Services and Department of Public Health.

5 facilities compared · CMS & CA Dept. of Health data

Villa Gardens
NH
NC
Pasadena
340
Facility 340
CA AVG 103
Rank #39 / 1657
- -
5.18
Facility 5.18
CA AVG 4.22
Rank #31 / 354
-12% +23%
$0
Facility $0
CA AVG $56.5k
Rank #1 / 362
84
Facility 84
CA AVG 81
Rank #731 / 1401
38
Facility 38
CA AVG 50.2
Rank #160 / 361
7.6
Facility 7.6
CA AVG 4.6
Rank #341 / 361
- 19 -
92
Facility 92
CA AVG 57
Rank #137 / 2092
Shaun Rushforth
$10.0M
Facility $10.0M
CA AVG $17.0M
Rank #48 / 355
$12.0M
Facility $12.0M
CA AVG $7.0M
Rank #63 / 355
120%
Facility 120%
CA AVG 45.2%
Rank #282 / 355
555429
Villa Gardens Retirement Community
NH
NC
Pasadena (East Villa Street)
340
Facility 340
CA AVG 103
Rank #39 / 1657
- -
3.57
Facility 3.57
CA AVG 4.22
Rank #269 / 354
-23% -15%
$70.3k
Facility $70.3k
CA AVG $56.5k
Rank #326 / 362
76
Facility 76
CA AVG 81
Rank #946 / 1401
65
Facility 65
CA AVG 50.2
Rank #286 / 361
5.0
Facility 5.0
CA AVG 4.6
Rank #243 / 361
4 91 -
79
Facility 79
CA AVG 57
Rank #451 / 2092
Providence Group Of California LLC
$11.6M
Facility $11.6M
CA AVG $17.0M
Rank #243 / 355
$6.2M
Facility $6.2M
CA AVG $7.0M
Rank #249 / 355
53.8%
Facility 53.8%
CA AVG 45.2%
Rank #176 / 355
55551
Foothill Heights Care Center
NH
ADC
AL
RC
Pasadena (North Central)
49
Facility 49
CA AVG 103
Rank #1138 / 1657
86.1%
Facility 86.1%
CA AVG 84.7%
Rank #432 / 1537
+2%
3.97
Facility 3.97
CA AVG 4.22
Rank #184 / 354
-53% -6%
$9.4k
Facility $9.4k
CA AVG $56.5k
Rank #240 / 362
-
49
Facility 49
CA AVG 50.2
Rank #224 / 361
3.1
Facility 3.1
CA AVG 4.6
Rank #77 / 361
- 42 A+
69
Facility 69
CA AVG 57
Rank #768 / 2092
Foothill Heights Care Center LLC
$7.1M
Facility $7.1M
CA AVG $17.0M
Rank #286 / 355
$3.6M
Facility $3.6M
CA AVG $7.0M
Rank #326 / 355
50.4%
Facility 50.4%
CA AVG 45.2%
Rank #302 / 355
555894
Two Palms Care Center
NH
Pasadena (Pasadena Council District 4)
112
Facility 112
CA AVG 103
Rank #631 / 1657
- - - - -
$0
Facility $0
CA AVG $56.5k
Rank #1 / 362
64
Facility 64
CA AVG 81
Rank #1247 / 1401
38
Facility 38
CA AVG 50.2
Rank #160 / 361
5.4
Facility 5.4
CA AVG 4.6
Rank #273 / 361
- 21 A+
49
Facility 49
CA AVG 57
Rank #1370 / 2092
Estrella Choy
$7.1M
Facility $7.1M
CA AVG $17.0M
Rank #339 / 355
$3.3M
Facility $3.3M
CA AVG $7.0M
Rank #316 / 355
46.2%
Facility 46.2%
CA AVG 45.2%
Rank #18 / 355
55464
Pasadena Nursing Center
NH
ADC
RC
Pasadena (North Central)
108
Facility 108
CA AVG 103
Rank #666 / 1657
75.0%
Facility 75.0%
CA AVG 84.7%
Rank #824 / 1537
-11%
4.14
Facility 4.14
CA AVG 4.22
Rank #160 / 354
-3% -2%
$9.1k
Facility $9.1k
CA AVG $56.5k
Rank #235 / 362
62
Facility 62
CA AVG 81
Rank #1271 / 1401
85
Facility 85
CA AVG 50.2
Rank #318 / 361
4.3
Facility 4.3
CA AVG 4.6
Rank #196 / 361
4 81 -
64
Facility 64
CA AVG 57
Rank #923 / 2092
Gardena Retirement Center, Inc
$7.2M
Facility $7.2M
CA AVG $17.0M
Rank #293 / 355
$4.4M
Facility $4.4M
CA AVG $7.0M
Rank #296 / 355
61.3%
Facility 61.3%
CA AVG 45.2%
Rank #108 / 355
555213

Financial Assistance for
Nursing Home in California

Villa Gardens is located in PASADENA, California.
Here are the financial assistance programs available to residents in California.

Get Financial aid guidance

Multipurpose Senior Services Program

MSSP (Medi-Cal Waiver)

Age 65+
General California resident, Medi-Cal eligible, nursing home risk.
Income Limits (2025) ~$2,829/month 300% FBR, individual
Asset Limits $2,000 (individual), $3,000 (couple).
CA

County-managed; waitlists possible.

Benefits
In-home support (4-6 hours/day) Respite care (14 days/year) Meals (~$6/meal) Transportation (8 trips/month) Care management

In-Home Supportive Services (IHSS)

California IHSS

Age 65+
General California resident, Medicaid-eligible or low-income.
Income Limits ~$1,732/month individual, Medi-Cal threshold
Asset Limits $2,000 individual
CA

Can hire family as caregivers.

Benefits
Personal care (up to 283 hours/month) Homemaker services Respite (varies)

Multipurpose Senior Services Program (MSSP)

CA MSSP

Age 65+
General California resident, Medi-Cal-eligible, nursing home-eligible but community-capable.
Income Limits ~$2,829/month 300% FBR, individual
Asset Limits $2,000 individual
CA

Available in 38 counties; waitlists common.

Benefits
Case management Respite care (up to 10 days/year) Minor home mods (avg. $500) Adult day care (~$50/day)

Property Tax Postponement Program (PTP)

CA PTP

Age 62+
General California resident, own and live in home, 40% equity.
Income Limits (2025) ~$51,500/year household, adjusted annually
Asset Limits Equity-based; no strict asset cap.
CA

Deferred taxes accrue interest (5% as of 2024); repaid upon sale/death.

Benefits
Property tax deferral (avg. $1,000-$3,000/year, varies by county)

Assisted Living Waiver (ALW)

CA ALW

Age 65+ or disabled
General California resident, Medi-Cal-eligible, nursing home-eligible.
Income Limits ~$2,829/month 300% FBR, individual
Asset Limits $2,000 individual
CA

Available in 15 counties (e.g., LA, Sacramento); waitlists common.

Benefits
Personal care in ALFs (5-7 hours/day) Medication management Social services

California CARES Program

CA CARES

Age
General Caregivers of California residents 60+ needing help with 3+ daily activities; no caregiver age limit.
Income Limits No strict limit; cost-sharing above ~$2,500/month threshold.
Asset Limits Not applicable; need-based.
CA

High demand in urban areas; complements IHSS respite.

Benefits
Respite care (up to 10 days/year) Counseling (4-6 sessions/year) Training (2-3 workshops/year) Supplies (~$200/year)

Frequently Asked Questions about Villa Gardens

Who is the owner of Villa Gardens?

The legal owner and operator of Villa Gardens is Front Porch Communities And Services.

Is Villa Gardens in a walkable area?

Villa Gardens has a walk score of 92. Walker's paradise. Daily errands do not require a car, with many shops and services nearby.

What is the occupancy rate at Villa Gardens?

Villa Gardens's occupancy is 79.9%.

Does Villa Gardens operate as a for-profit or non-profit?

Villa Gardens is registered as a non-profit in CA.

Who is the administrator of Villa Gardens?

Shaun Rushforth is the administrator of Villa Gardens.

How many beds does Villa Gardens have?

Villa Gardens has 340 beds.

Has Villa Gardens had any recent citations?

Villa Gardens has had 9 recently reported citations.

Guides for Better Senior Living

Care Cost Calculator: See Prices in Your Area

Nursing Home Data Explorer

Don’t Wait Too Long: 7 Red Flag Signs Your Parent Needs Assisted Living Now

The True Cost of Assisted Living in 2025 – And How Families Are Paying For It

Understanding Senior Living Costs: Pricing Models, Discounts & Financial Assistance