Brightwater Assisted Living
Nursing Home, Assisted Living, Independent Living & Memory Care · South Carolina, SC
CMS overall rating Info CMS (the Centers for Medicare & Medicaid Services) is the federal agency that rates nursing home quality. Its Overall Rating runs from 1 to 5 stars, combining health inspections, staffing, and quality measures, with inspections weighted most heavily.

Brightwater Assisted Living

Nursing Home, Assisted Living, Independent Living & Memory Care · South Carolina, SC
CMS overall rating Info CMS (the Centers for Medicare & Medicaid Services) is the federal agency that rates nursing home quality. Its Overall Rating runs from 1 to 5 stars, combining health inspections, staffing, and quality measures, with inspections weighted most heavily.
Calculator: See prices in your area
Brightwater Assisted Living accepts Medicare and private pay.

Overview of Brightwater Assisted Living

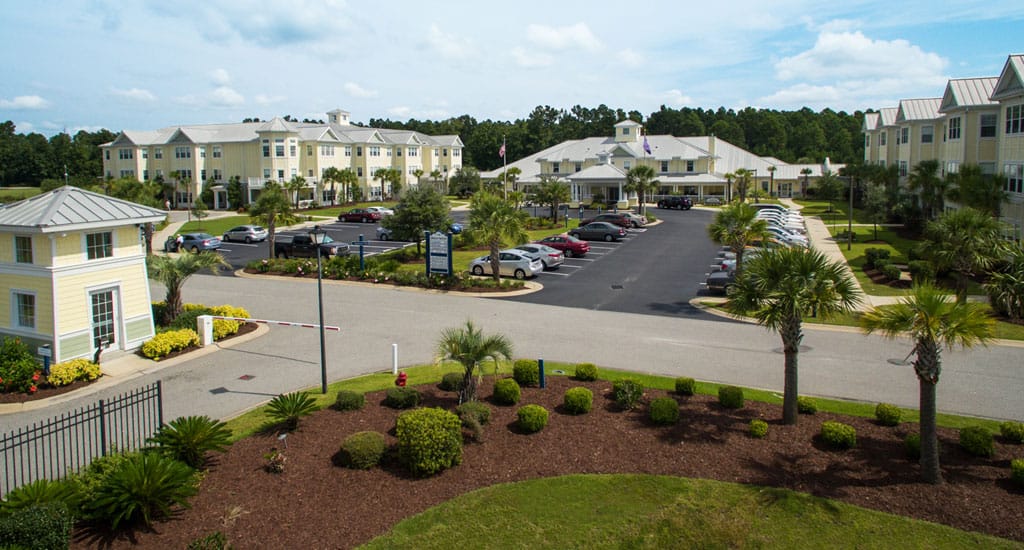
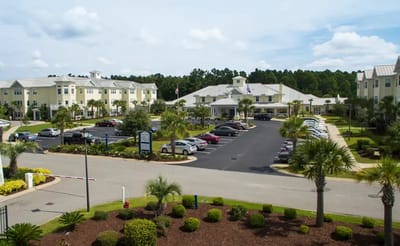
Brightwater Assisted Living is a privately-owned senior living community in Myrtle Beach, South Carolina, offering assisted living, memory care, skilled nursing, and short-term rehabilitation. Licensed as a Community Residential Care Facility (CRCF) with 56 beds, the community is owned by Brightwater Retirement LLC and administered by David Dunn, with management affiliated with the Maxwell Group. Medicare and private-pay arrangements are also accepted. Notably, the community received six national awards, a distinction that places it among the more highly recognized senior living providers in the Grand Strand market.

CMS ratings position the community well above South Carolina averages overall, with particularly strong performance in staffing measures. Moreover, total nursing care hours average five hours per resident per day, exceeding statewide benchmarks and ranking among the stronger staffing levels among skilled nursing communities in the state. Weekend nursing coverage and staff-to-resident ratio also significantly outperform the South Carolina average. Health inspection scores are similarly above statewide benchmarks, reflecting generally favorable regulatory performance.

Since 2022, the community has received 15 health citations, including two categorized as critical in severity. While this exceeds the South Carolina average for critical citations, no serious citations were identified, and all deficiencies have been corrected. Additionally, a civil money penalty was issued in July 2023, substantially below the South Carolina average penalty amount, and no payment denials were reported.

Several long-stay quality indicators compare favorably with state averages, with measures related to declines in daily living activities, urinary tract infection rates, and vaccination coverage performing particularly well. Other measures, including rates of bowel and bladder incontinence, falls with major injury, and pressure ulcers, were also above state averages and can be worthwhile discussion points for families evaluating care needs and clinical oversight.

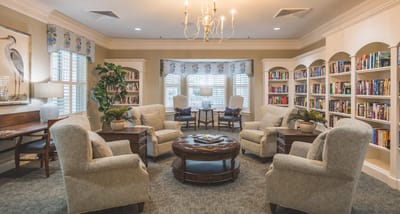
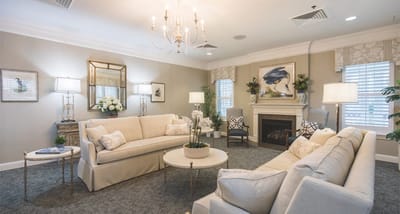
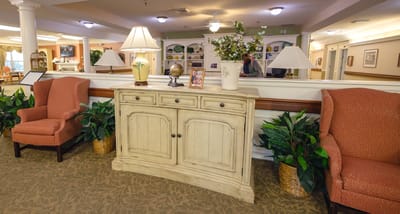
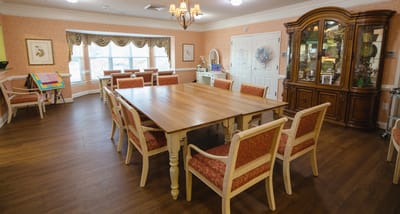
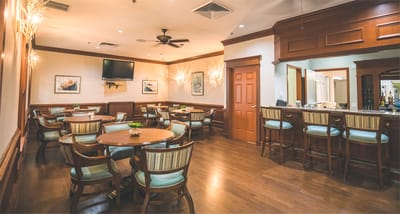
An indoor heated therapy pool, secured courtyard spaces, wellness classes, concierge services, transportation assistance, a professional salon, pet-friendly accommodations, and a 24-hour emergency response system are among the amenities available. Dining services are made-to-order restaurant-style meals.

Combining elevated staffing levels, rehabilitation-focused amenities, and broad care offerings, Brightwater Assisted Living is well-suited for older adults seeking rehabilitation, assisted living, skilled nursing, or memory care services within a highly staffed and amenity-rich environment in the Myrtle Beach area, particularly families exploring Medicare-supported or private-pay senior care options.

Quality ratings

Measured by Centers for Medicare & Medicaid Services (CMS)

Overall rating Info The Overall CMS Rating combines results from health inspections, staffing levels and quality measures. Health inspections carry the most weight. Staffing and quality scores can increase or decrease the final rating based on performance compared to state and national standards.
▲ 40.6% Above SC avg. ▲ 40.6% Above SC avg.SC average: 2.8Click the badge to see the full State ranking.Click here to see the full State ranking.
Health Inspection Info Based on the results of the facility's three most recent standard inspections and any complaint investigations. CMS reviews the number, scope, and severity of deficiencies, with more recent findings weighted more heavily.
▲ 9.4% Above SC avg. ▲ 9.4% Above SC avg.SC average: 2.7Click the badge to see the full State ranking.Click here to see the full State ranking.
Staffing Info Measures average nursing staff hours per resident per day, including Registered Nurses (RNs) and total nursing staff. Ratings are adjusted based on the level of care residents require and are compared to state and national benchmarks.
▲ 72.9% Above SC avg. ▲ 72.9% Above SC avg.SC average: 2.9Click the badge to see the full State ranking.Click here to see the full State ranking.
Quality Measures Info Based on clinical and physical health indicators reported to CMS, such as hospital readmissions, falls, pressure ulcers, and improvements in mobility. These measures reflect how well residents' health needs are being managed.
▲ 19.0% Above SC avg. ▲ 19.0% Above SC avg.SC average: 3.4Click the badge to see the full State ranking.Click here to see the full State ranking.

Staffing hours breakdown

Info Daily nursing hours per resident by staff type, reported to CMS. Higher is generally better — compare this facility to state and national averages to see where staffing stands.

Hours per resident per day — compared to South Carolina state averages

Total nursing care / resident Info This home is ranked 15th out of 121 homes in South Carolina for nurse hours. Total adjusted nursing hours per resident per day, combining RN, LPN, and aide time. CMS adjusts this for case-mix so facilities can be fairly compared.
5h 0m per day
Rank #15 / 121Nurse hours — State benchmarkedThis home is ranked 15th out of 121 homes in South Carolina. Shows adjusted nurse hours per resident per day benchmarked to the South Carolina average, with a ranking across 121 South Carolina facilities. More hours mean more direct care. The national average is about 3.5 hrs; below 3.0 is a red flag.Rankings are based only on facilities in South Carolina that report data for that category. Facilities without available data are excluded from the ranking.Click the rank badge to see the full State ranking.Click here to see the full State ranking.
This facility South Carolina avg (4h 0m per day)
vs South Carolina avg
+25%

0 of 6 metrics below state avg

Standout metric Registered Nurse (RN) is +78% above state avg
Staff typeHours / Day / Residentvs state avg
Registered Nurse (RN) Info RNs hold the highest nursing license and can assess residents, interpret test results, and direct care plans. More RN hours per day often signals stronger clinical oversight and faster response to health changes. 1h 7m per day ▲ 78% State avg: 38m per day · National avg: 41m per day
LPN / LVN Info Licensed Practical Nurses (LPNs) or Licensed Vocational Nurses (LVNs) deliver routine hands-on care — medication administration, wound dressing, and monitoring vital signs. They work under RN supervision and make up a large share of daily bedside care. 1h 19m per day ▲ 31% State avg: 1h 0m per day · National avg: 52m per day
Nurse Aide Info Certified Nurse Aides (CNAs) provide the most direct day-to-day assistance: bathing, dressing, feeding, and mobility. Nurse aide hours are typically the largest staffing category and directly affect residents' quality of life. 3h 11m per day ▲ 43% State avg: 2h 13m per day · National avg: 2h 20m per day
Weekend Total Nursing Info Combined nursing hours (RN + LPN + Nurse Aide) per resident per day on weekends. Staffing often drops on weekends — this figure reveals whether the facility maintains adequate coverage outside of weekday hours. 4h 58m per day ▲ 48% State avg: 3h 22m per day · National avg: 3h 27m per day
Physical Therapist Info Hours per resident per day provided by licensed Physical Therapists (PTs) or PT Assistants. PT services help residents recover mobility after injury or illness and are especially important for post-acute (short-stay) rehabilitation. 8m per day ▲ 62% State avg: 5m per day · National avg: 4m per day
Weekend RN Info Registered nurse hours specifically on weekends. Facilities sometimes reduce RN presence on Saturdays and Sundays — a low weekend RN figure compared to weekday hours can indicate reduced clinical oversight when most administrative staff are absent. 44m per day ▲ 73% State avg: 25m per day · National avg: 29m per day

Capacity and availability

Avg. Length of Stay
36 days
Bed community size
56-bed community Rank #231 / 309Bed count — State benchmarkedThis home is ranked 231st out of 309 homes in South Carolina. Shows this facility's certified or reported bed count compared to other South Carolina facilities. Larger communities may offer more amenities, programs, and on-site services for residents and families.Rankings are based only on facilities in South Carolina that report data for that category. Facilities without available data are excluded from the ranking.Click the rank badge to see the full State ranking.Click here to see the full State ranking.
A moderately sized community that may balance personal attention with shared amenities and social activities.

About this community

Occupancy

Occupancy rate
70%
Rank #105 / 131Occupancy rate — State benchmarkedThis home is ranked 105th out of 131 homes in South Carolina. Shows this facility's occupancy rate versus the South Carolina average, with its Statewide rank out of 131. Higher occupancy signals strong local demand and financial stability.Rankings are based only on facilities in South Carolina that report data for that category. Facilities without available data are excluded from the ranking.Click the rank badge to see the full State ranking.Click here to see the full State ranking.
Lower than the South Carolina average: 82.1%
Occupied beds
39 / 56
Average occupied beds in South Carolina homes 90 beds

Awards

6X National Award Winner

License Details

Facility TypeHl- Community Residential Care Facility
ExpirationApril 30, 2026 Expired
CountyHorry
License NumberCRC-1489
Business TypeLimited Liability
Accreditations6X National Award Winner

Ownership & Operating Entity

Brightwater Assisted Living is legally operated by Brightwater Retirement Llc, and administered by David Dunn.

Owner NameBrightwater Retirement LLC

Safety & Compliance

Emergency SystemsYes

Therapy & Rehabilitation

2 services
Rehabilitation Services
Respite Care

Staffing & Medical

1 service
24-Hour Staffing

Memory & Specialized Care

1 service
Dedicated Alzheimer's Unit

Contact Information

Amenities & Lifestyle

Wellness Classes
Professional Hair Care Salon
Secured Courtyard
Indoor Heated Therapy Pool
24-Hour Emergency Call System
Personalized Care Plans
Personal Transportation
Concierge Service
Pet-Friendly Options
Specific ProgramsActive Adult, Short-Term Rehab

Dining & Nutrition

Food DescriptionDining includes a complimentary continental breakfast and made-to-order, restaurant-style meals at lunch and dinner.

Contact Brightwater Assisted Living

Health Inspection History

Inspections since 2022
Total health inspections 3

South Carolina average 3.9


Last Health inspection on Apr 2025

Total health citations
15 Rank #78 / 122Health citations — State benchmarkedThis home is ranked 78th out of 122 homes in South Carolina. Shows this facility's total health deficiency citations benchmarked to the South Carolina State average, with a ranking across all 122 SC facilities. Lower citation counts earn a better rank.Rankings are based only on facilities in South Carolina that report data for that category. Facilities without available data are excluded from the ranking.Click the rank badge to see the full State ranking.Click here to see the full State ranking.

South Carolina average 13.7

Citations per inspection
5 Rank #101 / 122Citations per inspection — State benchmarkedThis home is ranked 101st out of 122 homes in South Carolina. Shows average deficiency citations per CMS inspection for this facility versus the South Carolina mean across 122 facilities with citation data. Lower is better.Rankings are based only on facilities in South Carolina that report data for that category. Facilities without available data are excluded from the ranking.Click the rank badge to see the full State ranking.Click here to see the full State ranking.

South Carolina average 3.44


Health citations are formal notices following inspections when they fail to comply with safety and care standards.

14 of 15 citations resulted from standard inspections; and 1 of 15 came from combined inspections (standard and complaint).

Breakdown of citation severity (last 4 years)
Critical health citations
2
100% worse than South Carolina average

South Carolina average: 1


Serious health citations
0
100% better than South Carolina average

South Carolina average: 0.3

2 critical citations South Carolina average: 1

0 serious citations South Carolina average: 0.3

13 moderate citations South Carolina average: 12.3

0 minor citations South Carolina average: 0.1
Citations history (last 4 years)
Infection Control moderate citation Apr 30, 2025
Corrected

Pharmacy moderate citation Apr 30, 2025
Corrected

Pharmacy moderate citation Apr 30, 2025
Corrected

Quality of Care moderate citation Apr 30, 2025
Corrected

Staffing Data

Reporting period: October 1 – December 31, 2025 (Q4 2025). Source: CMS Payroll-Based Journal report.

Total staff 146
Employees 100
Contractors 46
Staff to resident ratio 3.04 : 1
66% more staff per resident than South Carolina average
South Carolina average ratio: 1.84 : 1 South Carolina average ratio: 1.84 : 1See full South Carolina ranking
Avg staff/day 41
Average shift 8.2 hours
0% compared with South Carolina average
South Carolina average: 7.9 hours South Carolina average shift: 7.9 hoursSee full South Carolina ranking
Total staff hours (quarter) 30,972

Nursing staff breakdown

Q4 2025 · Oct 1 – Dec 31 More info This data comes from the CMS Payroll-Based Journal report covering October 1 – December 31, 2025.
Registered Nurse

Manages medical care and health needs.

RN Staff Info All 15 RN Staff are full-time employees. No contractors work on this role. 15
Average shift length Info Average shift length. Calculated as total hours divided by days worked and average staff per day. 8.7 hours
Licensed Practical Nurse

Assists with medical care and medications.

LPN Staff Info 32 total: 24 full-time employees and 8 contractors. 32
Average shift length Info Average shift length. Calculated as total hours divided by days worked and average staff per day. 8.5 hours
Certified Nursing Assistant

Helps with daily care and mobility.

CNA Staff Info All 50 CNA Staff are full-time employees. No contractors work on this role. 50
Average shift length Info Average shift length. Calculated as total hours divided by days worked and average staff per day. 9.4 hours

Contractor staffing

Q4 2025 · Oct 1 – Dec 31 More info This data comes from the CMS Payroll-Based Journal report covering October 1 – December 31, 2025.

Total hours from contractors

13.4%

4,155 contractor hours this quarter

Licensed Practical Nurse: 8 Qualified Social Worker: 8 Speech Language Pathologist: 6 Feeding Assistant: 6 Physical Therapy Assistant: 5 Physical Therapy Aide: 4 Respiratory Therapy Technician: 4 Medical Director: 2 Other Physician: 1 Therapeutic Recreation Specialist: 1 Occupational Therapy Assistant: 1

Staff by category

Q4 2025 · Oct 1 – Dec 31 More info This data comes from the CMS Payroll-Based Journal report covering October 1 – December 31, 2025.
Certified Nursing Assistant5005014,26892100%9.4
Licensed Practical Nurse248325,90192100%8.5
Registered Nurse150152,9589199%8.7
Clinical Nurse Specialist5051,5996672%8
Speech Language Pathologist0669307986%6.8
Physical Therapy Assistant0557147076%5.6
Other Dietary Services Staff2026827582%6.5
Respiratory Therapy Technician0445978087%4.8
Physical Therapy Aide0445957076%5.8
Administrator2025126470%8
Dental Services Staff1014966267%8
Nurse Practitioner1014886166%8
Feeding Assistant0664326470%5.8
Qualified Social Worker0883775863%6
Medical Director0222733942%7
Other Physician011692325%3
Therapeutic Recreation Specialist011591314%4.5
Occupational Therapy Assistant011231112%2.1
50 Certified Nursing Assistant
% of Days 100%
32 Licensed Practical Nurse
% of Days 100%
15 Registered Nurse
% of Days 99%
5 Clinical Nurse Specialist
% of Days 72%
6 Speech Language Pathologist
% of Days 86%
5 Physical Therapy Assistant
% of Days 76%
2 Other Dietary Services Staff
% of Days 82%
4 Respiratory Therapy Technician
% of Days 87%
4 Physical Therapy Aide
% of Days 76%
2 Administrator
% of Days 70%
1 Dental Services Staff
% of Days 67%
1 Nurse Practitioner
% of Days 66%
6 Feeding Assistant
% of Days 70%
8 Qualified Social Worker
% of Days 63%
2 Medical Director
% of Days 42%
1 Other Physician
% of Days 25%
1 Therapeutic Recreation Specialist
% of Days 14%
1 Occupational Therapy Assistant
% of Days 12%

Penalties and fines

Includes penalties issued in 2023

Federal penalties imposed by CMS for regulatory violations, including civil money penalties (fines) and denials of payment for new Medicare/Medicaid admissions.

Source: CMS Penalties Database (Data as of Jan 2026)

Total fines amount $7K Rank #65 / 123Federal fines — State benchmarkedThis home is ranked 65th out of 123 homes in South Carolina. Shows this facility's cumulative CMS federal fine dollars versus the South Carolina average among facilities with fines, and where it ranks among 123 facilities in the pool. Lower total dollars mean a better rank.Rankings are based only on facilities in South Carolina that report data for that category. Facilities without available data are excluded from the ranking.Click the rank badge to see the full State ranking.Click here to see the full State ranking.
78% lower than South Carolina average

South Carolina average: $34K

Number of fines 1
59% fewer fines than South Carolina average

South Carolina average: 2.4

Payment Denials Info Serious action where Medicare and/or Medicaid temporarily stops payments for new residents until issues are fixed. 0
100% fewer payment denials than South Carolina average

South Carolina average: 0.1

Fines amount comparison
This facility $7K
South Carolina average $34K
Penalty History

Penalties are imposed by CMS for violations of federal nursing home regulations.

1 penalty in the past 3 years

Jul 17, 2023 · $7K

Civil Money Penalty Info Fines imposed for noncompliance, which can be assessed per day or per instance of violation. Jul 17, 2023
$7K

Last updated: Jan 2026

Quality of care over time

These measures show how residents usually do over time at this home, based on health outcomes and preventive care.

High-risk clinical events score Info A composite score based on pressure ulcers, falls with injury, weight loss, walking ability decline, and activities of daily living decline. 6.7
23% better than South Carolina average

South Carolina average: 8.7

Functional decline score Info A composite score based on activities of daily living decline, walking ability decline, and incontinence. 15.6
In line with South Carolina average

South Carolina average: 15.5

Long-stay resident measures
Need for Help with Daily Activities Increased Info Percent of long-stay residents whose need for help with daily activities has increased 6.1%
53% better than South Carolina average

South Carolina average: 13.1%

Low Risk Residents with Bowel/Bladder Incontinence Info Percent of low risk long-stay residents who lose control of their bowels or bladder 25.1%
48% worse than South Carolina average

South Carolina average: 17.0%

Falls with Major Injury Info Percent of long-stay residents experiencing one or more falls with major injury 4.7%
58% worse than South Carolina average

South Carolina average: 3.0%

High Risk Residents with Pressure Ulcers Info Percent of long-stay high risk residents with pressure ulcers 8.2%
34% worse than South Carolina average

South Carolina average: 6.1%

Urinary Tract Infection Info Percent of long-stay residents with a urinary tract infection 0.0%
100% better than South Carolina average

South Carolina average: 1.6%

Lost Too Much Weight Info Percent of long-stay residents who lose too much weight 7.8%
27% worse than South Carolina average

South Carolina average: 6.2%

Depressive Symptoms Info Percent of long-stay residents who have depressive symptoms 3.9%
40% worse than South Carolina average

South Carolina average: 2.8%

Antipsychotic Use Info Percent of long-stay residents who received an antipsychotic medication 15.5%
6% worse than South Carolina average

South Carolina average: 14.5%

Pneumococcal Vaccine Info Percent of long-stay residents assessed and appropriately given the pneumococcal vaccine 92.9%
In line with South Carolina average

South Carolina average: 90.5%

Influenza Vaccine Info Percent of long-stay residents assessed and appropriately given the seasonal influenza vaccine 92.3%
In line with South Carolina average

South Carolina average: 90.6%

Short-stay resident measures
Pneumococcal Vaccine Info Percent of short-stay residents assessed and appropriately given the pneumococcal vaccine 86.9%
9% better than South Carolina average

South Carolina average: 79.5%

Antipsychotic medication increase Info Percent of short-stay residents who newly received an antipsychotic medication 1.7%
In line with South Carolina average

South Carolina average: 1.7%

Influenza Vaccine Info Percent of short-stay residents assessed and appropriately given the seasonal influenza vaccine 89.9%
15% better than South Carolina average

South Carolina average: 78.0%

Breakdown by payment type

Medicare

71% of new residents, usually for short-term rehab.

Typical stay 27 days

Private pay

29% of new residents, often for short stays.

Typical stay 1 - 2 months

Facility Characteristics

Source: CMS Long-Term Care Facility Characteristics (Data as of Jan 2026)

Total residents 48
Medicare
30
62.5% of residents
Private pay or other
18
37.5% of residents
Programs & Services
Residents Group

Residents meet regularly to discuss policies, care quality, and activities

CCRC

Part of a Continuing Care Retirement Community offering multiple care levels

Active Resident Council

Organized group of residents that meets regularly to discuss facility policies, quality of life, and activities.

Finances and operations

Based on CMS SNF Cost Report for fiscal year ending in 12/2023.

Privately-owned community
Operated by a single business entity.
Net patient revenue Info Net patient revenue — what the home actually collects for resident care, after contractual allowances, bad debt and discounts are subtracted from its gross charges (CMS cost report, Worksheet G-3). It covers resident care only; money the home earns from other sources is shown separately as "Other income."
$8.8M
Net patient income Info Net patient income: net patient revenue minus the home's total operating expenses. A positive figure means it earns more from resident care than it spends to deliver it; a negative figure means the opposite. It excludes non-operating "other income."
-$14.2M
Privately-owned community Operated by a single business entity.
Net patient revenue Info Net patient revenue — what the home actually collects for resident care, after contractual allowances, bad debt and discounts are subtracted from its gross charges (CMS cost report, Worksheet G-3). It covers resident care only; money the home earns from other sources is shown separately as "Other income."
$8.8M Rank #22 / 125Revenue — State benchmarkedThis home is ranked 22nd out of 125 homes in South Carolina. Shows this facility's annual revenue compared to the South Carolina average. Higher revenue generally means more resources for staffing and capital — read alongside Payroll %.Rankings are based only on facilities in South Carolina that report data for that category. Facilities without available data are excluded from the ranking.Click the rank badge to see the full State ranking.Click here to see the full State ranking.
Net patient income Info Net patient income: net patient revenue minus the home's total operating expenses. A positive figure means it earns more from resident care than it spends to deliver it; a negative figure means the opposite. It excludes non-operating "other income."
-$14.2M
Other income Info Money the home earns outside of resident care — such as investments, grants, rentals and other non-operating sources (CMS cost report, Worksheet G-3). It is tracked separately from net patient revenue: it is not part of that figure, and it is not included in net patient income.
$10.0M
Payroll costs Info Staff salaries plus wage-related costs — benefits such as payroll taxes, health insurance and retirement — from the home's own accounting records (CMS cost report, Worksheet A). Contract or agency labor is counted separately, under other operating costs. Rank #35 / 125Payroll — State benchmarkedThis home is ranked 35th out of 125 homes in South Carolina. Shows total annual staff payroll benchmarked to the South Carolina average. Higher payroll investment relative to peers often signals better staffing and less reliance on cheaper contract labor.Rankings are based only on facilities in South Carolina that report data for that category. Facilities without available data are excluded from the ranking.Click the rank badge to see the full State ranking.Click here to see the full State ranking.
$6.7M 76.7% of net patient revenue Info Payroll as a share of revenue: staff salaries and wage-related benefits divided by net patient revenue. A higher figure means more of each revenue dollar goes to staff pay. Rank #105 / 125Payroll % — State benchmarkedThis home is ranked 105th out of 125 homes in South Carolina. Shows payroll as a percentage of revenue versus the South Carolina average. Well-run South Carolina facilities typically land around 53–64% — the top third Statewide. Below 25% may signal understaffing or heavy agency use — read with Staffing ratings.Rankings are based only on facilities in South Carolina that report data for that category. Facilities without available data are excluded from the ranking.Click the rank badge to see the full State ranking.Click here to see the full State ranking.
Other operating costs Info Everything it costs to run the home apart from payroll — food, utilities, supplies, maintenance, contract labor and administration. Calculated as total operating expense minus payroll (staff salaries and wage-related benefits).
$16.2M
Total costs Info The home's total operating expense for the year — all the costs of running it, salaries included (CMS cost report, Worksheet G-3).
$22.9M

Who this home usually serves

TYPE OF STAY

Mostly short-term rehab stays

Most residents typically stay for a few weeks or months before returning home or moving on.

Most new residents arrive under Medicare (71% of admissions), and a typical Medicare stay runs around 27 days.

Admissions
478 total

Coverage residents most often arrive under.

Medicare 71%
Private pay 29%
Discharges
475 total

Coverage residents most often leave under.

Medicare 63%
Private pay 37%

Places of interest near Brightwater Assisted Living

Address 2923.0 miles from city center Info Estimated distance in miles from Myrtle Beach's city center to Brightwater Assisted Living's address, calculated via Google Maps.

Calculate Travel Distance to Brightwater Assisted Living

Add your location

Address

Compare Nursing Homes around South Carolina

The information below is reported by the South Carolina Department of Public Health, Bureau of Healthcare Quality.

5 facilities compared · CMS & SC Dept. of Health data

Wildewood Downs Retirement Community
NH
AL
IL
MC
Columbia (Williamsburg East)
57
Facility 57
SC AVG 90
Rank #229 / 309
28.1%
Facility 28.1%
SC AVG 82.1%
Rank #127 / 131
-66%
5.41
Facility 5.41
SC AVG 4.00
Rank #10 / 121
+300%+35%
$3.7k
Facility $3.7k
SC AVG $34.8k
Rank #56 / 123
13
Facility 13
SC AVG 13.7
Rank #71 / 122
4.3
Facility 4.3
SC AVG 3.4
Rank #92 / 122
-16A+
33
Facility 33
SC AVG 32
Rank #119 / 232
Diana Chavis
$6.6M
Facility $6.6M
SC AVG $13.0M
Rank #38 / 125
$6.1M
Facility $6.1M
SC AVG $5.4M
Rank #59 / 125
92.9%
Facility 92.9%
SC AVG 44%
Rank #101 / 125
425385
Wesley Commons
NH
AL
IL
MC
Greenwood (Parkwood)
80
Facility 80
SC AVG 90
Rank #168 / 309
90.9%
Facility 90.9%
SC AVG 82.1%
Rank #26 / 131
+11%
4.60
Facility 4.60
SC AVG 4.00
Rank #23 / 121
+59%+15%
$14.5k
Facility $14.5k
SC AVG $34.8k
Rank #88 / 123
6
Facility 6
SC AVG 13.7
Rank #20 / 122
2.0
Facility 2.0
SC AVG 3.4
Rank #14 / 122
177A+
0
Facility 0
SC AVG 32
Rank #229 / 232
Wesley Commons
$8.8M
Facility $8.8M
SC AVG $13.0M
Rank #74 / 125
$3.8M
Facility $3.8M
SC AVG $5.4M
Rank #112 / 125
43.1%
Facility 43.1%
SC AVG 44%
Rank #120 / 125
425078
Brightwater Assisted Living
NH
AL
IL
MC
Myrtle Beach
56
Facility 56
SC AVG 90
Rank #231 / 309
70.0%
Facility 70.0%
SC AVG 82.1%
Rank #105 / 131
-15%
5.00
Facility 5.00
SC AVG 4.00
Rank #15 / 121
+10%+25%
$7.3k
Facility $7.3k
SC AVG $34.8k
Rank #65 / 123
15
Facility 15
SC AVG 13.7
Rank #78 / 122
5.0
Facility 5.0
SC AVG 3.4
Rank #101 / 122
249--Brightwater Retirement LLC
$8.8M
Facility $8.8M
SC AVG $13.0M
Rank #22 / 125
$6.7M
Facility $6.7M
SC AVG $5.4M
Rank #35 / 125
76.7%
Facility 76.7%
SC AVG 44%
Rank #105 / 125
425395
Life Care Center of Hilton Head
NH
NC
Hilton Head Island
88
Facility 88
SC AVG 90
Rank #144 / 309
59.9%
Facility 59.9%
SC AVG 82.1%
Rank #116 / 131
-27%
3.68
Facility 3.68
SC AVG 4.00
Rank #72 / 121
+74%-8%
$8.3k
Facility $8.3k
SC AVG $34.8k
Rank #72 / 123
16
Facility 16
SC AVG 13.7
Rank #85 / 122
4.0
Facility 4.0
SC AVG 3.4
Rank #84 / 122
159-
23
Facility 23
SC AVG 32
Rank #152 / 232
John Oehler
$5.1M
Facility $5.1M
SC AVG $13.0M
Rank #110 / 125
$4.3M
Facility $4.3M
SC AVG $5.4M
Rank #106 / 125
85%
Facility 85%
SC AVG 44%
Rank #24 / 125
425147
Brookdale Anderson -
NH
AL
IL
MC
Anderson (Windsor Place)
160
Facility 160
SC AVG 90
Rank #20 / 309
--------------
43
Facility 43
SC AVG 32
Rank #71 / 232
$5.9M
Facility $5.9M
SC AVG $13.0M
Rank #119 / 125
$3.3M
Facility $3.3M
SC AVG $5.4M
Rank #115 / 125
56.1%
Facility 56.1%
SC AVG 44%
Rank #2 / 125
425398

Financial Assistance for
Nursing Home in South Carolina

Brightwater Assisted Living is located in MYRTLE BEACH, South Carolina.
Here are the financial assistance programs available to residents in South Carolina.

Get Financial aid guidance

Community Long Term Care (CLTC)

SC Medicaid CLTC

Age 65+ or disabled
General South Carolina resident, Medicaid-eligible, nursing home-level care need.
Income Limits (2025) ~$2,829/month 300% FBR, individual
Asset Limits $2,000 (individual), $3,000 (couple).
SC

High rural demand; waitlists possible.

Benefits
Personal care (5-7 hours/day) Respite (240 hours/year) Adult day care ($60/day) Home modifications ($1,500 avg.)

South Carolina Respite Care Program

SC NFCSP Respite

Age Caregiver of someone 60+ (or with dementia)
General South Carolina resident.
Income Limits No strict limit; prioritizes low-income.
Asset Limits Not applicable.
SC

Limited slots; rural/urban balance.

Benefits
In-home respite (4-6 hours/day) Adult day care (~$60/day) Short-term facility care (up to 5 days)

Medicare Savings Program (MSP)

South Carolina Medicare Savings Program

Age 65+ or disabled
General SC resident, Medicare Part A/B.
Income Limits (2025) ~$2,510/month (QMB), ~$3,380/month (SLMB), ~$3,598/month (QI)—individual.
Asset Limits $9,430 (individual), $14,130 (couple).
SC

Three tiers; includes Extra Help for Part D; no waitlist.

Benefits
Covers Part B premiums ($174.70/month) Deductibles ($240/year) Copays (~20%)

VA Aid and Attendance (A&A) and Housebound Benefits

South Carolina VA Aid and Attendance/Housebound

Age 65+ or disabled veteran/spouse
General SC resident, wartime service, need for ADL help (A&A) or homebound.
Income Limits (2025) Net income < ~$1,984/month (veteran with dependent, A&A); pension offsets income.
Asset Limits ~$155,356 net worth limit
SC

High veteran population; supports rural/urban care needs.

Benefits
Cash (~$1,433-$2,642/month veteran, ~$951-$1,318 spouse) for care costs (e.g., in-home, assisted living)

Senior Farmers’ Market Nutrition Program (SFMNP)

South Carolina SFMNP

Age 60+
General SC resident, low-income.
Income Limits (2025) ~$2,322/month individual, 185% FPL
Asset Limits Not assessed.
SC

Vouchers (~$50/season); serves ~20,000 annually via 10 AAAs.

Benefits
Vouchers (~$50/season) for fresh produce at approved markets

Homestead Exemption Program

South Carolina Homestead Exemption

Age 65+ (or disabled/blind)
General SC resident 1+ year, homeowner.
Income Limits (2025) None; tax-based eligibility.
Asset Limits Not assessed; home-focused.
SC

Saves ~$500-$1,000/year avg.; applies to primary residence.

Benefits
Property tax exemption (~$50,000 value, ~$500-$1,000/year savings)

Elderly Simplified Application Project (ESAP)

South Carolina ESAP (SNAP for Seniors)

Age 60+
General SC resident, no earned income, not on SCCAP.
Income Limits (2025) ~$1,732/month 133% FPL, individual
Asset Limits $4,250 individual, higher than standard SNAP
SC

Simplified process; serves ~50,000 seniors annually.

Benefits
EBT card for food (~$100-$300/month based on income)

Frequently Asked Questions about Brightwater Assisted Living

Who is the owner of Brightwater Assisted Living?

The legal owner and operator of Brightwater Assisted Living is Brightwater Retirement Llc.

What is the license number of Brightwater Assisted Living?

According to SC state health department records, Brightwater Assisted Living's license number is CRC-1489.

When does Brightwater Assisted Living's license expire?

According to SC state health department records, Brightwater Assisted Living's license expires on April 30, 2026.

What is the occupancy rate at Brightwater Assisted Living?

Brightwater Assisted Living's occupancy is 70%.

What is the best email address for Brightwater Assisted Living?

The team at Brightwater Assisted Living can be reached at [email protected].

Who is the administrator of Brightwater Assisted Living?

David Dunn is the administrator of Brightwater Assisted Living.

How many beds does Brightwater Assisted Living have?

Brightwater Assisted Living has 56 beds.

Guides for Better Senior Living

Care Cost Calculator: See Prices in Your Area

Nursing Home Data Explorer

Don’t Wait Too Long: 7 Red Flag Signs Your Parent Needs Assisted Living Now

The True Cost of Assisted Living in 2025 – And How Families Are Paying For It

Understanding Senior Living Costs: Pricing Models, Discounts & Financial Assistance