Total staff
131
Employees
104
Contractors
27
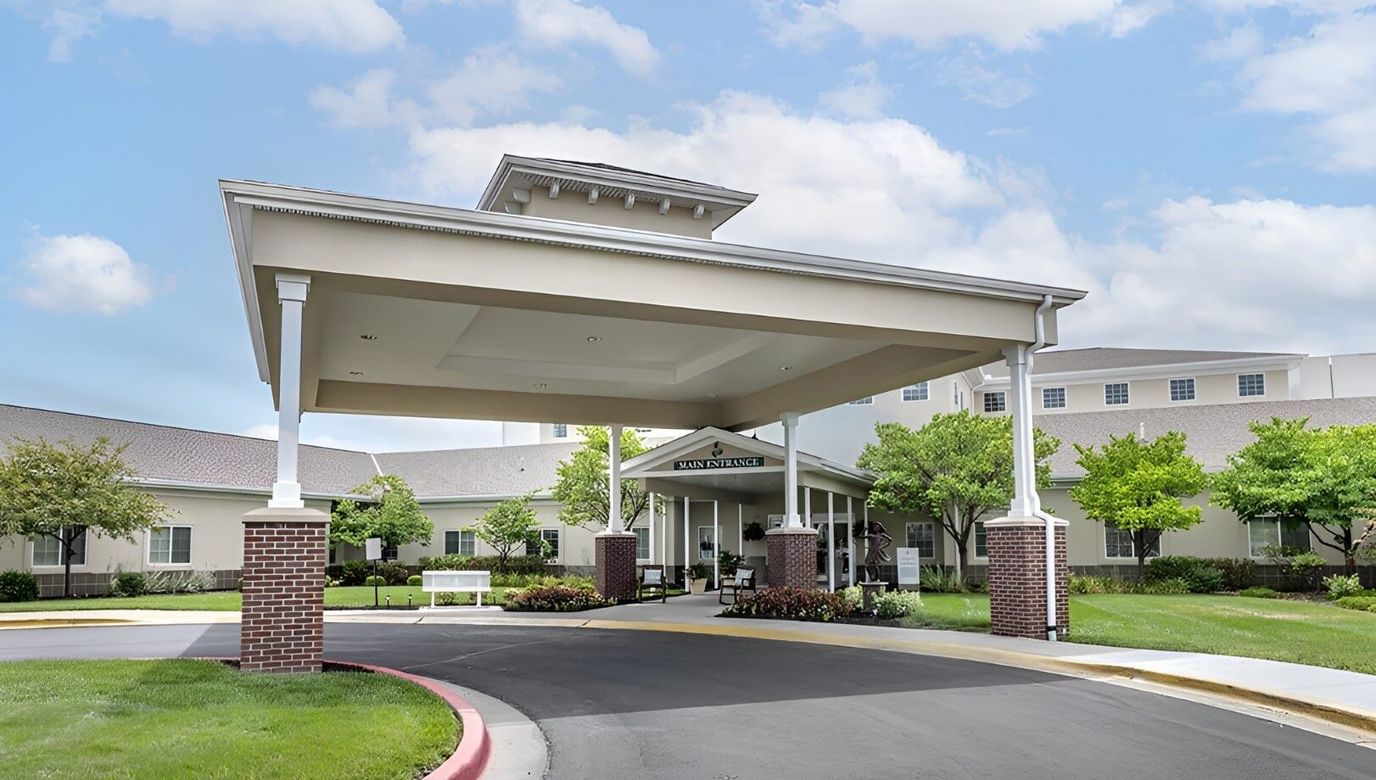
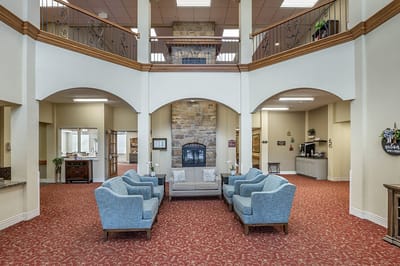
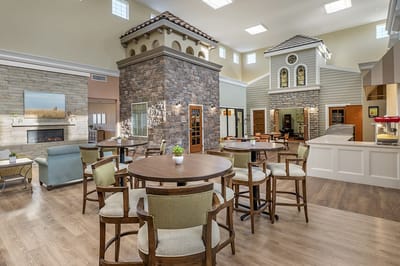
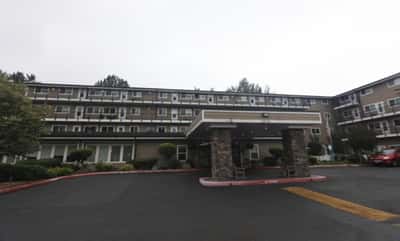
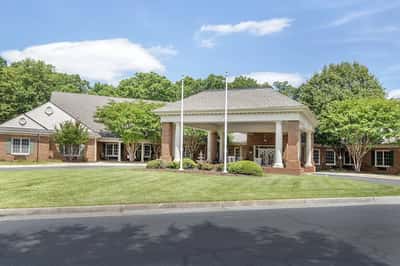
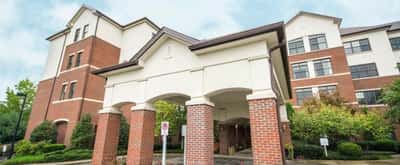
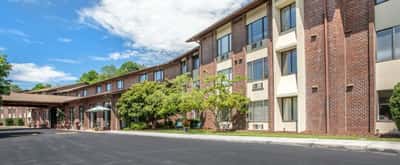
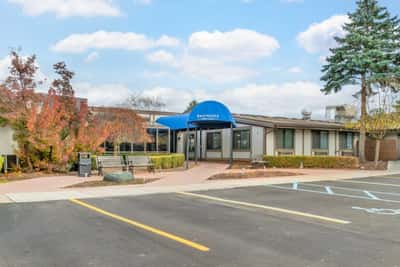
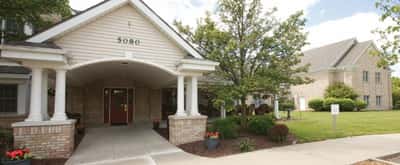
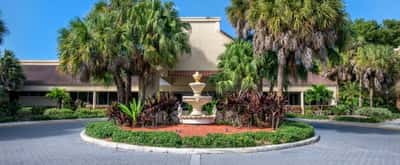
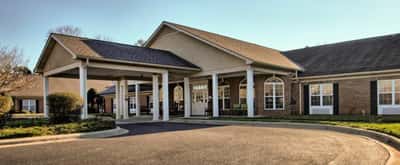
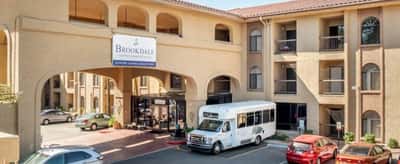
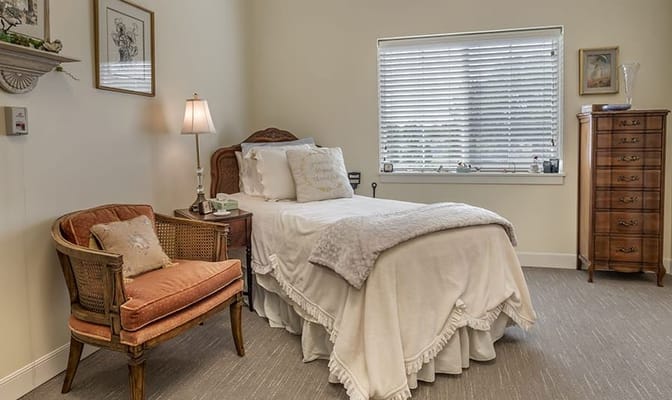
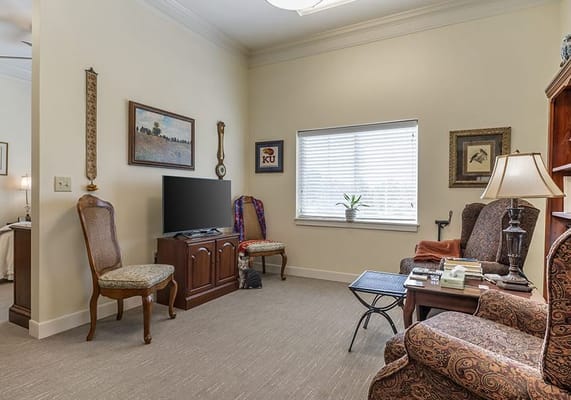
Offering short-term rehabilitation and post-acute care, Brookdale Overland Park is a nursing home on Lamar Avenue in Overland Park, Kansas, with a 94-bed capacity. Owned by Kimberly Ellis, the community features studio, one-bedroom, and suite accommodations within a two-story setting. With a current occupancy of 87.5% and an average length of stay of 26 days, it primarily serves older adults recovering from hospitalization or illness. Rates start at $6,480 per month, with Medicare and private pay accepted for flexible payment options.
Nursing care is provided daily for an average of 4 hours and 32 minutes, including 1 hour and 26 minutes by registered nurses and 2 hours and 2 minutes of direct assistance by nurse aides. Moreover, 24-hour staffing is provided, along with on-site pharmacy and clinic services to support rehabilitation, short-term stays, and ongoing medical needs. The pet-friendly environment also allows residents to bring small animal companions.
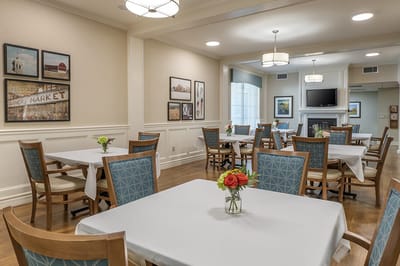
Planned social events, entertainment, tai chi, journaling workshops, and the Green Thumbs Garden Club, as well as beauty and barber services, aim to enrich daily living. A fitness center, spa, library, arts and crafts studio, billiards game room, theater, woodworking shop, café/bistro, ice cream parlor, chapel, landscaped walking paths, courtyard, and garden are among the amenities available on-site.
The surrounding neighborhood is relatively walkable, with a Walk Score of 44, providing access to some amenities within walking distance.
| Staff type | Hours / Day / Resident | vs state avg |
|---|---|---|
|
Registered Nurse (RN)
| 1h 26m per day | ▲ 99% State avg: 43m per day · National avg: 41m per day |
|
LPN / LVN
| 57m per day | ▲ 43% State avg: 40m per day · National avg: 52m per day |
|
Nurse Aide
| 2h 2m per day | ▼ 24% State avg: 2h 41m per day · National avg: 2h 20m per day |
|
Weekend Total Nursing
| 3h 44m per day | ▲ 4% State avg: 3h 35m per day · National avg: 3h 26m per day |
|
Physical Therapist
| 7m per day | ▲ 230% State avg: 2m per day · National avg: 4m per day |
|
Weekend RN
| 1h 3m per day | ▲ 110% State avg: 30m per day · National avg: 28m per day |
Reporting period: October 1 – December 31, 2025 (Q4 2025). Source: CMS Payroll-Based Journal report.
Manages medical care and health needs.
Assists with medical care and medications.
Helps with daily care and mobility.
Total hours from contractors
4,910 contractor hours this quarter
| Certified Nursing Assistant | 43 | 0 | 43 | 13,029 | 92 | 100% | 7.1 |
| Registered Nurse | 22 | 0 | 22 | 7,888 | 92 | 100% | 8.1 |
| Licensed Practical Nurse | 19 | 0 | 19 | 4,495 | 92 | 100% | 9.3 |
| RN Director of Nursing | 4 | 0 | 4 | 2,029 | 69 | 75% | 8.1 |
| Speech Language Pathologist | 0 | 7 | 7 | 1,677 | 82 | 89% | 6.4 |
| Dietitian | 3 | 0 | 3 | 1,556 | 79 | 86% | 8.3 |
| Clinical Nurse Specialist | 3 | 0 | 3 | 1,461 | 75 | 82% | 7.9 |
| Physical Therapy Aide | 0 | 3 | 3 | 1,170 | 65 | 71% | 6.4 |
| Dental Services Staff | 2 | 0 | 2 | 988 | 74 | 80% | 7.6 |
| Medication Aide/Technician | 4 | 0 | 4 | 922 | 76 | 83% | 8.5 |
| Physical Therapy Assistant | 0 | 6 | 6 | 846 | 79 | 86% | 6 |
| Respiratory Therapy Technician | 0 | 5 | 5 | 753 | 80 | 87% | 5.1 |
| Occupational Therapy Aide | 1 | 0 | 1 | 527 | 62 | 67% | 8.5 |
| Other Dietary Services Staff | 1 | 0 | 1 | 491 | 64 | 70% | 7.7 |
| Administrator | 1 | 0 | 1 | 464 | 58 | 63% | 8 |
| Nurse Practitioner | 1 | 0 | 1 | 448 | 56 | 61% | 8 |
| Qualified Social Worker | 0 | 3 | 3 | 417 | 68 | 74% | 5.6 |
| Occupational Therapy Assistant | 0 | 3 | 3 | 48 | 23 | 25% | 2.1 |
Federal penalties imposed by CMS for regulatory violations, including civil money penalties (fines) and denials of payment for new Medicare/Medicaid admissions.
Source: CMS Penalties Database (Data as of Jan 2026)
Kansas average: $44K
Kansas average: 2.4
Kansas average: 0.3
No penalties in the past 3 years
No civil money penalties or payment denials were reported in the last 3 years.
These measures show how residents usually do over time at this home, based on health outcomes and preventive care.
Kansas average: 10.5
Kansas average: 20.7
Kansas average: 19.0%
Kansas average: 23.8%
Kansas average: 4.4%
Kansas average: 4.6%
Kansas average: 3.1%
Kansas average: 5.1%
Kansas average: 5.2%
Kansas average: 16.9%
Kansas average: 91.9%
Kansas average: 95.5%
Kansas average: 75.6%
Kansas average: 2.2%
Kansas average: 73.5%
Kansas average: 23.0%
Kansas average: 11.7%
Kansas average: 0.8%
Kansas average: 53.7%
Kansas average: 50.6%
Quality measures are calculated from Minimum Data Set (MDS) assessments. For most measures, lower percentages indicate better care quality.
32% of new residents, usually for short-term rehab.
68% of new residents, often for short stays.
Source: CMS Long-Term Care Facility Characteristics (Data as of Jan 2026)
Residents meet regularly to discuss policies, care quality, and activities
Part of a Continuing Care Retirement Community offering multiple care levels
Organized group of residents that meets regularly to discuss facility policies, quality of life, and activities.
Data sourced from CMS Long-Term Care Facility Characteristics quarterly report. Payer mix reflects the current resident census by primary payment source.
Historical financial and operational data for Brookdale Overland Park from 2011–2023, based on CMS SNF Cost Reports.
Key figures below are for fiscal year ending in 12/2023.
Based on CMS SNF Cost Report for fiscal year ending in 12/2023.
Pets Allowed
Housing Options: Studio / 1 Bed / Suite
Building Type: 2-story
Fitness and Recreation
Residents typically stay for brief periods, with frequent admissions and discharges throughout the year.
Most new residents arrive under private pay (68% of admissions), and a typical private pay stay runs around 2 months.
Coverage residents most often arrive under.
Coverage residents most often leave under.
![]() 5.7 miles from city center
5.7 miles from city center
![]() Estimated distance in miles from Overland Park's city center to Brookdale Overland Park's address, calculated via Google Maps.
— 0.45 miles to nearest hospital (Menorah Medical Center)
Estimated distance in miles from Overland Park's city center to Brookdale Overland Park's address, calculated via Google Maps.
— 0.45 miles to nearest hospital (Menorah Medical Center)
Add your location
Info below is compiled from CMS reports & the KS Dept. for Aging & Disability Services (KDADS), senior community websites & trusted data sources such as Walk Score & BBB.
Communities are listed from highest to lowest based on our ranking methodology.
| Brookdale Overland Park | NH AL MC SNF | Overland Park | 94
Facility
94
KS AVG
69
Rank
#44 / 223 |
79.3%
Facility
79.3%
KS AVG
76.8
Rank
#117 / 206 | +3% | 4.53
Facility
4.53
KS AVG
4.63
Rank
#72 / 141 | +65% | -2% | $7.4k
Facility
$7.4k
KS AVG
$49.2k
Rank
#62 / 144 | 20
Facility
20
KS AVG
26.9
Rank
#53 / 144 | 6.7
Facility
6.7
KS AVG
6.1
Rank
#98 / 144 | 1 | 75 | - |
44
Facility
44
KS AVG
46
Rank
#207 / 363 | Kimberly Ellis | $22.0MFiscal year ending 12/2023
Facility
$22.0MFiscal year ending 12/2023
KS AVG
$7.3M
Rank
#15 / 143 | $10.9MFiscal year ending 12/2023
Facility
$10.9MFiscal year ending 12/2023
KS AVG
$3.3M
Rank
#12 / 143 | 49.6%Fiscal year ending 12/2023
Facility
49.6%Fiscal year ending 12/2023
KS AVG
47.9%
Rank
#33 / 143 | 175517 | ||||
| Ahc of Overland Park LLC | NH SNF | Overland Park (South Lakes) | 38
Facility
38
KS AVG
69
Rank
#203 / 223 |
100.0%
Facility
100.0%
KS AVG
76.8
Rank
#1 / 206 | +30% | 5.02
Facility
5.02
KS AVG
4.63
Rank
#44 / 141 | +13% | +8% | $13.4k
Facility
$13.4k
KS AVG
$49.2k
Rank
#77 / 144 | 22
Facility
22
KS AVG
26.9
Rank
#61 / 144 | 4.4
Facility
4.4
KS AVG
6.1
Rank
#36 / 144 | 2 | 38 | - |
92
Facility
92
KS AVG
46
Rank
#1 / 363 | Paul Hura | $6.4MFiscal year ending 12/2023
Facility
$6.4MFiscal year ending 12/2023
KS AVG
$7.3M
Rank
#55 / 143 | $4.3MFiscal year ending 12/2023
Facility
$4.3MFiscal year ending 12/2023
KS AVG
$3.3M
Rank
#59 / 143 | 66.6%Fiscal year ending 12/2023
Facility
66.6%Fiscal year ending 12/2023
KS AVG
47.9%
Rank
#113 / 143 | 175542 | ||||
| Village Shalom Inc | NH AL IL MC RC SNF | Overland Park (6850) | 66
Facility
66
KS AVG
69
Rank
#87 / 223 |
98.5%
Facility
98.5%
KS AVG
76.8
Rank
#7 / 206 | +28% | 6.86
Facility
6.86
KS AVG
4.63
Rank
#4 / 141 | -48% | +48% | $16.2k
Facility
$16.2k
KS AVG
$49.2k
Rank
#91 / 144 | 32
Facility
32
KS AVG
26.9
Rank
#99 / 144 | 8.0
Facility
8.0
KS AVG
6.1
Rank
#115 / 144 | 2 | 65 | - |
22
Facility
22
KS AVG
46
Rank
#299 / 363 | Michael Abrams | $22.7MFiscal year ending 12/2023
Facility
$22.7MFiscal year ending 12/2023
KS AVG
$7.3M
Rank
#7 / 143 | $10.7MFiscal year ending 12/2023
Facility
$10.7MFiscal year ending 12/2023
KS AVG
$3.3M
Rank
#8 / 143 | 47%Fiscal year ending 12/2023
Facility
47%Fiscal year ending 12/2023
KS AVG
47.9%
Rank
#113 / 143 | 175441 | ||||
| Stratford Commons Rehabilitation & Health Care | NH HOS RC SNF | Overland Park (Stratford Place) | 60
Facility
60
KS AVG
69
Rank
#94 / 223 |
88.3%
Facility
88.3%
KS AVG
76.8
Rank
#57 / 206 | +15% | 3.79
Facility
3.79
KS AVG
4.63
Rank
#109 / 141 | 0% | -18% | $24.8k
Facility
$24.8k
KS AVG
$49.2k
Rank
#106 / 144 | 44
Facility
44
KS AVG
26.9
Rank
#120 / 144 | 14.7
Facility
14.7
KS AVG
6.1
Rank
#143 / 144 | - | 53 | - |
47
Facility
47
KS AVG
46
Rank
#186 / 363 | Joseph Charles Tutera 2013 Family Irrevociable Trust Agreement | $7.0MFiscal year ending 12/2023
Facility
$7.0MFiscal year ending 12/2023
KS AVG
$7.3M
Rank
#54 / 143 | $3.7MFiscal year ending 12/2023
Facility
$3.7MFiscal year ending 12/2023
KS AVG
$3.3M
Rank
#51 / 143 | 53%Fiscal year ending 12/2023
Facility
53%Fiscal year ending 12/2023
KS AVG
47.9%
Rank
#87 / 143 | 175549 | ||||
| Delmar Gardens of Overland Park | NH AL IL MC SNF | Overland Park (South Lakes) | 120
Facility
120
KS AVG
69
Rank
#24 / 223 |
67.5%
Facility
67.5%
KS AVG
76.8
Rank
#160 / 206 | -12% | 3.31
Facility
3.31
KS AVG
4.63
Rank
#131 / 141 | -65% | -29% | $23.3k
Facility
$23.3k
KS AVG
$49.2k
Rank
#103 / 144 | 53
Facility
53
KS AVG
26.9
Rank
#131 / 144 | 17.7
Facility
17.7
KS AVG
6.1
Rank
#144 / 144 | 1 | 81 | - |
92
Facility
92
KS AVG
46
Rank
#1 / 363 | Tammy Conekin | $9.9MFiscal year ending 03/2024
Facility
$9.9MFiscal year ending 03/2024
KS AVG
$7.3M
Rank
#49 / 143 | $6.9MFiscal year ending 03/2024
Facility
$6.9MFiscal year ending 03/2024
KS AVG
$3.3M
Rank
#32 / 143 | 69.7%Fiscal year ending 03/2024
Facility
69.7%Fiscal year ending 03/2024
KS AVG
47.9%
Rank
#29 / 143 | 175182 |
Brookdale Overland Park is located in Overland Park, Kansas.
Here are the financial assistance programs available to residents in Kansas.
Brookdale Overland Park has a walk score of 44. Somewhat walkable. A few nearby services may be reachable on foot, but most trips require transportation.
Brookdale Overland Park's occupancy is 87.5%.
Yes — see the floorplan options available at Brookdale Overland Park on this page.
Yes, Brookdale Overland Park allows residents to bring their pets.
Brookdale Overland Park is registered as a for-profit.
Yes — there are 4 photos of Brookdale Overland Park in the photo gallery on this page.
Brookdale Overland Park is located at 12000 Lamar Ave, Overland Park, KS 66209.
Care Cost Calculator: See Prices in Your Area
Nursing Home Data Explorer
Don’t Wait Too Long: 7 Red Flag Signs Your Parent Needs Assisted Living Now
The True Cost of Assisted Living in 2025 – And How Families Are Paying For It
Understanding Senior Living Costs: Pricing Models, Discounts & Financial Assistance