


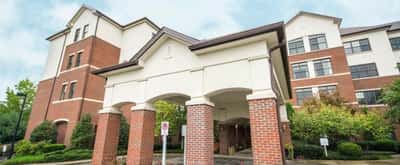


Brookdale Phillippi Creek
Nursing Home, Assisted Living & Memory Care · Sarasota, FL
Brookdale Phillippi Creek
Nursing Home, Assisted Living & Memory Care · Sarasota, FL
Brookdale Phillippi Creek accepts Medicaid and Veteran Affairs Benefits.
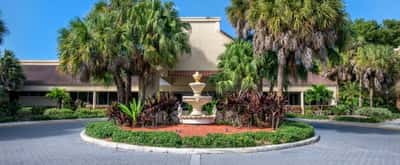
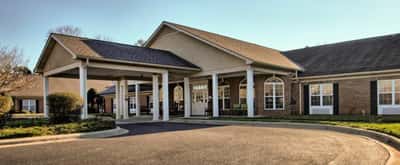
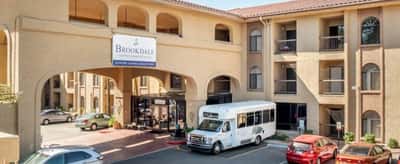
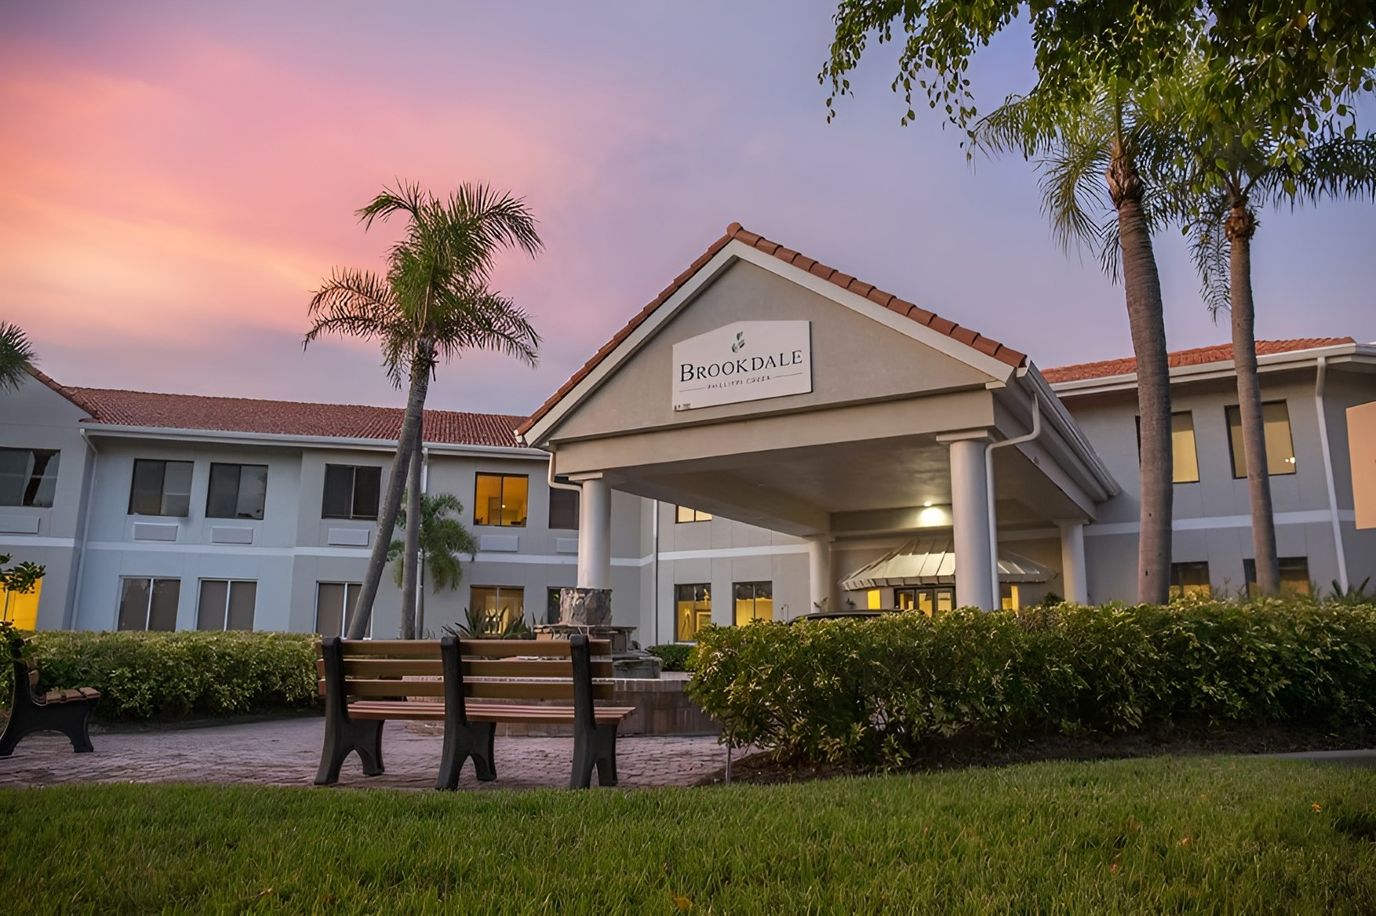
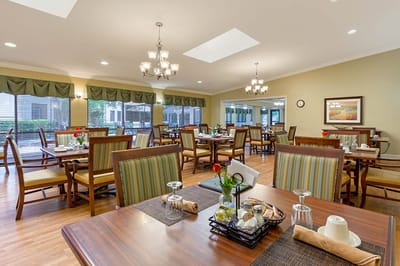
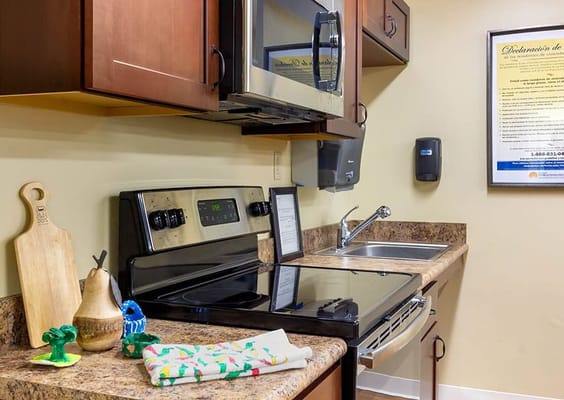
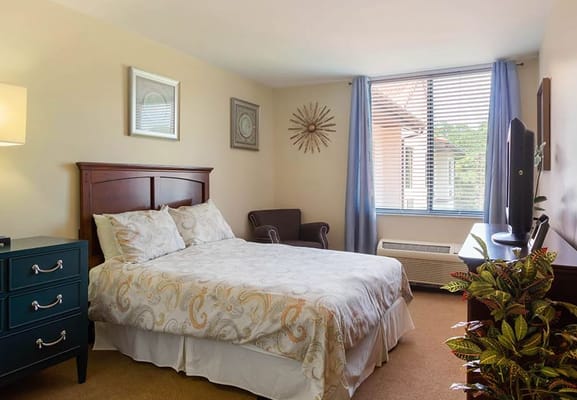
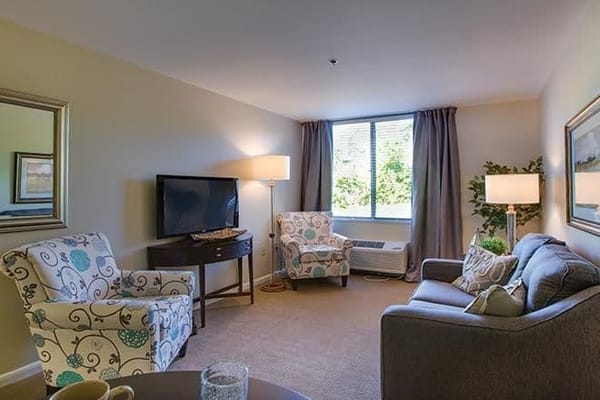
Brookdale Phillippi Creek is a leading senior living community in Gulf Gate Estates, Florida, offering various senior living solutions, including assisted living and memory care. Residents can choose from their thoughtfully designed apartments, including studio and one-bedroom apartments with a kitchenette, plenty of storage, and natural light from the windows. A dedicated team of care associates collaborates closely with seniors and their families in creating personalized care plans while still letting seniors maintain their independence.
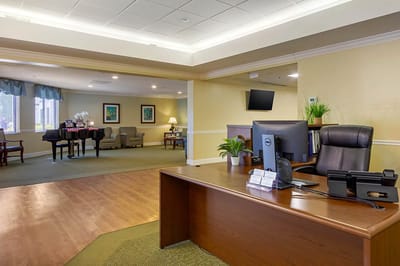
Fostering freedom and independence in a supportive environment, Brookdale Phillippi Creek features a team of compassionate caregivers who provide various assistance and a dedicated team available 24/7 to respond to emergencies. The community features various amenities for residents’ wellness and enjoyment, including nutritious meals, housekeeping, and a full social calendar filled with diverse activities. Other amenities include a well-curated library, a cafe, postal services, a therapy room, a coffee shop, a game room, and a chapel for resident’s spiritual needs.
127-bed community Rank #229 / 1058Bed count — State benchmarkedThis home is ranked 229th out of 1058 homes in Florida for bed count. Shows this facility's certified or reported bed count compared to other Florida facilities. Larger communities may offer more amenities, programs, and on-site services for residents and families.Facilities with the same value for a metric share the same rank. Rankings are based only on facilities in Florida that report data for that category. Facilities without available data are excluded from the ranking.Click the rank badge to see the full State ranking.Click here to see the full State ranking.
A larger shared setting that may offer more common spaces and organized community services.
48 years in operation
A longer operating history, which may indicate experience navigating regulations and delivering ongoing care.
Walk Score: 63 / 100 Rank #309 / 1487Walk Score — State benchmarkedThis home is ranked 309th out of 1487 homes in Florida for walk score. Shows how walkable this facility's neighborhood is compared to the average walk score across Florida facilities. Higher scores benefit residents, families, and staff.Facilities with the same value for a metric share the same rank. Rankings are based only on facilities in Florida that report data for that category. Facilities without available data are excluded from the ranking.Click the rank badge to see the full State ranking.Click here to see the full State ranking.
Moderately walkable. Some errands can be accomplished on foot, with a mix of nearby amenities.
BBB Rating: A+ (Not Accredited)
An independent rating from the Better Business Bureau based on factors such as complaint history, transparency, and business practices.
How BBB ratings work
How BBB ratings work
About this community
Facility TypeAssisted Living Facility
IssuanceMarch 1, 2025
ExpirationFebruary 28, 2027
CountySarasota
License Number7102
Brookdale Phillippi Creek is legally operated by Brea Sarasota, LLC, and administered by Robert Denninger.
Management CompanyEMERITUS CORPORATION
Profit StatusFor-profit
Private
127 units
Total beds
127 units
Wheelchair Accessible
Emergency SystemsYes
Safety FeaturesEmergency Alert System
Staffing
Key information about the people who lead and staff this community.
English
Spanish
ContactMr. Steven Swain, Executive Vice President (per BBB, record updated Jul 2026)
Respite Care
Short-Term Rehab
Licensed Nurses/CNAs
24-Hour Staffing
HousekeepingYes
Linen ServiceYes
Utilities IncludedYes
Pet Friendly
Fitness Center
Library
Café/Bistro
Coffee Shop
Beauty/Barber Shop
Courtyard And Garden
Chapel
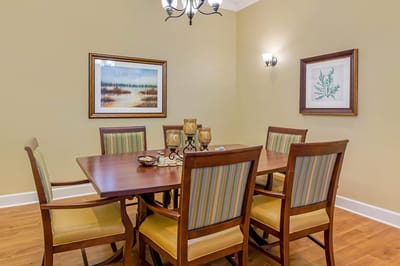
Private Dining Room
Game Room
Billiards
Community Kitchen
Meeting Rooms
Ice Cream Parlor
Activities
Touring HoursMon - Fri: 8am - 9pm CT / Sat: 9am - 5:30pm CT
Assisted Living$3,535 per month
Memory Care$4,100 per month
Food DescriptionDining includes nutritionally balanced meals and personal dining assistance as needed.
Brookdale Phillippi Creek – Menu
Download Menu PDFInspection History
In Florida, the Agency for Health Care Administration (AHCA) is the primary authority that conducts unannounced inspections and completes official health quality reports for all healthcare facilities.
Since 2021 · 5 years of data
81 citations
56 inspections
16 fines
$33.6K fined
Inspection Score
 A composite 0–100 score combining this facility's inspections, citations, complaints, and enforcement actions relative to the Florida state average. The score below shows how many points this facility sits above or below the typical Florida nursing home score (the benchmark); higher is better.This is a proprietary Assisted Living Magazine score.
21 points below the Florida average for nursing homes (83/100)
Rank #839 / 876 in Florida Inspection Score — State benchmarked This home is ranked 839th out of 876 homes in Florida for inspection score. Shows this facility's inspection score compared to the Florida average among 876 comparable communities in the ranking pool. Facilities with the same value for a metric share the same rank. Rankings are based only on facilities in Florida that report data for that category. Facilities without available data are excluded from the ranking. This is a proprietary Assisted Living Magazine score. Inspection score: 62 out of 100. Letter grade D-. 21 points below the Florida average for nursing homes (83/100)Legal Actions
Formal stipulations and orders filed by Florida regulators against this facility, including fines and total monetary penalties.
This Facility
FL Average
vs. FL Avg-
16vs 5 avg↑ 220% higher than FL avg
-
$33.6kvs $11.6k↑ 189% higher than FL avg
Data reflects the most recent 5 years (since 2021).
Inspection Scorecard
This scorecard compares key inspection, citation, and complaint metrics at this facility against the Florida state average. Metrics rated ≥15% worse than average are highlighted in red; those ≥15% better are highlighted in green.
Since 2021 vs. Florida state average
Overall vs. FL average
4 Worse
Metrics worse than Florida average:
• Total citations (145% above)
• Citations per inspection (8% above)
• Inspections with citations (181% above)
• Inspection citation rate (29% above) 0 Better No metrics in this bucket.
• Total citations (145% above)
• Citations per inspection (8% above)
• Inspections with citations (181% above)
• Inspection citation rate (29% above) 0 Better No metrics in this bucket.
Citations
| This Facility | FL Average | vs. FL Avg |
|---|---|---|---|
|
Total citations
| 81 | 33 | This facility has 145% more total citations than a typical Florida nursing home (81 vs. FL avg 33).↑ 145% worse Rank #840 / 907 Total citations — State benchmarked This home is ranked 840th out of 907 homes in Florida for total citations. Shows this facility's total citations compared to the Florida average among 907 comparable communities in the ranking pool. Facilities with the same value for a metric share the same rank. Rankings are based only on facilities in Florida that report data for that category. Facilities without available data are excluded from the ranking. |
|
Citations per inspection
| 1.4 | 1.3 | This facility has 8% more citations per inspection than a typical Florida nursing home (1.4 vs. FL avg 1.3).↑ 8% worse Rank #621 / 907 Citations per inspection — State benchmarked This home is ranked 621st out of 907 homes in Florida for citations per inspection. Shows this facility's citations per inspection compared to the Florida average among 907 comparable communities in the ranking pool. Facilities with the same value for a metric share the same rank. Rankings are based only on facilities in Florida that report data for that category. Facilities without available data are excluded from the ranking. |
Inspections
| This Facility | FL Average | vs. FL Avg |
|---|---|---|---|
|
Total inspections
| 56 | 26 | This facility has had 115% more total inspections than the Florida average (56 vs. FL avg 26). More inspections can mean more regulatory scrutiny rather than worse care.↑ 115% more |
|
Inspections with citations
| 45 | 16 | This facility has 181% more inspections with citations than a typical Florida nursing home (45 vs. FL avg 16).↑ 181% worse |
|
Inspection citation rate
| 80% | 62% | This facility has 18 percentage points higher inspection citation rate than a typical Florida nursing home (80% vs. FL avg 62%).↑ 18% worse Rank #822 / 907 Inspection citation rate — State benchmarked This home is ranked 822nd out of 907 homes in Florida for % of inspections with citations. Shows this facility's % of inspections with citations compared to the Florida average among 907 comparable communities in the ranking pool. Facilities with the same value for a metric share the same rank. Rankings are based only on facilities in Florida that report data for that category. Facilities without available data are excluded from the ranking. |
Inspection Reports Summary
An editor-reviewed summary of the themes and findings across this facility's recent inspection reports.
- August 7 and June 5, 2025 inspections each found 2 deficiencies related to resident care elopement standards and electronic reporting requirements.
- January 25, 2024 inspection cited 7 Class 3 deficiencies across resident care, medication, staffing, training, food service, and background screening.
- October 2, 2025 inspection found no deficiencies and no complaints were substantiated in the record.
What does this home offer?
Pets Allowed
Housing Options: Studio / 1 Bed
Building Type: 2-story
Fitness and Recreation

1 / 4
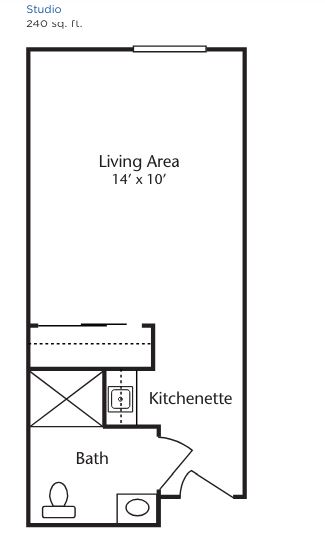
Studio
1
240 sq. ft
1 / 4
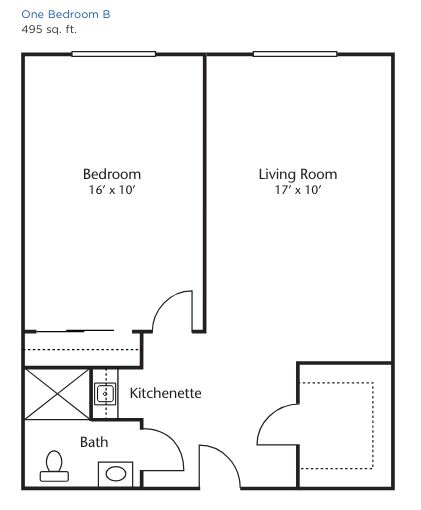
1 Bed
1
495 sq. ft
Activities in this home
- Arts and Crafts
- Cooking Classes
- Dancing
- Exercise Classes
- Games & Cards
- Gardening
- Music Programs
- Shopping
- Social Events & Outings
- Theater & Movies
Places of interest near Brookdale Phillippi Creek
![]() 5.3 miles from city center
5.3 miles from city center
![]() Estimated distance in miles from Sarasota's city center to Brookdale Phillippi Creek's address, calculated via Google Maps.
Estimated distance in miles from Sarasota's city center to Brookdale Phillippi Creek's address, calculated via Google Maps.
Calculate Travel Distance to Brookdale Phillippi Creek
Add your location
Compare Nursing Homes around the area
Info below is compiled from CMS reports & the FL Agency for Health Care Administration (AHCA), senior community websites & trusted data sources such as Walk Score & BBB.
Communities are listed from highest to lowest based on our ranking methodology.
| Oak Hammock at the University of Florida | NH AL MC SNF | Gainesville | 80
Facility
80
FL AVG
88
Rank
#570 / 1058 | - | - | 5.85
Facility
5.85
FL AVG
4.04
Rank
#12 / 181 | -31% | +45% | $0
Facility
$0
FL AVG
$78.9k
Rank
#1 / 185 | 92
Facility
92
FL AVG
83
Rank
#237 / 876 | 13
Facility
13
FL AVG
19.7
Rank
#56 / 181 | 4.3
Facility
4.3
FL AVG
4.5
Rank
#92 / 181 | - | 71 | - |
6
Facility
6
FL AVG
40
Rank
#1344 / 1487 | Donna Brown | $13.2MFiscal year ending 12/2023
Facility
$13.2MFiscal year ending 12/2023
FL AVG
$15.7M
Rank
#19 / 184 | $17.1MFiscal year ending 12/2023
Facility
$17.1MFiscal year ending 12/2023
FL AVG
$6.1M
Rank
#11 / 184 | 129.6%Fiscal year ending 12/2023
Facility
129.6%Fiscal year ending 12/2023
FL AVG
39.8%
Rank
#90 / 184 | 106066 | ||||
| Vi at Lakeside Village | NH AL IL MC RC SNF | Lantana | 60
Facility
60
FL AVG
88
Rank
#681 / 1058 |
78.3%
Facility
78.3%
FL AVG
84.4
Rank
#103 / 125 | -7% | 4.79
Facility
4.79
FL AVG
4.04
Rank
#31 / 181 | -9% | +19% | $0
Facility
$0
FL AVG
$78.9k
Rank
#1 / 185 | 90
Facility
90
FL AVG
83
Rank
#314 / 876 | 7
Facility
7
FL AVG
19.7
Rank
#20 / 181 | 2.3
Facility
2.3
FL AVG
4.5
Rank
#23 / 181 | - | 47 | - |
12
Facility
12
FL AVG
40
Rank
#1225 / 1487 | Cc Lantana Inc | $10.1MFiscal year ending 12/2023
Facility
$10.1MFiscal year ending 12/2023
FL AVG
$15.7M
Rank
#45 / 184 | $8.1MFiscal year ending 12/2023
Facility
$8.1MFiscal year ending 12/2023
FL AVG
$6.1M
Rank
#82 / 184 | 80.1%Fiscal year ending 12/2023
Facility
80.1%Fiscal year ending 12/2023
FL AVG
39.8%
Rank
#167 / 184 | 105968 | ||||
| Vi at Aventura | NH AL IL MC SNF | Aventura | 26
Facility
26
FL AVG
88
Rank
#855 / 1058 | - | - | 4.72
Facility
4.72
FL AVG
4.04
Rank
#40 / 181 | 0% | +17% | $0
Facility
$0
FL AVG
$78.9k
Rank
#1 / 185 | 92
Facility
92
FL AVG
83
Rank
#237 / 876 | 7
Facility
7
FL AVG
19.7
Rank
#20 / 181 | 3.5
Facility
3.5
FL AVG
4.5
Rank
#59 / 181 | - | 36 | - |
69
Facility
69
FL AVG
40
Rank
#223 / 1487 | Pamela Allison | $6.6MFiscal year ending 12/2023
Facility
$6.6MFiscal year ending 12/2023
FL AVG
$15.7M
Rank
#47 / 184 | $5.7MFiscal year ending 12/2023
Facility
$5.7MFiscal year ending 12/2023
FL AVG
$6.1M
Rank
#140 / 184 | 85.8%Fiscal year ending 12/2023
Facility
85.8%Fiscal year ending 12/2023
FL AVG
39.8%
Rank
#179 / 184 | 106076 | ||||
| Terracina Grand | NH AL IL MC RC SNF | Naples | 200
Facility
200
FL AVG
88
Rank
#38 / 1058 | - | - | 4.20
Facility
4.20
FL AVG
4.04
Rank
#60 / 181 | +66% | +4% | $10.9k
Facility
$10.9k
FL AVG
$78.9k
Rank
#128 / 185 | 76
Facility
76
FL AVG
83
Rank
#641 / 876 | 4
Facility
4
FL AVG
19.7
Rank
#9 / 181 | 2.0
Facility
2.0
FL AVG
4.5
Rank
#13 / 181 | - | 26 | A+ |
12
Facility
12
FL AVG
40
Rank
#1225 / 1487 | 2012 Goodman Family Gst | $5.5MFiscal year ending 12/2023
Facility
$5.5MFiscal year ending 12/2023
FL AVG
$15.7M
Rank
#182 / 184 | $2.6MFiscal year ending 12/2023
Facility
$2.6MFiscal year ending 12/2023
FL AVG
$6.1M
Rank
#174 / 184 | 46.1%Fiscal year ending 12/2023
Facility
46.1%Fiscal year ending 12/2023
FL AVG
39.8%
Rank
#21 / 184 | 106129 |
More homes from the same operator
Operated by
Brookdale
Frequently Asked Questions about Brookdale Phillippi Creek
What neighborhood is Brookdale Phillippi Creek in?
Brookdale Phillippi Creek is in the Gulf Gate Estates neighborhood of Sarasota.
What languages are spoken at Brookdale Phillippi Creek?
The team at Brookdale Phillippi Creek speaks English and Spanish.
Who is the owner of Brookdale Phillippi Creek?
Brookdale Phillippi Creek is legally operated by Brea Sarasota, LLC, and administered by Robert Denninger.
Is Brookdale Phillippi Creek in a walkable area?
Brookdale Phillippi Creek has a walk score of 63. Moderately walkable. Some errands can be accomplished on foot, with a mix of nearby amenities.
What is the license number of Brookdale Phillippi Creek?
According to FL state health department records, Brookdale Phillippi Creek's license number is 7102.
When does Brookdale Phillippi Creek's license expire?
According to FL state health department records, Brookdale Phillippi Creek's license expires on February 28, 2027.
How long has Brookdale Phillippi Creek been in business?
Brookdale Phillippi Creek has been operating for approximately 48 years, based on available licensing and registration records.
Guides for Better Senior Living
Care Cost Calculator: See Prices in Your Area
Nursing Home Data Explorer
Don’t Wait Too Long: 7 Red Flag Signs Your Parent Needs Assisted Living Now
The True Cost of Assisted Living in 2025 – And How Families Are Paying For It
Understanding Senior Living Costs: Pricing Models, Discounts & Financial Assistance
Updated on
