


Brooklyn Queens Nursing Home
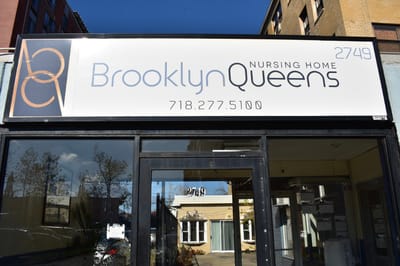
Brooklyn Queens Nursing Home
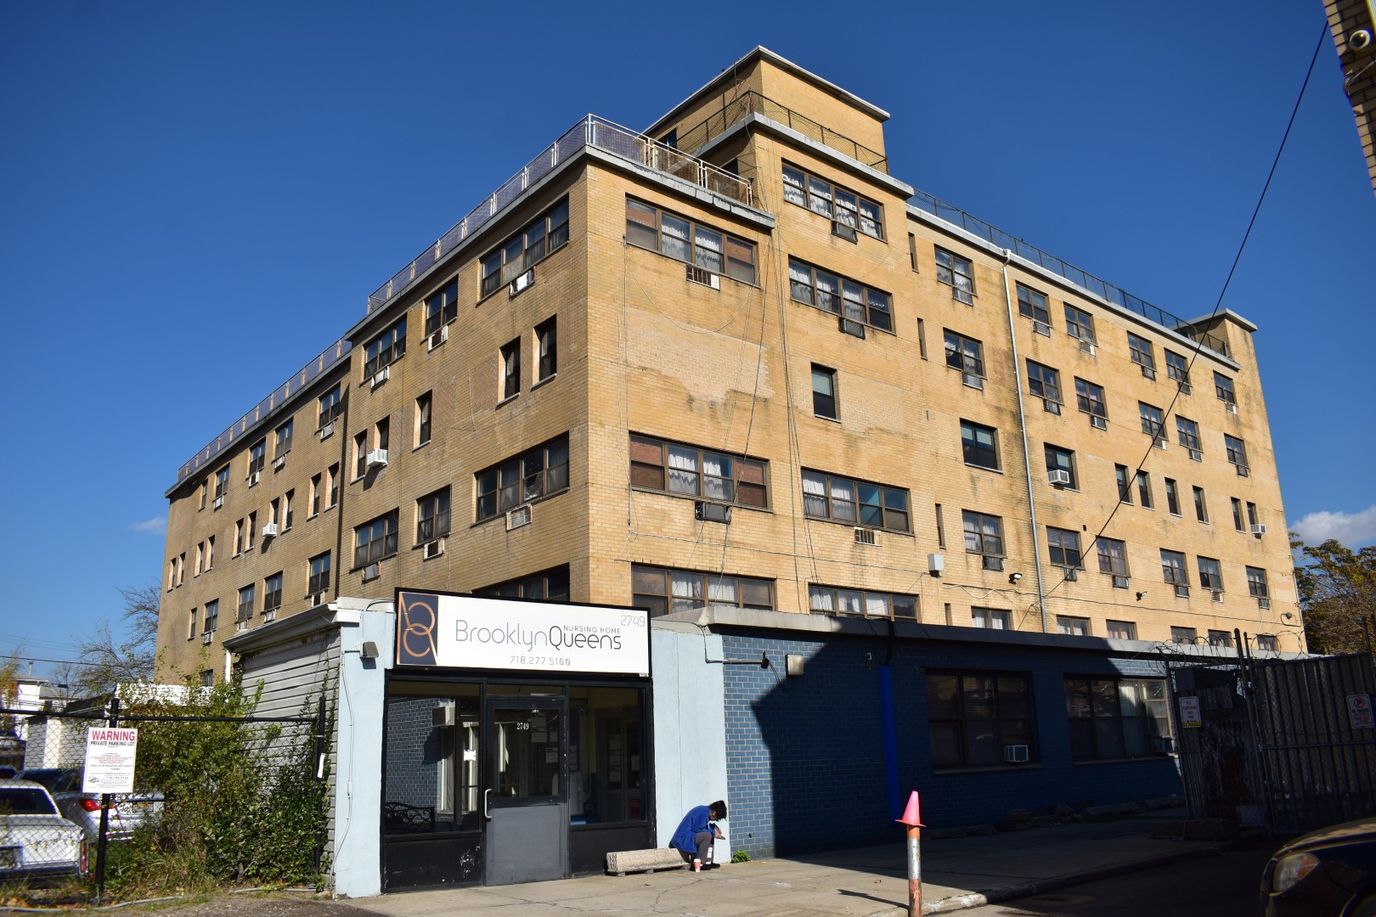
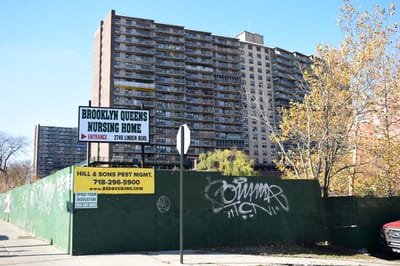
Brooklyn-queens Nursing Home operates a 140-bed skilled nursing facility at 2749 Linden Blvd, Brooklyn, Kings County, New York. Established in 1980, the facility is owned by Selma Thomas. The community maintains 100% occupancy (all 140 beds occupied).
Nursing support runs 4 hours 14 minutes per resident daily, representing a 21% improvement over New York state averages and ranking 60th among 388 statewide facilities. On-site physical therapy, occupational therapy, and speech-language pathology services are complemented by social work coordination for discharge planning. An active resident council participates in care discussions.
Private bathrooms, daily exercise programming, arts and crafts, religious services, community outings, and inclusive meals with specialized dietary preparation constitute the main lifestyle amenities.
A troubling pattern emerges from recent inspection data. Multiple complaint-driven investigations between 2022 and 2024 documented recurring deficiencies in resident assessments, care plan accuracy and timeliness, notification of status changes, and reporting of alleged resident violations.
April 2023 brought a Level 4 immediate jeopardy citation for failure to investigate and report alleged violations appropriately; this critical finding was corrected by June 2023. May 2022 documented a substantiated abuse and neglect allegation, also corrected. The most recent inspection on September 10, 2024, identified ten deficiencies (five health-related, five life safety violations). All were corrected by November 2024.
Deficiency rates in the past three years averaged 9 annually, representing 76% above the state average. Building safety citations addressed sprinkler system installation and vertical opening enclosure requirements. Food safety and sanitation violations were identified and remedied. COVID-19 national health safety network reporting failures documented in 2022 persisted in early reports.
Long-stay residents experienced lower rates of falls with major injury (2.2%, 26% better than state average) and depressive symptoms (8.7%, 52% better). Short-stay rehabilitation residents showed weaker outcomes: only 24.4% successfully returned to community or home (52% worse than state average), and 25.9% required re-hospitalization within 30 days of discharge (26% worse). Pneumococcal vaccination completion stood at 24.3% for long-stay residents and 16.1% for short-stay, both significantly below state vaccination standards.
Walk Score of 89 indicates a highly walkable neighborhood.
Brooklyn-Queens is structured for older adults with ongoing skilled nursing needs and complex medical requirements in a long-term care setting.
What does this home offer?
Building Type: Mid-rise
Rehabilitative Support

On-site Medical Care and Health Services
Places of interest near Brooklyn Queens Nursing Home
![]() 4.8 miles from city center
4.8 miles from city center
![]() Estimated distance in miles from Brooklyn's city center to Brooklyn Queens Nursing Home's address, calculated via Google Maps.
Estimated distance in miles from Brooklyn's city center to Brooklyn Queens Nursing Home's address, calculated via Google Maps.
Calculate Travel Distance to Brooklyn Queens Nursing Home
Add your location
Compare Nursing Home around Brooklyn
The information below is reported by the New York State Department of Health.
| Hopkins Center For Rehabilitation And Healthcare | NH NC | Brooklyn (Boerum Hill) | 288
Facility
288
NY AVG
160
Rank
#75 / 748 |
99.0%
Facility
99.0%
NY AVG
88.3%
Rank
#1 / 436 | +12% | 2.88
Facility
2.88
NY AVG
3.58
Rank
#296 / 407 | -16% | -20% | $0
Facility
$0
NY AVG
$67.6k
Rank
#1 / 415 | 85
Facility
85
NY AVG
83
Rank
#254 / 593 | 14
Facility
14
NY AVG
18.5
Rank
#153 / 414 | 4.7
Facility
4.7
NY AVG
5.1
Rank
#199 / 414 | - | 283 | - |
97
Facility
97
NY AVG
63
Rank
#81 / 1173 | Hopkins Ventures LLC | $52.1M
Facility
$52.1M
NY AVG
$32.0M
Rank
#82 / 403 | $20.6M
Facility
$20.6M
NY AVG
$10.7M
Rank
#66 / 403 | 39.5%
Facility
39.5%
NY AVG
37%
Rank
#114 / 403 | 335847 | ||||
| Ditmas Park Nursing & Rehab | NH | Brooklyn (Flatbush) | 240
Facility
240
NY AVG
160
Rank
#113 / 748 |
95.0%
Facility
95.0%
NY AVG
88.3%
Rank
#412 / 436 | +8% | - | +50% | - | $0
Facility
$0
NY AVG
$67.6k
Rank
#1 / 415 | 85
Facility
85
NY AVG
83
Rank
#254 / 593 | 7
Facility
7
NY AVG
18.5
Rank
#31 / 414 | 2.3
Facility
2.3
NY AVG
5.1
Rank
#31 / 414 | - | 194 | A- |
93
Facility
93
NY AVG
63
Rank
#192 / 1173 | Bmo Family Holdings LLC | $62.0M
Facility
$62.0M
NY AVG
$32.0M
Rank
#44 / 403 | $9.0M
Facility
$9.0M
NY AVG
$10.7M
Rank
#67 / 403 | 14.4%
Facility
14.4%
NY AVG
37%
Rank
#331 / 403 | 335648 | ||||
| The Phoenix Rehabilitation And Nursing Center | NH RC | Brooklyn (Fort Greene) | 400
Facility
400
NY AVG
160
Rank
#25 / 748 |
98.0%
Facility
98.0%
NY AVG
88.3%
Rank
#41 / 436 | +11% | 2.59
Facility
2.59
NY AVG
3.58
Rank
#379 / 407 | +2% | -28% | $0
Facility
$0
NY AVG
$67.6k
Rank
#1 / 415 | - | 8
Facility
8
NY AVG
18.5
Rank
#42 / 414 | 2.7
Facility
2.7
NY AVG
5.1
Rank
#44 / 414 | - | 392 | - |
96
Facility
96
NY AVG
63
Rank
#108 / 1173 | - | $62.6M
Facility
$62.6M
NY AVG
$32.0M
Rank
#39 / 403 | $22.5M
Facility
$22.5M
NY AVG
$10.7M
Rank
#51 / 403 | 35.9%
Facility
35.9%
NY AVG
37%
Rank
#279 / 403 | 335516 | ||||
| Palm Gardens Center For Nursing And Rehabilitation | NH HC NC | Brooklyn (Kensington) | 240
Facility
240
NY AVG
160
Rank
#113 / 748 |
94.2%
Facility
94.2%
NY AVG
88.3%
Rank
#150 / 436 | +7% | 2.67
Facility
2.67
NY AVG
3.58
Rank
#351 / 407 | +8% | -25% | $0
Facility
$0
NY AVG
$67.6k
Rank
#1 / 415 | 83
Facility
83
NY AVG
83
Rank
#303 / 593 | 10
Facility
10
NY AVG
18.5
Rank
#76 / 414 | 3.3
Facility
3.3
NY AVG
5.1
Rank
#86 / 414 | - | 224 | A+ |
80
Facility
80
NY AVG
63
Rank
#457 / 1173 | Palm Gardens Care Center, LLC (For Profit) | $51.0M
Facility
$51.0M
NY AVG
$32.0M
Rank
#66 / 403 | $26.6M
Facility
$26.6M
NY AVG
$10.7M
Rank
#41 / 403 | 52.2%
Facility
52.2%
NY AVG
37%
Rank
#53 / 403 | 335328 |
Financial Assistance for
Nursing Home in New York
Brooklyn Queens Nursing Home is located in Brooklyn, New York.
Here are the financial assistance programs available to residents in New York.
Frequently Asked Questions about Brooklyn Queens Nursing Home
Are there photos of Brooklyn Queens Nursing Home?
Yes — there are 3 photos of Brooklyn Queens Nursing Home in the photo gallery on this page.
What is the address of Brooklyn Queens Nursing Home?
Brooklyn Queens Nursing Home is located at 2749 Linden Blvd, Brooklyn, NY 11208.
What is the phone number of Brooklyn Queens Nursing Home?
(718) 277-5100 will put you in contact with the team at Brooklyn Queens Nursing Home.
Is Brooklyn Queens Nursing Home Medicare or Medicaid certified?
Brooklyn Queens Nursing Home is not currently listed as a CMS-certified provider of Medicare or Medicaid.
Guides for Better Senior Living
Care Cost Calculator: See Prices in Your Area
Nursing Home Data Explorer
Don’t Wait Too Long: 7 Red Flag Signs Your Parent Needs Assisted Living Now
The True Cost of Assisted Living in 2025 – And How Families Are Paying For It
Understanding Senior Living Costs: Pricing Models, Discounts & Financial Assistance
Updated on
