Buckingham‘s Choice
Nursing Home, Assisted Living, Independent Living, Memory Care & Hospice Care · Frederick, MD
CMS overall rating Info The Overall CMS Rating is scored from 1 to 5 stars and combines results from health inspections, staffing levels, and quality measures. Health inspections carry the most weight. Staffing and quality scores can increase or decrease the final rating based on performance compared to state and national standards.

Buckingham‘s Choice

Nursing Home, Assisted Living, Independent Living, Memory Care & Hospice Care · Frederick, MD
CMS overall rating Info The Overall CMS Rating is scored from 1 to 5 stars and combines results from health inspections, staffing levels, and quality measures. Health inspections carry the most weight. Staffing and quality scores can increase or decrease the final rating based on performance compared to state and national standards.
Calculator: See prices in your area
Buckingham‘s Choice accepts Medicare and private pay.

Overview of Buckingham‘s Choice

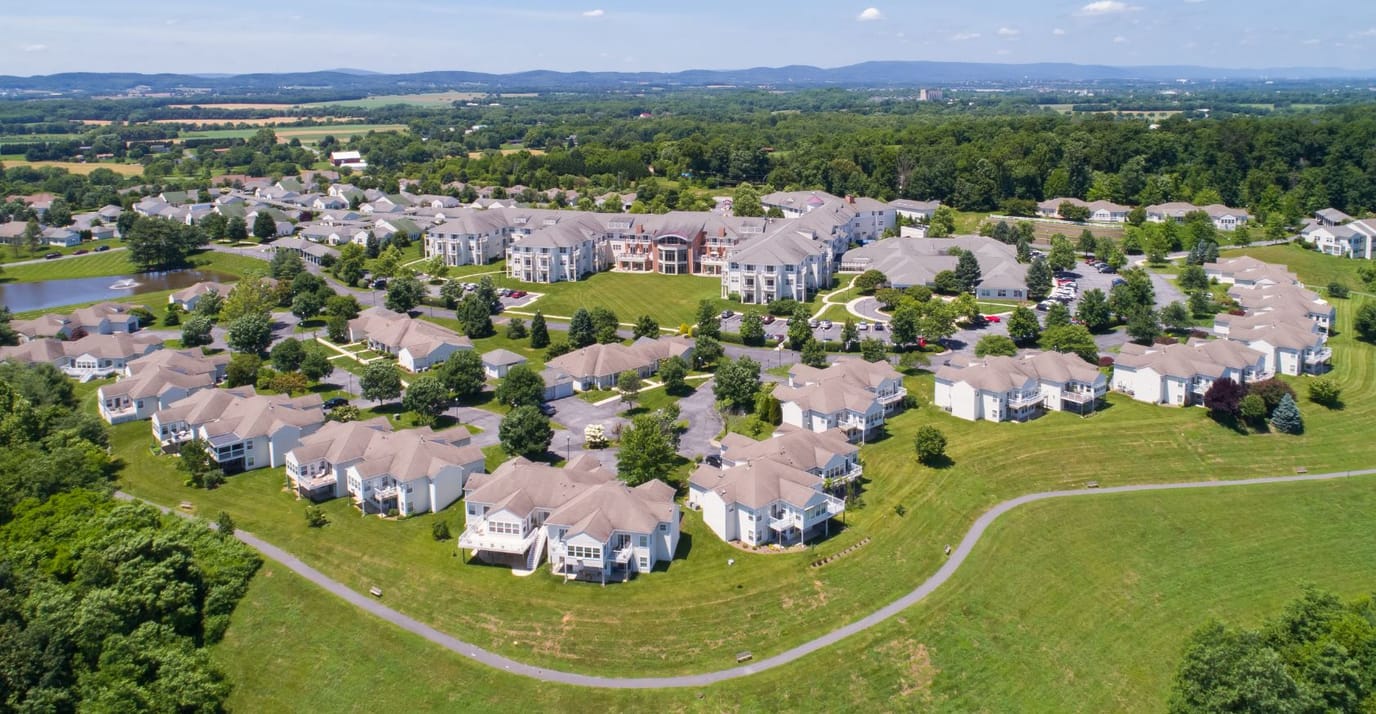
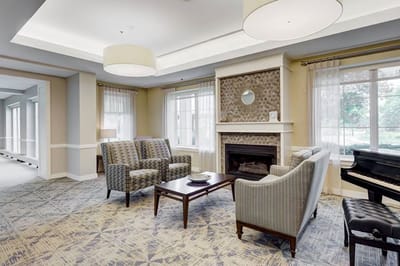
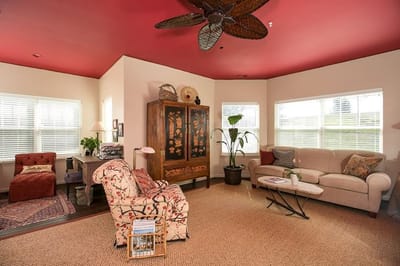
Buckingham’s Choice provides exceptional service for seniors of independent living, assisted, and memory care living. The nurturing environment empowers and enhances the quality of life for residents by tailored care to each unique individual. Personalized care caters to each individual’s needs while maintaining independence and individuality. Buckingham’s Choice offers a vibrant lifestyle for a graceful senior living experience.

They pride themselves on their unmatched level of care thanks to their remarkable staff who offer compassionate service. Community features include 24-hour care, delicious meals served three times daily, social activities, engaging events, housekeeping and laundry services, and optimum security provided.

(301) 874-5630

Quality ratings

Measured by Centers for Medicare & Medicaid Services (CMS)

Overall rating Info The Overall CMS Rating combines results from health inspections, staffing levels and quality measures. Health inspections carry the most weight. Staffing and quality scores can increase or decrease the final rating based on performance compared to state and national standards.
▲ 46.6% Above MD avg. ▲ 46.6% Above MD avg.Click the badge to see the full State ranking.Click here to see the full State ranking.
Health Inspection Info Based on the results of the facility's three most recent standard inspections and any complaint investigations. CMS reviews the number, scope, and severity of deficiencies, with more recent findings weighted more heavily.
▲ 25.0% Above MD avg. ▲ 25.0% Above MD avg.Click the badge to see the full State ranking.Click here to see the full State ranking.
Staffing Info Measures average nursing staff hours per resident per day, including Registered Nurses (RNs) and total nursing staff. Ratings are adjusted based on the level of care residents require and are compared to state and national benchmarks.
▲ 41.2% Above MD avg. ▲ 41.2% Above MD avg.Click the badge to see the full State ranking.Click here to see the full State ranking.
Quality Measures Info Based on clinical and physical health indicators reported to CMS, such as hospital readmissions, falls, pressure ulcers, and improvements in mobility. These measures reflect how well residents' health needs are being managed.
▲ 7.2% Above MD avg. ▲ 7.2% Above MD avg.Click the badge to see the full State ranking.Click here to see the full State ranking.

Staffing hours breakdown

Info Daily nursing hours per resident by staff type, reported to CMS. Higher is generally better — compare this facility to state and national averages to see where staffing stands.

Hours per resident per day — compared to Maryland state averages

Total nursing care / resident Info This home is ranked 18th out of 144 homes in Maryland. Total adjusted nursing hours per resident per day, combining RN, LPN, and aide time. CMS adjusts this for case-mix so facilities can be fairly compared.
4h 44m per day
Rank #18 / 144Nurse hours — State benchmarkedThis home is ranked 18th out of 144 homes in Maryland. Shows adjusted nurse hours per resident per day benchmarked to the Maryland average, with a ranking across 144 Maryland SNFs. More hours mean more direct care. The national average is about 3.5 hrs; below 3.0 is a red flag.Click the rank badge to see the full State ranking.Click here to see the full State ranking.
This facility Maryland avg (4h 17m per day)
vs Maryland avg
+10%
Staff typeHours / Day / Residentvs state avg
Weekend Total Nursing Info Combined nursing hours (RN + LPN + Nurse Aide) per resident per day on weekends. Staffing often drops on weekends — this figure reveals whether the facility maintains adequate coverage outside of weekday hours. 3h 59m per day

Types of Care at Buckingham‘s Choice

Assisted Living Independent Living Memory Care Nursing Home Hospice Care

Capacity and availability

This home usually has availability

Occupancy lower than 85% suggests more openings may be available.

Lower occupancy than the Maryland average: 82.4%
Occupancy rate 56.8% Rank #136 / 146Occupancy rate — State benchmarkedThis home is ranked 136th out of 146 homes in Maryland. Shows this facility's occupancy rate versus the Maryland average, with its Statewide rank out of 146. Higher occupancy signals strong local demand and financial stability.Click the rank badge to see the full State ranking.Click here to see the full State ranking.
Avg. Length of Stay 85 days
Occupancy rate
56.8% Rank #136 / 146Occupancy rate — State benchmarkedThis home is ranked 136th out of 146 homes in Maryland. Shows this facility's occupancy rate versus the Maryland average, with its Statewide rank out of 146. Higher occupancy signals strong local demand and financial stability.Click the rank badge to see the full State ranking.Click here to see the full State ranking.
Avg. Length of Stay
85 days
Years in operation
31 years in operation Rank #30 / 209Years in operation — State benchmarkedThis home is ranked 30th out of 209 homes in Maryland. Shows how long this facility has been in operation compared to other Maryland SNFs. Longer operating histories may benefit residents, families, and staff.Click the rank badge to see the full State ranking.Click here to see the full State ranking.
A longer operating history, which may indicate experience navigating regulations and delivering ongoing care.
Walk Score
Walk Score: 3 / 100 Rank #931 / 986Walk Score — State benchmarkedThis home is ranked 931st out of 986 homes in Maryland. Shows how walkable this facility's neighborhood is compared to the average Walk Score across Maryland SNFs. Higher scores benefit residents, families, and staff.Click the rank badge to see the full State ranking.Click here to see the full State ranking.
Car-dependent. Most errands require a car, with limited nearby walkable options.
BBB Rating
BBB Rating: A+ (Not Accredited)
An independent rating from the Better Business Bureau based on factors such as complaint history, transparency, and business practices.
How BBB ratings work

About this community

License Details

CMS Certification Number215329

Staffing

Key information about the people who lead and staff this community.

Leadership

ContactMrs. Jaclyn Harris, President/CEO

Payment & Insurance

1 service
Accept Medicare

Therapy & Rehabilitation

3 services
Rehabilitation Services
Respite Care
Short-Term Rehab

Staffing & Medical

1 service
24-Hour Staffing

Additional Services

1 service
Rehabilitation Therapy

Amenities & Lifestyle

Fitness Center
Gourmet Dining
Social Spaces
Nature Trails
Outdoor Areas
Operating Hours24/7

Contact Buckingham‘s Choice

Health Inspection History

Inspections since 2018
Total health inspections 3

Maryland average 3.9


Last Health inspection on Nov 2024

Total health citations
29 Rank #30 / 146Health citations — State benchmarkedThis home is ranked 30th out of 146 homes in Maryland. Shows this facility's total health deficiency citations benchmarked to the Maryland State average, with a ranking across all 146 MD SNFs. Lower citation counts earn a better rank.Click the rank badge to see the full State ranking.Click here to see the full State ranking.

Maryland average 49.9

Citations per inspection
9.67 Rank #55 / 146Citations per inspection — State benchmarkedThis home is ranked 55th out of 146 homes in Maryland. Shows average deficiency citations per CMS inspection for this facility versus the Maryland mean across 146 SNFs with citation data. Lower is better.Click the rank badge to see the full State ranking.Click here to see the full State ranking.

Maryland average 12.81


Health citations are formal notices following inspections when they fail to comply with safety and care standards.

28 of 29 citations resulted from standard inspections; and 1 of 29 resulted from complaint investigations.

Breakdown of citation severity (last 8 years)
Critical Health citations
0
100% better than Maryland average

Maryland average: 0.5


Serious Health citations
0
100% better than Maryland average

Maryland average: 0.6

0 critical citations Maryland average: 0.5

0 serious citations Maryland average: 0.6

25 moderate citations Maryland average: 47.2

4 minor citations Maryland average: 1.7
Citations history (last 8 years)
Nutrition moderate citation Nov 22, 2024
Corrected

Nutrition moderate citation Nov 22, 2024
Corrected

Quality of Care moderate citation Nov 22, 2024
Corrected

Care Planning moderate citation Nov 22, 2024
Corrected

Staffing Data

Reporting period: October 1 – December 31, 2025 (Q4 2025). Source: CMS Payroll-Based Journal report.

Total staff 62
Employees 60
Contractors 2
Staff to resident ratio 2.21:1
22% better than Maryland average
Maryland average ratio: 1.81:1 Maryland average ratio: 1.81:1See full Maryland ranking
Avg staff/day 20
Average shift 7.1 hours
11% worse than Maryland average
Maryland average: 8 hours Maryland average shift: 8 hoursSee full Maryland ranking
Total staff hours (quarter) 13,105

Nursing staff breakdown

Q4 2025 · Oct 1 – Dec 31 More info This data comes from the CMS Payroll-Based Journal report covering October 1 – December 31, 2025.
Registered Nurse

Manages medical care and health needs.

RN Staff 14
Average shift length Info Average shift length. Calculated as total hours divided by days worked and average staff per day. 8.4 hours

No contractors work on this role.

Licensed Practical Nurse

Assists with medical care and medications.

LPN Staff 4
Average shift length Info Average shift length. Calculated as total hours divided by days worked and average staff per day. 11.2 hours

No contractors work on this role.

Certified Nursing Assistant

Helps with daily care and mobility.

CNA Staff 20
Average shift length Info Average shift length. Calculated as total hours divided by days worked and average staff per day. 7 hours

No contractors work on this role.

Contractor staffing

Q4 2025 · Oct 1 – Dec 31 More info This data comes from the CMS Payroll-Based Journal report covering October 1 – December 31, 2025.

Total hours from contractors

1.2%

158 contractor hours this quarter

Occupational Therapy Assistant: 1 Occupational Therapy Aide: 1

Staff by category

Q4 2025 · Oct 1 – Dec 31 More info This data comes from the CMS Payroll-Based Journal report covering October 1 – December 31, 2025.
Certified Nursing Assistant200204,97792100%7
Registered Nurse140142,50592100%8.4
Licensed Practical Nurse4041,0607480%11.2
Physical Therapy Assistant4045877076%4.6
Other Dietary Services Staff1015336571%8.2
Clinical Nurse Specialist1015236470%8.2
Administrator1015126470%8
Nurse Practitioner1015126470%8
Mental Health Service Worker1014466166%7.3
Dietitian1014385863%7.6
Respiratory Therapy Technician4043046267%4.1
Speech Language Pathologist3032705964%4.5
Physical Therapy Aide1011805459%3.3
Occupational Therapy Aide0111442426%6
Qualified Social Worker202801718%4.7
Occupational Therapy Assistant1122178%3
Medical Director101141415%1
20 Certified Nursing Assistant
% of Days 100%
14 Registered Nurse
% of Days 100%
4 Licensed Practical Nurse
% of Days 80%
4 Physical Therapy Assistant
% of Days 76%
1 Other Dietary Services Staff
% of Days 71%
1 Clinical Nurse Specialist
% of Days 70%
1 Administrator
% of Days 70%
1 Nurse Practitioner
% of Days 70%
1 Mental Health Service Worker
% of Days 66%
1 Dietitian
% of Days 63%
4 Respiratory Therapy Technician
% of Days 67%
3 Speech Language Pathologist
% of Days 64%
1 Physical Therapy Aide
% of Days 59%
1 Occupational Therapy Aide
% of Days 26%
2 Qualified Social Worker
% of Days 18%
2 Occupational Therapy Assistant
% of Days 8%
1 Medical Director
% of Days 15%

Penalties and fines

Federal penalties imposed by CMS for regulatory violations, including civil money penalties (fines) and denials of payment for new Medicare/Medicaid admissions.

Source: CMS Penalties Database

No penalties in the past 3 years

No civil money penalties or payment denials were reported in the last 3 years.

Quality of care over time

These measures show how residents usually do over time at this home, based on health outcomes and preventive care.

High-risk clinical events score Info A composite score based on pressure ulcers, falls with injury, weight loss, walking ability decline, and activities of daily living decline. 11.0
15% better than Maryland average

Maryland average: 12.9

Functional decline score Info A composite score based on activities of daily living decline, walking ability decline, and incontinence. 21.2
18% better than Maryland average

Maryland average: 25.7

Long-stay resident measures
Need for Help with Daily Activities Increased Info Percent of long-stay residents whose need for help with daily activities has increased 22.2%
6% better than Maryland average

Maryland average: 23.7%

Low Risk Residents with Bowel/Bladder Incontinence Info Percent of low risk long-stay residents who lose control of their bowels or bladder 20.1%
23% better than Maryland average

Maryland average: 25.9%

Falls with Major Injury Info Percent of long-stay residents experiencing one or more falls with major injury 2.5%
11% worse than Maryland average

Maryland average: 2.3%

High Risk Residents with Pressure Ulcers Info Percent of long-stay high risk residents with pressure ulcers 14.7%
126% worse than Maryland average

Maryland average: 6.5%

Urinary Tract Infection Info Percent of long-stay residents with a urinary tract infection 0.0%
100% better than Maryland average

Maryland average: 1.6%

Lost Too Much Weight Info Percent of long-stay residents who lose too much weight 4.4%
23% better than Maryland average

Maryland average: 5.8%

Depressive Symptoms Info Percent of long-stay residents who have depressive symptoms 0.0%
100% better than Maryland average

Maryland average: 20.2%

Antipsychotic Use Info Percent of long-stay residents who received an antipsychotic medication 11.4%
12% better than Maryland average

Maryland average: 12.9%

Pneumococcal Vaccine Info Percent of long-stay residents assessed and appropriately given the pneumococcal vaccine 100.0%
9% better than Maryland average

Maryland average: 92.0%

Influenza Vaccine Info Percent of long-stay residents assessed and appropriately given the seasonal influenza vaccine 100.0%
In line with Maryland average

Maryland average: 96.6%

Short-stay resident measures
Pneumococcal Vaccine Info Percent of short-stay residents assessed and appropriately given the pneumococcal vaccine 100.0%
27% better than Maryland average

Maryland average: 78.4%

Antipsychotic medication increase Info Percent of short-stay residents who newly received an antipsychotic medication 2.7%
94% worse than Maryland average

Maryland average: 1.4%

Influenza Vaccine Info Percent of short-stay residents assessed and appropriately given the seasonal influenza vaccine 100.0%
24% better than Maryland average

Maryland average: 80.6%

Breakdown by payment type

Medicare

71% of new residents, usually for short-term rehab.

Typical stay 28 days

Private pay

29% of new residents, often for short stays.

Typical stay 7 - 8 months

Facility Characteristics

Source: CMS Long-Term Care Facility Characteristics (Data as of Jan 2026)

Total residents 28
Medicare
6
21.4% of residents
Medicaid
1
3.6% of residents
Private pay or other
21
75% of residents
Programs & Services
CCRC

Part of a Continuing Care Retirement Community offering multiple care levels

Finances and operations

Voluntary non-profit community
Home revenue
$22.3M
Surplus of revenue
$4.1M
Voluntary non-profit community
Home revenue
$22.3M Rank #52 / 145Revenue — State benchmarkedThis home is ranked 52nd out of 145 homes in Maryland. Shows this facility's annual revenue compared to the Maryland SNF average. Higher revenue generally means more resources for staffing and capital — read alongside Payroll %.Click the rank badge to see the full State ranking.Click here to see the full State ranking.
Surplus of revenue
$4.1M
Payroll costs Info The portion of the home's budget spent on staff, including nurses, caregivers, and other employees who support care and operations. Rank #47 / 145Payroll — State benchmarkedThis home is ranked 47th out of 145 homes in Maryland. Shows total annual staff payroll benchmarked to the Maryland average. Higher payroll investment relative to peers often signals better staffing and less reliance on cheaper contract labor.Click the rank badge to see the full State ranking.Click here to see the full State ranking.
$9.9M
44.3% of revenue Rank #73 / 145Payroll % — State benchmarkedThis home is ranked 73rd out of 145 homes in Maryland. Shows payroll as a percentage of revenue versus the Maryland average. Well-run Maryland SNFs typically land around 49–57% — the top third Statewide. Below 25% may signal understaffing or heavy agency use — read with Staffing ratings.Click the rank badge to see the full State ranking.Click here to see the full State ranking.
Other operating costs Info All remaining costs needed to run the home, such as food, utilities, building maintenance, supplies and administrative expenses.
$8.3M
Total costs $18.2M

What does this home offer?

Housing options icon

Housing Options: Private Rooms

Building type icon
Building type icon

Building Type: 3-story

Transportation services icon

Transportation Services

Fitness and recreation icon

Fitness and Recreation

Who this home usually serves

TYPE OF STAY

Mostly short-term rehab stays

Most residents typically stay for a few weeks or months before returning home or moving on.

Managed by Jonathan D. Grant

Executive Vice President and Chief Operating Officer

Over 35 years of experience

Jonathan D. Grant serves as Executive Vice President and Chief Operating Officer at Acts Retirement-Life Communities. With over 35 years in retirement and health care, he has held leadership roles including Administrator and Executive Director at other communities. He holds a bachelor's in communications and an MBA from Florida Atlantic University and is a Fellow of the LeadingAge Leadership Program.

Places of interest near Buckingham‘s Choice

Address 8.0 miles from city center Info Estimated distance in miles from Adamstown's city center to Buckingham‘s Choice's address, calculated via Google Maps. — 14.15 miles to nearest hospital (Frederick Health Mt Airy)

Calculate Travel Distance to Buckingham‘s Choice

Add your location

Address

Financial Assistance for
Nursing Home in Maryland

Buckingham‘s Choice is located in Adamstown, Maryland.
Here are the financial assistance programs available to residents in Maryland.

Get Financial aid guidance

Community Options Waiver

Maryland Medicaid Community Options Waiver

Age 65+ or disabled
General Maryland resident, Medicaid- eligible, nursing home-level care need.
Income Limits (2025) ~$2,829/month 300% FBR, individual
Asset Limits $2,000 (individual), $3,000 (couple) (excludes home, car).
MD

High urban demand; rural outreach efforts.

Benefits
Personal care (5-7 hours/day, e.g., bathing, dressing) Respite care (up to 240 hours/year) Adult day care ($70/day) Home modifications ($1,500 avg.)

Senior Care Program

Maryland Senior Care

Age 65+
General Maryland resident, at risk of nursing home placement.
Income Limits ~$2,000/month individual, varies by county
Asset Limits $11,000 individual
MD

Limited funding; waitlists common in high-demand areas.

Benefits
In-home care (3-5 hours/week) Respite care (up to 10 days/year) Meals (~$6/meal) Transportation (~5 trips/month) Case management

Maryland Nursing Home Medicaid

Maryland Medical Assistance (Medicaid) Nursing Home Program

Age 65+
General Maryland resident, Medicaid-eligible, requires nursing home-level care.
Income Limits (2025) $943/month (individual); most income applied to care costs.
Asset Limits $2,500 (individual), $3,000 (couple); spousal protections up to $155,356.
MD

Home equity limit $636,000; estate recovery applies post-55.

Benefits
24/7 nursing care Meals Therapy Medications (unlimited per medical need)

Senior Assisted Living Subsidy Program

Maryland Senior Assisted Living Group Home Subsidy

Age 62+
General Maryland resident, in or moving to approved assisted living, low/moderate income.
Income Limits (2025) ~$34,000/year individual, varies by county
Asset Limits Not strict; prioritizes low-income.
MD

Not available statewide; facility must be licensed by MDH.

Benefits
Personal care Meals 24-hour supervision (up to $1,500/month subsidy typical)

Veterans Aid and Attendance (A&A) Benefit

Maryland VA Aid and Attendance

Age
General Wartime veteran/spouse, age 65+ or disabled, needs ADL help, Maryland resident.
Income Limits (2025) Net income minus medical expenses < $1,984/month individual with A&A
Asset Limits $155,356 net worth limit
MD

High veteran population in suburban/rural areas.

Benefits
Cash benefit ($1,478-$2,471/month, varies by status) for care costs

Senior Prescription Drug Assistance Program (SPDAP)

Maryland Senior Prescription Drug Assistance Program

Age 65+
General Maryland resident (6+ months), Medicare Part D enrolled.
Income Limits (2025) $48,560/year individual, 300% FPL
Asset Limits None specified.
MD

Supplements Medicare Part D; annual enrollment required.

Benefits
Up to $40/month premium subsidy Reducing drug costs

Medicare Savings Programs (MSP)

Maryland Medicare Savings Programs

Age 65+
General Maryland resident, Medicare Part A/B enrollee.
Income Limits (2025) $2,014/month (QMB), $2,706/month (SLMB/QI, individual).
Asset Limits $9,090 (individual), $13,630 (couple).
MD

Includes QMB, SLMB, QI categories.

Benefits
Covers premiums (up to $174.70/month Part B) Co-pays Deductibles

Community Personal Assistance Services (CPAS)

Maryland Medicaid Community Personal Assistance Services

Age 65+
General Maryland resident, Medicaid-eligible, needs ADL assistance.
Income Limits (2025) $943/month (individual); spend-down available.
Asset Limits $2,500 (individual), $3,000 (couple).
MD

Consumer-directed option allows hiring family caregivers.

Benefits
Personal care (hours vary, typically 20-30/week) Chores Nurse supervision

Frequently Asked Questions about Buckingham‘s Choice

What neighborhood is Buckingham‘s Choice in?

Buckingham‘s Choice is in the Baker Circle neighborhood of Adamstown.

Is Buckingham‘s Choice in a walkable area?

Buckingham‘s Choice has a walk score of 3. Car-dependent. Most errands require a car, with limited nearby walkable options.

Are there photos of Buckingham‘s Choice?

Yes — there are 2 photos of Buckingham‘s Choice in the photo gallery on this page.

What is the phone number of Buckingham‘s Choice?

(301) 874-5630 will put you in contact with the team at Buckingham‘s Choice.

Is Buckingham‘s Choice Medicare or Medicaid certified?

Yes — Buckingham‘s Choice is a CMS-certified provider of Medicare and Medicaid.

Guides for Better Senior Living

Care Cost Calculator: See Prices in Your Area

Nursing Home Data Explorer

Don’t Wait Too Long: 7 Red Flag Signs Your Parent Needs Assisted Living Now

The True Cost of Assisted Living in 2025 – And How Families Are Paying For It

Understanding Senior Living Costs: Pricing Models, Discounts & Financial Assistance

Explore Open Rooms
1 Contact details
2 What type of senior care service are you looking for?
3 What budget do you have in mind for senior care?
4 How soon do you need to find care?
5 Additional details

Thank you for your interest!

Our team will be in touch shortly to help with next steps.