Holt Senior Care & Rehab Center
CMS overall rating Info CMS (the Centers for Medicare & Medicaid Services) is the federal agency that rates nursing home quality. Its Overall Rating runs from 1 to 5 stars, combining health inspections, staffing, and quality measures, with inspections weighted most heavily.

Holt Senior Care & Rehab Center

CMS overall rating Info CMS (the Centers for Medicare & Medicaid Services) is the federal agency that rates nursing home quality. Its Overall Rating runs from 1 to 5 stars, combining health inspections, staffing, and quality measures, with inspections weighted most heavily.
Calculator: See prices in your area
Holt Senior Care & Rehab Center accepts Medicare, Medicaid, and private pay.

Overview of Holt Senior Care & Rehab Center

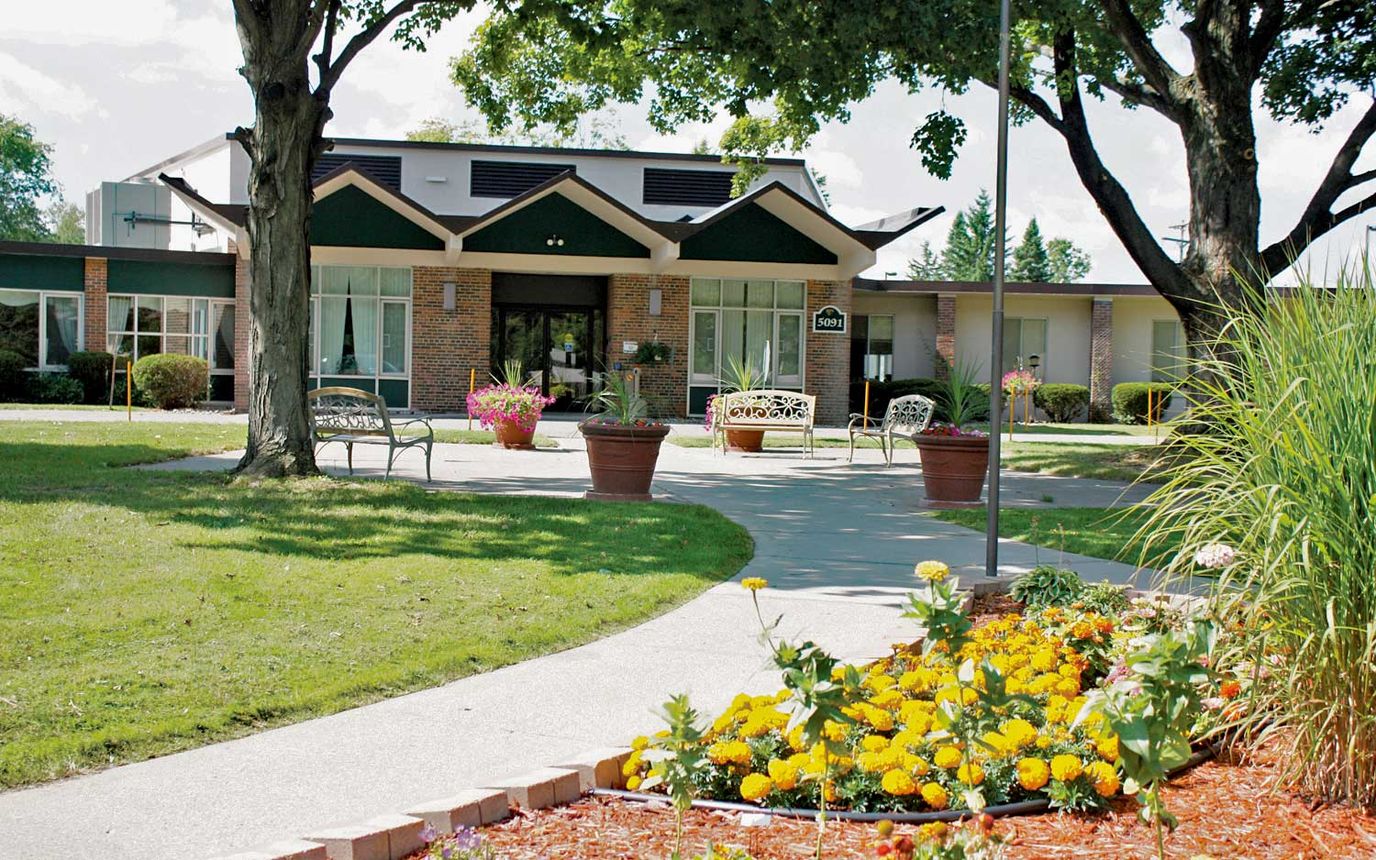
Located in Michigan, the Holt Senior Care & Rehab Center stands as a reliable haven for seniors, offering a range of essential services that truly matter. With a focus on short-term rehabilitation and long-term care, this center is staffed by compassionate professionals who work tirelessly to create a supportive and nurturing environment. Beyond the care it provides, the facility understands the significance of nursing home rules and regulations, ensuring that residents are not only well-cared for, but also protected within a framework of safety.
What truly sets the home apart is not only its commitment to quality care, but the heartfelt connections it cultivates. Residents often share their experiences through positive nursing home reviews, praising the sense of community, the attentive staff, and the warm atmosphere that envelops them. It’s a place where individuals find comfort, support, and the companionship they deserve.

Quality ratings

Measured by Centers for Medicare & Medicaid Services (CMS)

Overall rating Info The Overall CMS Rating combines results from health inspections, staffing levels and quality measures. Health inspections carry the most weight. Staffing and quality scores can increase or decrease the final rating based on performance compared to state and national standards.
▼ 4.4% Below MI avg. ▼ 4.4% Below MI avg.MI average: 3.1Click the badge to see the full State ranking.Click here to see the full State ranking.
Health Inspection Info Based on the results of the facility's three most recent standard inspections and any complaint investigations. CMS reviews the number, scope, and severity of deficiencies, with more recent findings weighted more heavily.
▲ 6.1% Above MI avg. ▲ 6.1% Above MI avg.MI average: 2.8Click the badge to see the full State ranking.Click here to see the full State ranking.
Staffing Info Measures average nursing staff hours per resident per day, including Registered Nurses (RNs) and total nursing staff. Ratings are adjusted based on the level of care residents require and are compared to state and national benchmarks.
▲ 14.4% Above MI avg. ▲ 14.4% Above MI avg.MI average: 3.5Click the badge to see the full State ranking.Click here to see the full State ranking.
Quality Measures Info Based on clinical and physical health indicators reported to CMS, such as hospital readmissions, falls, pressure ulcers, and improvements in mobility. These measures reflect how well residents' health needs are being managed.
▲ 6.4% Above MI avg. ▲ 6.4% Above MI avg.MI average: 3.8Click the badge to see the full State ranking.Click here to see the full State ranking.

Staffing hours breakdown

Info Daily nursing hours per resident by staff type, reported to CMS. Higher is generally better — compare this facility to state and national averages to see where staffing stands.

Hours per resident per day — compared to Michigan state averages

Total nursing care / resident Info This home is ranked 60th out of 142 homes in Michigan for nurse hours. Total adjusted nursing hours per resident per day, combining RN, LPN, and aide time. CMS adjusts this for case-mix so facilities can be fairly compared.
4h 5m per day
Rank #60 / 142Nurse hours — State benchmarkedThis home is ranked 60th out of 142 homes in Michigan. Shows adjusted nurse hours per resident per day benchmarked to the Michigan average, with a ranking across 142 Michigan facilities. More hours mean more direct care. The national average is about 3.5 hrs; below 3.0 is a red flag.Rankings are based only on facilities in Michigan that report data for that category. Facilities without available data are excluded from the ranking.Click the rank badge to see the full State ranking.Click here to see the full State ranking.
This facility Michigan avg (4h 18m per day)
vs Michigan avg
-5%

3 of 6 metrics below state avg

Staff typeHours / Day / Residentvs state avg
Registered Nurse (RN) Info RNs hold the highest nursing license and can assess residents, interpret test results, and direct care plans. More RN hours per day often signals stronger clinical oversight and faster response to health changes. 45m per day ▼ 3% State avg: 46m per day · National avg: 41m per day
LPN / LVN Info Licensed Practical Nurses (LPNs) or Licensed Vocational Nurses (LVNs) deliver routine hands-on care — medication administration, wound dressing, and monitoring vital signs. They work under RN supervision and make up a large share of daily bedside care. 39m per day ▼ 27% State avg: 53m per day · National avg: 52m per day
Nurse Aide Info Certified Nurse Aides (CNAs) provide the most direct day-to-day assistance: bathing, dressing, feeding, and mobility. Nurse aide hours are typically the largest staffing category and directly affect residents' quality of life. 2h 24m per day ■ Avg State avg: 2h 23m per day · National avg: 2h 21m per day
Weekend Total Nursing Info Combined nursing hours (RN + LPN + Nurse Aide) per resident per day on weekends. Staffing often drops on weekends — this figure reveals whether the facility maintains adequate coverage outside of weekday hours. 3h 29m per day ■ Avg State avg: 3h 31m per day · National avg: 3h 26m per day
Physical Therapist Info Hours per resident per day provided by licensed Physical Therapists (PTs) or PT Assistants. PT services help residents recover mobility after injury or illness and are especially important for post-acute (short-stay) rehabilitation. 1m per day ▼ 70% State avg: 4m per day · National avg: 4m per day
Weekend RN Info Registered nurse hours specifically on weekends. Facilities sometimes reduce RN presence on Saturdays and Sundays — a low weekend RN figure compared to weekday hours can indicate reduced clinical oversight when most administrative staff are absent. 29m per day ■ Avg State avg: 29m per day · National avg: 29m per day

Capacity and availability

This home usually has availability

Lower occupancy than the Michigan average: 75.8%
Occupancy rate
73.5% Rank #107 / 395Occupancy rate — State benchmarkedThis home is ranked 107th out of 395 homes in Michigan. Shows this facility's occupancy rate versus the Michigan average, with its Statewide rank out of 395. Higher occupancy signals strong local demand and financial stability.Rankings are based only on facilities in Michigan that report data for that category. Facilities without available data are excluded from the ranking.Click the rank badge to see the full State ranking.Click here to see the full State ranking.
Avg. Length of Stay
101 days
Bed community size
141-bed community Rank #41 / 435Bed count — State benchmarkedThis home is ranked 41st out of 435 homes in Michigan. Shows this facility's certified or reported bed count compared to other Michigan facilities. Larger communities may offer more amenities, programs, and on-site services for residents and families.Rankings are based only on facilities in Michigan that report data for that category. Facilities without available data are excluded from the ranking.Click the rank badge to see the full State ranking.Click here to see the full State ranking.
A larger shared setting that may offer more common spaces and organized community services.
Walk Score
Walk Score: 25 / 100 Rank #480 / 703Walk Score — State benchmarkedThis home is ranked 480th out of 703 homes in Michigan. Shows how walkable this facility's neighborhood is compared to the average Walk Score across Michigan facilities. Higher scores benefit residents, families, and staff.Rankings are based only on facilities in Michigan that report data for that category. Facilities without available data are excluded from the ranking.Click the rank badge to see the full State ranking.Click here to see the full State ranking.
Somewhat walkable. A few nearby services may be reachable on foot, but most trips require transportation.

About this community

Awards

5-star facility

Therapy & Rehabilitation

2 services
Rehabilitation Services
Respite Care

Staffing & Medical

1 service
24-Hour Staffing

Amenities & Lifestyle

Private Suites
Rn Care
Flat Screen Tvs
Salon / Barbershop
Restaurant-Style Dining
Specific ProgramsShort-Term Rehabilitation, Physical Therapy, Occupational Therapy, Speech Therapy, Daily Personalized Activities, Off-Site Activities, Family-Style Atmosphere, Medication Dispensing and Management, Spiritual Support Services
Operating Hours24/7

Contact Holt Senior Care & Rehab Center

Staffing Data

Reporting period: October 1 – December 31, 2025 (Q4 2025). Source: CMS Payroll-Based Journal report.

Total staff 164
Employees 139
Contractors 25
Staff to resident ratio 1.46 : 1
14% fewer staff per resident than Michigan average
Michigan average ratio: 1.70 : 1 Michigan average ratio: 1.70 : 1See full Michigan ranking
Avg staff/day 64
Average shift 8.3 hours
5% better than Michigan average
Michigan average: 7.9 hours Michigan average shift: 7.9 hoursSee full Michigan ranking
Total staff hours (quarter) 48,598

Nursing staff breakdown

Q4 2025 · Oct 1 – Dec 31 More info This data comes from the CMS Payroll-Based Journal report covering October 1 – December 31, 2025.
Registered Nurse

Manages medical care and health needs.

RN Staff Info All 23 RN Staff are full-time employees. No contractors work on this role. 23
Average shift length Info Average shift length. Calculated as total hours divided by days worked and average staff per day. 9 hours
Licensed Practical Nurse

Assists with medical care and medications.

LPN Staff Info All 21 LPN Staff are full-time employees. No contractors work on this role. 21
Average shift length Info Average shift length. Calculated as total hours divided by days worked and average staff per day. 8.8 hours
Certified Nursing Assistant

Helps with daily care and mobility.

CNA Staff Info All 78 CNA Staff are full-time employees. No contractors work on this role. 78
Average shift length Info Average shift length. Calculated as total hours divided by days worked and average staff per day. 8.8 hours

Contractor staffing

Q4 2025 · Oct 1 – Dec 31 More info This data comes from the CMS Payroll-Based Journal report covering October 1 – December 31, 2025.

Total hours from contractors

7.8%

3,813 contractor hours this quarter

Speech Language Pathologist: 5 Physical Therapy Aide: 5 Respiratory Therapy Technician: 5 Qualified Social Worker: 5 Physical Therapy Assistant: 4 Medical Director: 1

Staff by category

Q4 2025 · Oct 1 – Dec 31 More info This data comes from the CMS Payroll-Based Journal report covering October 1 – December 31, 2025.
Certified Nursing Assistant7807825,43192100%8.8
Licensed Practical Nurse210216,82792100%8.8
Registered Nurse230236,43492100%9
Other Dietary Services Staff6061,83792100%6.7
Speech Language Pathologist0551,6798289%7.5
Mental Health Service Worker3031,0157177%7.6
Occupational Therapy Aide2029846470%8
Physical Therapy Aide0559627582%7.6
Clinical Nurse Specialist3039456975%8
Physical Therapy Assistant0447958896%5.9
Administrator1014886166%8
Nurse Practitioner1014645863%8
Dietitian1013604549%8
Respiratory Therapy Technician0552087379%2.3
Qualified Social Worker0551392830%4.8
Medical Director011304549%0.7
78 Certified Nursing Assistant
% of Days 100%
21 Licensed Practical Nurse
% of Days 100%
23 Registered Nurse
% of Days 100%
6 Other Dietary Services Staff
% of Days 100%
5 Speech Language Pathologist
% of Days 89%
3 Mental Health Service Worker
% of Days 77%
2 Occupational Therapy Aide
% of Days 70%
5 Physical Therapy Aide
% of Days 82%
3 Clinical Nurse Specialist
% of Days 75%
4 Physical Therapy Assistant
% of Days 96%
1 Administrator
% of Days 66%
1 Nurse Practitioner
% of Days 63%
1 Dietitian
% of Days 49%
5 Respiratory Therapy Technician
% of Days 79%
5 Qualified Social Worker
% of Days 30%
1 Medical Director
% of Days 49%

Penalties and fines

Includes penalties issued in 2024-2025

Federal penalties imposed by CMS for regulatory violations, including civil money penalties (fines) and denials of payment for new Medicare/Medicaid admissions.

Source: CMS Penalties Database (Data as of Jan 2026)

Total fines amount $85K Rank #112 / 145Federal fines — State benchmarkedThis home is ranked 112th out of 145 homes in Michigan. Shows this facility's cumulative CMS federal fine dollars versus the Michigan average among facilities with fines, and where it ranks among 145 facilities in the pool. Lower total dollars mean a better rank.Rankings are based only on facilities in Michigan that report data for that category. Facilities without available data are excluded from the ranking.Click the rank badge to see the full State ranking.Click here to see the full State ranking.
12% higher than Michigan average

Michigan average: $76K

Number of fines 3
48% more fines than Michigan average

Michigan average: 2.0

Payment Denials Info Serious action where Medicare and/or Medicaid temporarily stops payments for new residents until issues are fixed. 1
19% more payment denials than Michigan average

Michigan average: 0.8

Fines amount comparison
This facility $85K
Michigan average $76K
Penalty History

Penalties are imposed by CMS for violations of federal nursing home regulations.

3 penalties in the past 3 years

Multiple penalties were reported in the last 3 years.

Civil Money Penalty Info Fines imposed for noncompliance, which can be assessed per day or per instance of violation. Apr 30, 2025
$55K
Civil Money Penalty Info Fines imposed for noncompliance, which can be assessed per day or per instance of violation. Mar 13, 2025
$27K
Payment Denial Info Serious action where Medicare and/or Medicaid temporarily stops payments for new residents until issues are fixed. May 3, 2024
11 days

Last updated: Jan 2026

Quality of care over time

These measures show how residents usually do over time at this home, based on health outcomes and preventive care.

High-risk clinical events score Info A composite score based on pressure ulcers, falls with injury, weight loss, walking ability decline, and activities of daily living decline. 9.0
7% worse than Michigan average

Michigan average: 8.4

Functional decline score Info A composite score based on activities of daily living decline, walking ability decline, and incontinence. 12.5
23% better than Michigan average

Michigan average: 16.3

Long-stay resident measures
Significantly above average Info CMS star rating based on long-stay quality measure performance. 5 stars = significantly above average, 1 star = significantly below average.
Need for Help with Daily Activities Increased Info Percent of long-stay residents whose need for help with daily activities has increased 17.2%
38% worse than Michigan average

Michigan average: 12.5%

Walking Ability Worsened Info Percent of long-stay residents whose ability to move independently worsened 11.1%
27% better than Michigan average

Michigan average: 15.3%

Low Risk Residents with Bowel/Bladder Incontinence Info Percent of low risk long-stay residents who lose control of their bowels or bladder 9.3%
56% better than Michigan average

Michigan average: 21.0%

Falls with Major Injury Info Percent of long-stay residents experiencing one or more falls with major injury 4.6%
44% worse than Michigan average

Michigan average: 3.2%

High Risk Residents with Pressure Ulcers Info Percent of long-stay high risk residents with pressure ulcers 3.9%
32% better than Michigan average

Michigan average: 5.7%

Urinary Tract Infection Info Percent of long-stay residents with a urinary tract infection 2.8%
64% worse than Michigan average

Michigan average: 1.7%

Lost Too Much Weight Info Percent of long-stay residents who lose too much weight 8.0%
42% worse than Michigan average

Michigan average: 5.7%

Depressive Symptoms Info Percent of long-stay residents who have depressive symptoms 0.0%
100% better than Michigan average

Michigan average: 3.9%

Antipsychotic Use Info Percent of long-stay residents who received an antipsychotic medication 14.3%
In line with Michigan average

Michigan average: 15.0%

Pneumococcal Vaccine Info Percent of long-stay residents assessed and appropriately given the pneumococcal vaccine 99.4%
5% better than Michigan average

Michigan average: 94.9%

Influenza Vaccine Info Percent of long-stay residents assessed and appropriately given the seasonal influenza vaccine 100.0%
5% better than Michigan average

Michigan average: 95.0%

Hospitalizations per 1,000 days Info Number of hospitalizations per 1,000 long-stay resident days. 1.01
42% better than Michigan average

Michigan average: 1.74

ED visits per 1,000 days Info Number of outpatient emergency department visits per 1,000 long-stay resident days. 0.68
56% better than Michigan average

Michigan average: 1.54

Short-stay resident measures
Average Info CMS star rating based on short-stay quality measure performance. 5 stars = much above average, 1 star = much below average.
Pneumococcal Vaccine Info Percent of short-stay residents assessed and appropriately given the pneumococcal vaccine 87.3%
6% better than Michigan average

Michigan average: 82.5%

Antipsychotic medication increase Info Percent of short-stay residents who newly received an antipsychotic medication 0.9%
37% better than Michigan average

Michigan average: 1.4%

Influenza Vaccine Info Percent of short-stay residents assessed and appropriately given the seasonal influenza vaccine 80.4%
In line with Michigan average

Michigan average: 79.5%

Re-hospitalized after SNF stay Info Percentage of short-stay residents who were re-hospitalized after their nursing home admission. 19.1%
21% better than Michigan average

Michigan average: 24.2%

Emergency department visits Info Percentage of short-stay residents who had an outpatient emergency department visit. 16.4%
43% worse than Michigan average

Michigan average: 11.5%

Falls with major injury Info Percentage of SNF residents who experience falls with major injury during their stay. 0.0%
100% better than Michigan average

Michigan average: 0.8%

Ability to care for self at discharge Info Percentage of residents at or above expected ability to care for themselves at discharge. 30.9%
42% worse than Michigan average

Michigan average: 53.7%

Successful return to home or community Info Rate of successful return to home or community from a skilled nursing facility. 58.5%
16% better than Michigan average

Michigan average: 50.6%

Breakdown by payment type

Medicare

27% of new residents, usually for short-term rehab.

Typical stay 16 days

Private pay

59% of new residents, often for short stays.

Typical stay 1 - 2 months

Medicaid

14% of new residents, often for long-term daily care.

Typical stay 1 - 2 years

Facility Characteristics

Source: CMS Long-Term Care Facility Characteristics (Data as of Jan 2026)

Total residents 112
Medicare
31
27.7% of residents
Medicaid
62
55.4% of residents
Private pay or other
19
17% of residents
Programs & Services
Residents Group

Residents meet regularly to discuss policies, care quality, and activities

Active Resident Council

Organized group of residents that meets regularly to discuss facility policies, quality of life, and activities.

Finances and operations

Based on CMS SNF Cost Report for fiscal year ending in 12/2023.

For-profit
Operated by a single business entity.
Net patient revenue Info Net patient revenue — what the home actually collects for resident care, after contractual allowances, bad debt and discounts are subtracted from its gross charges (CMS cost report, Worksheet G-3). It covers resident care only; money the home earns from other sources is shown separately as "Other income."
$13.0M
Net patient income Info Net patient income: net patient revenue minus the home's total operating expenses. A positive figure means it earns more from resident care than it spends to deliver it; a negative figure means the opposite. It excludes non-operating "other income."
-$376.2K
For-profit Operated by a single business entity.
Net patient revenue Info Net patient revenue — what the home actually collects for resident care, after contractual allowances, bad debt and discounts are subtracted from its gross charges (CMS cost report, Worksheet G-3). It covers resident care only; money the home earns from other sources is shown separately as "Other income."
$13.0M Rank #59 / 143Revenue — State benchmarkedThis home is ranked 59th out of 143 homes in Michigan. Shows this facility's annual revenue compared to the Michigan average. Higher revenue generally means more resources for staffing and capital — read alongside Payroll %.Rankings are based only on facilities in Michigan that report data for that category. Facilities without available data are excluded from the ranking.Click the rank badge to see the full State ranking.Click here to see the full State ranking.
Net patient income Info Net patient income: net patient revenue minus the home's total operating expenses. A positive figure means it earns more from resident care than it spends to deliver it; a negative figure means the opposite. It excludes non-operating "other income."
-$376.2K
Other income Info Money the home earns outside of resident care — such as investments, grants, rentals and other non-operating sources (CMS cost report, Worksheet G-3). It is tracked separately from net patient revenue: it is not part of that figure, and it is not included in net patient income.
$655.2K
Payroll costs Info Staff salaries plus wage-related costs — benefits such as payroll taxes, health insurance and retirement — from the home's own accounting records (CMS cost report, Worksheet A). Contract or agency labor is counted separately, under other operating costs. Rank #52 / 143Payroll — State benchmarkedThis home is ranked 52nd out of 143 homes in Michigan. Shows total annual staff payroll benchmarked to the Michigan average. Higher payroll investment relative to peers often signals better staffing and less reliance on cheaper contract labor.Rankings are based only on facilities in Michigan that report data for that category. Facilities without available data are excluded from the ranking.Click the rank badge to see the full State ranking.Click here to see the full State ranking.
$7.5M 57.9% of net patient revenue Info Payroll as a share of revenue: staff salaries and wage-related benefits divided by net patient revenue. A higher figure means more of each revenue dollar goes to staff pay. Rank #68 / 143Payroll % — State benchmarkedThis home is ranked 68th out of 143 homes in Michigan. Shows payroll as a percentage of revenue versus the Michigan average. Well-run Michigan facilities typically land around 49–59% — the top third Statewide. Below 25% may signal understaffing or heavy agency use — read with Staffing ratings.Rankings are based only on facilities in Michigan that report data for that category. Facilities without available data are excluded from the ranking.Click the rank badge to see the full State ranking.Click here to see the full State ranking.
Other operating costs Info Everything it costs to run the home apart from payroll — food, utilities, supplies, maintenance, contract labor and administration. Calculated as total operating expense minus payroll (staff salaries and wage-related benefits).
$5.8M
Total costs Info The home's total operating expense for the year — all the costs of running it, salaries included (CMS cost report, Worksheet G-3).
$13.4M

Who this home usually serves

TYPE OF STAY

Mix of rehab and long-term care

This home supports both short-term rehab and long-term care, with residents staying for a wide range of durations.

Most new residents arrive under private pay (59% of admissions), and a typical private pay stay runs around 1 - 2 months.

Admissions
372 total

Coverage residents most often arrive under.

Medicare 27%
Private pay 59%
Medicaid 14%
Discharges
375 total

Coverage residents most often leave under.

Medicare 19%
Private pay 58%
Medicaid 23%

Compare Nursing Homes around Lansing

The information below is reported by the Michigan Department of Licensing and Regulatory Affairs (LARA).

3 facilities compared · CMS & MI Dept. of Health data

Holt Senior Care & Rehab Center
NH
Lansing
141
Facility 141
MI AVG 75
Rank #41 / 435
73.5%
Facility 73.5%
MI AVG 75.8%
Rank #107 / 395
-3%
4.09
Facility 4.09
MI AVG 4.30
Rank #60 / 142
+37%-5%
$53.4k
Facility $53.4k
MI AVG $87.6k
Rank #112 / 145
22
Facility 22
MI AVG 33.5
Rank #50 / 144
4.4
Facility 4.4
MI AVG 5.2
Rank #55 / 144
4115-
25
Facility 25
MI AVG 39
Rank #480 / 703
John Merlo
$13.0M
Facility $13.0M
MI AVG $15.8M
Rank #59 / 143
$7.5M
Facility $7.5M
MI AVG $5.6M
Rank #52 / 143
57.9%
Facility 57.9%
MI AVG 39%
Rank #68 / 143
235123
The Dimondale Nursing Care Center
NH
MC
NC
Lansing
150
Facility 150
MI AVG 75
Rank #32 / 435
87.2%
Facility 87.2%
MI AVG 75.8%
Rank #47 / 395
+15%
4.35
Facility 4.35
MI AVG 4.30
Rank #39 / 142
-2%+1%
$35.3k
Facility $35.3k
MI AVG $87.6k
Rank #105 / 145
38
Facility 38
MI AVG 33.5
Rank #93 / 144
4.8
Facility 4.8
MI AVG 5.2
Rank #66 / 144
4142-
0
Facility 0
MI AVG 39
Rank #688 / 703
Hollie Stambersky
$17.0M
Facility $17.0M
MI AVG $15.8M
Rank #35 / 143
$9.6M
Facility $9.6M
MI AVG $5.6M
Rank #36 / 143
56.5%
Facility 56.5%
MI AVG 39%
Rank #73 / 143
235256
Burcham Hills
NH
AL
IL
MC
RC
East Lansing (Burcham Drive)
266
Facility 266
MI AVG 75
Rank #4 / 435
51.9%
Facility 51.9%
MI AVG 75.8%
Rank #191 / 395
-32%
4.82
Facility 4.82
MI AVG 4.30
Rank #29 / 142
-48%+12%
$37.6k
Facility $37.6k
MI AVG $87.6k
Rank #106 / 145
49
Facility 49
MI AVG 33.5
Rank #111 / 144
4.9
Facility 4.9
MI AVG 5.2
Rank #68 / 144
6112-
11
Facility 11
MI AVG 39
Rank #601 / 703
Angela Brummette
$29.0M
Facility $29.0M
MI AVG $15.8M
Rank #11 / 143
$14.1M
Facility $14.1M
MI AVG $5.6M
Rank #8 / 143
48.7%
Facility 48.7%
MI AVG 39%
Rank #35 / 143
235236

Financial Assistance for
Nursing Home in Michigan

Holt Senior Care & Rehab Center is located in Lansing, Michigan.
Here are the financial assistance programs available to residents in Michigan.

Get Financial aid guidance

MI Choice Waiver

Michigan Medicaid MI Choice Waiver

Age 65+ or disabled
General Michigan resident, Medicaid- eligible, nursing home-level care need.
Income Limits (2025) ~$2,829/month 300% FBR, individual
Asset Limits $2,000 (individual), $3,000 (couple).
MI

Delivered through regional waiver agents; waitlists possible.

Benefits
Personal care (5-7 hours/day) Respite care (240 hours/year) Home modifications ($1,500 avg.) Adult day care ($65/day)

Home Help Program

Michigan Home Help

Age 65+ or disabled
General Michigan resident, Medicaid- eligible or low-income.
Income Limits ~$1,732/month individual, Medicaid threshold
Asset Limits $2,000 individual
MI

Can hire family caregivers; less intensive than waiver.

Benefits
Personal care (up to 60 hours/month) Homemaker services Respite (varies)

Program of All-Inclusive Care for the Elderly (PACE)

Michigan PACE

Age 55+
General Michigan resident, nursing home-level care need, safe with PACE support.
Income Limits (2025) ~$2,829/month (Medicaid-eligible); private pay option available.
Asset Limits $2,000 (individual), $3,000 (couple).
MI

16 PACE centers (e.g., Ingham, Wayne counties); expanding slowly.

Benefits
Personal care (5-7 hours/day) Medical care Meals Transportation Therapy Respite

Medicare Savings Program (MSP)

Michigan Medicare Savings Program

Age 65+ or disabled
General Michigan resident, Medicare Part A/B.
Income Limits (2025) ~$2,510/month (QMB), ~$3,380/month (SLMB), ~$3,598/month (QI)—individual.
Asset Limits $9,430 (individual), $14,130 (couple).
MI

Three tiers; no waitlist; includes Extra Help for Part D.

Benefits
Covers Part B premiums ($174.70/month) Deductibles ($240/year) Copays (~20%)

National Family Caregiver Support Program (NFCSP) Respite

Michigan NFCSP Respite Care

Age
General Caregivers of 60+ needing care or 55+ caregivers of others; Michigan resident; functional needs (2+ ADLs).
Income Limits (2025) Prioritizes ~$24,980/year (individual); no strict cap.
Asset Limits Not assessed; need-based.
MI

16 AAAs; prioritizes low-income, rural caregivers.

Benefits
Respite (4-6 hours/week or 5 days/year) Adult day care ($60/day) Caregiver training

VA Aid and Attendance (A&A) and Housebound Benefits

Michigan VA Aid and Attendance/Housebound

Age 65+ or disabled veteran/spouse
General Michigan resident, wartime service, need for ADL help (A&A) or homebound.
Income Limits (2025) Net income < ~$1,984/month (veteran with dependent, A&A); pension offsets income.
Asset Limits ~$155,356 net worth limit
MI

High veteran demand in urban/rural areas.

Benefits
Cash (~$1,433-$2,642/month veteran, ~$951-$1,318 spouse) for care costs

Frequently Asked Questions about Holt Senior Care & Rehab Center

Is Holt Senior Care & Rehab Center in a walkable area?

Holt Senior Care & Rehab Center has a walk score of 25. Somewhat walkable. A few nearby services may be reachable on foot, but most trips require transportation.

What is the occupancy rate at Holt Senior Care & Rehab Center?

Holt Senior Care & Rehab Center's occupancy is 73.5%.

Does Holt Senior Care & Rehab Center operate as a for-profit or non-profit?

Holt Senior Care & Rehab Center is registered as a for-profit.

Are there photos of Holt Senior Care & Rehab Center?

Yes — there are 4 photos of Holt Senior Care & Rehab Center in the photo gallery on this page.

What is the phone number of Holt Senior Care & Rehab Center?

(517) 694-2144 will put you in contact with the team at Holt Senior Care & Rehab Center.

Is Holt Senior Care & Rehab Center Medicare or Medicaid certified?

Yes — Holt Senior Care & Rehab Center is a CMS-certified provider of Medicare and Medicaid.

Guides for Better Senior Living

Care Cost Calculator: See Prices in Your Area

Nursing Home Data Explorer

Don’t Wait Too Long: 7 Red Flag Signs Your Parent Needs Assisted Living Now

The True Cost of Assisted Living in 2025 – And How Families Are Paying For It

Understanding Senior Living Costs: Pricing Models, Discounts & Financial Assistance