Canterbury Place
CMS overall rating Info CMS (the Centers for Medicare & Medicaid Services) is the federal agency that rates nursing home quality. Its Overall Rating runs from 1 to 5 stars, combining health inspections, staffing, and quality measures, with inspections weighted most heavily.

Canterbury Place

CMS overall rating Info CMS (the Centers for Medicare & Medicaid Services) is the federal agency that rates nursing home quality. Its Overall Rating runs from 1 to 5 stars, combining health inspections, staffing, and quality measures, with inspections weighted most heavily.
Calculator: See prices in your area
Canterbury Place accepts Medicare, Medicaid, and private pay.

Overview of Canterbury Place

Canterbury Place offers rehabilitation, skilled nursing, memory support, and personal care. The senior home has maintained a high-quality standard of service delivered with compassion. Canterbury Place is a resident-centered community that guarantees full support by professional nurses, licensed practical nurses, and assistants. 
Nursing home residents are under inpatient or outpatient programs with therapy and other specific treatment plans. Personal care and memory care residents are able to get on with daily tasks with assistance from the staff, and take part in stimulating activities; they are assisted in everyday living with enriching activities that contribute to a high success rate for recovery

(412) 622-9000

Quality ratings

Measured by Centers for Medicare & Medicaid Services (CMS)

Overall rating Info The Overall CMS Rating combines results from health inspections, staffing levels and quality measures. Health inspections carry the most weight. Staffing and quality scores can increase or decrease the final rating based on performance compared to state and national standards.
▼ 74.0% Below PA avg. ▼ 74.0% Below PA avg.Click the badge to see the full State ranking.Click here to see the full State ranking.
Health Inspection Info Based on the results of the facility's three most recent standard inspections and any complaint investigations. CMS reviews the number, scope, and severity of deficiencies, with more recent findings weighted more heavily.
▼ 43.2% Below PA avg. ▼ 43.2% Below PA avg.Click the badge to see the full State ranking.Click here to see the full State ranking.
Staffing Info Measures average nursing staff hours per resident per day, including Registered Nurses (RNs) and total nursing staff. Ratings are adjusted based on the level of care residents require and are compared to state and national benchmarks.
▼ 1.7% Below PA avg. ▼ 1.7% Below PA avg.Click the badge to see the full State ranking.Click here to see the full State ranking.
Quality Measures Info Based on clinical and physical health indicators reported to CMS, such as hospital readmissions, falls, pressure ulcers, and improvements in mobility. These measures reflect how well residents' health needs are being managed.
▼ 73.7% Below PA avg. ▼ 73.7% Below PA avg.Click the badge to see the full State ranking.Click here to see the full State ranking.

Staffing hours breakdown

Info Daily nursing hours per resident by staff type, reported to CMS. Higher is generally better — compare this facility to state and national averages to see where staffing stands.

Hours per resident per day — compared to Pennsylvania state averages

Total nursing care / resident Info This home is ranked 89th out of 203 homes in Pennsylvania for nurse hours. Total adjusted nursing hours per resident per day, combining RN, LPN, and aide time. CMS adjusts this for case-mix so facilities can be fairly compared.
4h 19m per day
Rank #89 / 203Nurse hours — State benchmarkedThis home is ranked 89th out of 203 homes in Pennsylvania for nurse hours. Shows adjusted nurse hours per resident per day benchmarked to the Pennsylvania average, with a ranking across 203 Pennsylvania SNFs. More hours mean more direct care. The national average is about 3.5 hrs; below 3.0 is a red flag.Click the rank badge to see the full State ranking.Click here to see the full State ranking.
This facility Pennsylvania avg (4h 35m per day)
vs Pennsylvania avg
-6%

2 of 6 metrics below state avg

Standout metric Weekend RN is +68% above state avg
Staff typeHours / Day / Residentvs state avg
Registered Nurse (RN) Info RNs hold the highest nursing license and can assess residents, interpret test results, and direct care plans. More RN hours per day often signals stronger clinical oversight and faster response to health changes. 1h 14m per day ▲ 58% State avg: 47m per day · National avg: 41m per day
LPN / LVN Info Licensed Practical Nurses (LPNs) or Licensed Vocational Nurses (LVNs) deliver routine hands-on care — medication administration, wound dressing, and monitoring vital signs. They work under RN supervision and make up a large share of daily bedside care. 23m per day ▼ 59% State avg: 55m per day · National avg: 52m per day
Nurse Aide Info Certified Nurse Aides (CNAs) provide the most direct day-to-day assistance: bathing, dressing, feeding, and mobility. Nurse aide hours are typically the largest staffing category and directly affect residents' quality of life. 2h 26m per day ▲ 11% State avg: 2h 12m per day · National avg: 2h 21m per day
Weekend Total Nursing Info Combined nursing hours (RN + LPN + Nurse Aide) per resident per day on weekends. Staffing often drops on weekends — this figure reveals whether the facility maintains adequate coverage outside of weekday hours. 3h 29m per day ■ Avg State avg: 3h 31m per day · National avg: 3h 26m per day
Physical Therapist Info Hours per resident per day provided by licensed Physical Therapists (PTs) or PT Assistants. PT services help residents recover mobility after injury or illness and are especially important for post-acute (short-stay) rehabilitation. 3m per day ▼ 50% State avg: 6m per day · National avg: 4m per day
Weekend RN Info Registered nurse hours specifically on weekends. Facilities sometimes reduce RN presence on Saturdays and Sundays — a low weekend RN figure compared to weekday hours can indicate reduced clinical oversight when most administrative staff are absent. 55m per day ▲ 68% State avg: 33m per day · National avg: 29m per day

Capacity and availability

Avg. Length of Stay
156 days
Bed community size
78-bed community Rank #315 / 555Bed count — State benchmarkedThis home is ranked 315th out of 555 homes in Pennsylvania for bed count. Shows this facility's certified or reported bed count compared to other Pennsylvania SNFs. Larger communities may offer more amenities, programs, and on-site services for residents and families.Click the rank badge to see the full State ranking.Click here to see the full State ranking.
A larger shared setting that may offer more common spaces and organized community services.
Years in operation
37 years in operation
A longer operating history, which may indicate experience navigating regulations and delivering ongoing care.
Walk Score
Walk Score: 93 / 100 Rank #18 / 668Walk Score — State benchmarkedThis home is ranked 18th out of 668 homes in Pennsylvania for walk score. Shows how walkable this facility's neighborhood is compared to the average Walk Score across Pennsylvania SNFs. Higher scores benefit residents, families, and staff.Click the rank badge to see the full State ranking.Click here to see the full State ranking.
Walker's paradise. Daily errands do not require a car, with many shops and services nearby.
BBB Rating
BBB Rating: A+ (Not Accredited)
An independent rating from the Better Business Bureau based on factors such as complaint history, transparency, and business practices.
How BBB ratings work

About this community

Awards

AwardsCanada’s Best 2026

License Details

Facility TypePersonal Care Homes
StatusLicensed
IssuanceJune 17, 2025
ExpirationJune 17, 2026
CountyAllegheny
License LevelFULL
License Number429490
CMS Certification Number395146
CertificationsCanada’s Best Managed Companies

Ownership & Operating Entity

Canterbury Place is legally operated by Canterbury Place.

Profit StatusNon-Profit

Safety & Compliance

Secured Perimeter
Emergency SystemsYes
Safety FeaturesEmergency Response System, 24/7 Emergency response system

Staffing

Key information about the people who lead and staff this community.

Leadership

ContactMs. Cristy Paranay, Administrative Assistant

State Inspection Report (PA)

October 2, 2025
16 Total Daily Staff PA avg: 76.9 Rank #355 / 361 Total Daily Staff — State benchmarked This home is ranked 355th out of 361 homes in Pennsylvania. Shows this facility's total daily staff compared to the Pennsylvania average among 361 comparable communities in the ranking pool.
12 Waking Staff
0 Resident Support Staff
11 Residents Served
7 Current Residents

Resident Conditions (PA)

Age 60+ 11 (100%)
Mobility Need 5 (45%)

Additional Policies & Features

Pets Allowed
HousekeepingYes
Linen ServiceYes

Amenities & Lifestyle

Library
Spa
Dining Room
Bistro
Billiards
Transportation
Housekeeping
Laundry
Private Dining
Wellness Checks
Personal Care
ActivitiesThe activity schedule includes excursions, guest speakers, live entertainment, and various fitness classes, with activities selected by the residents.
Branded ProgramsLiving, Loving, Local food program
Wellness ProgramEnjoy the freedom of Independent Living with the option to access personalized support as needed. You’ll enjoy an active lifestyle with amenities, activities, and wellness programs, while having assistance with daily tasks or medication management available when required.
Specific ProgramsIndependent Supportive Living, Respite Stays, fitness classes including Walk Fit, Drum Fit, Go4Life, Dance classes, and Yoga, Meet Me at the MoMA, Artful Enrichment Program, Java Music Club, Java Memory Club, and Fit Minds
Religious ServicesYes

Dining & Nutrition

Food DescriptionThe dining program includes chef-prepared meals made with fresh local ingredients, featuring a variety of options such as continental breakfast, daily specials, and dietary accommodations.

Contact Canterbury Place

Inspection History

In Pennsylvania, the Department of Human Services (for assisted living facilities) and the Department of Health (for nursing homes) conduct unannounced inspections to verify adherence to state regulations.

Since 2021 · 5 years of data 19 citations 2 complaints 6 inspections 3 waivers
Inspection Score Info A composite 0–100 score combining this facility's inspections, citations, complaints, and enforcement actions relative to the Pennsylvania state average. The score below shows how many points this facility sits above or below the typical Pennsylvania nursing home score (the benchmark); higher is better.

3 points above the Pennsylvania average for nursing homes (83/100)

Inspection score: 86 out of 100. Letter grade B. 3 points above the Pennsylvania average for nursing homes (83/100)

Inspection Scorecard Info This scorecard compares key inspection, citation, and complaint metrics at this facility against the Pennsylvania state average. Metrics rated ≥15% worse than average are highlighted in red; those ≥15% better are highlighted in green.

Since 2021 vs. Pennsylvania state average
Overall vs. PA average 0 Worse No metrics in this bucket. 8 Better Metrics better than Pennsylvania average:
• Total citations (70% below)
• Citations per year (70% below)
• Citations per inspection (44% below)
• Total inspections (45% below)
• Inspections with citations (50% below)
• Inspection citation rate (8% below)
• Total complaints (50% below)
• Complaints per year (50% below)
Latest Inspection November 18, 2025 Other An inspection that falls outside standard annual surveys and formal complaint investigations. May include administrative compliance checks, documentation reviews, focused surveys on specific concerns, or revisit surveys to verify prior corrections.

Citations Info Citations are formal regulatory issues recorded during state inspections.

This FacilityPA Averagevs. PA Avg
Total citations Info Formal regulatory issues recorded by inspectors across all inspection types. 1963 This facility has 70% fewer total citations than a typical Pennsylvania nursing home (19 vs. PA avg 63).↓ 70% better Rank #111 / 482 Total citations — State benchmarked This home is ranked 111th out of 482 homes in Pennsylvania. Shows this facility's total citations compared to the Pennsylvania average among 482 comparable communities in the ranking pool.
Citations per year Info Average citations per year since 2021. 3.812.6 This facility has 70% fewer citations per year than a typical Pennsylvania nursing home (3.8 vs. PA avg 12.6).↓ 70% better
Citations per inspection Info Average citations per inspection. 3.25.7 This facility has 44% fewer citations per inspection than a typical Pennsylvania nursing home (3.2 vs. PA avg 5.7).↓ 44% better Rank #197 / 482 Citations per inspection — State benchmarked This home is ranked 197th out of 482 homes in Pennsylvania. Shows this facility's citations per inspection compared to the Pennsylvania average among 482 comparable communities in the ranking pool.

Inspections Info State inspections evaluate whether the facility meets health and safety standards.

This FacilityPA Averagevs. PA Avg
Total inspections Info Combined count of all routine and focused inspections. Excludes complaint investigations. 611 This facility has 45% fewer total inspections than a typical Pennsylvania nursing home (6 vs. PA avg 11).↓ 45% better
Inspections with citations Info Inspections that resulted in at least one regulatory citation. 48 This facility has 50% fewer inspections with citations than a typical Pennsylvania nursing home (4 vs. PA avg 8).↓ 50% better
Inspection citation rate Info Percentage of inspections that resulted in at least one citation. 67%73% This facility has 6 percentage points lower inspection citation rate than a typical Pennsylvania nursing home (67% vs. PA avg 73%).↓ 6% better Rank #223 / 482 Inspection citation rate — State benchmarked This home is ranked 223rd out of 482 homes in Pennsylvania. Shows this facility's % of inspections with citations compared to the Pennsylvania average among 482 comparable communities in the ranking pool.

Complaints & Investigations Info Complaints are formal concerns filed by residents, families, or staff. Investigations are on-site follow-ups.

This FacilityPA Averagevs. PA Avg
Total complaints Info Formal expressions of concern made by residents, families, or staff. 24 This facility has 50% fewer total complaints than a typical Pennsylvania nursing home (2 vs. PA avg 4).↓ 50% better Rank #186 / 482 Total complaints — State benchmarked This home is ranked 186th out of 482 homes in Pennsylvania. Shows this facility's complaint inspections compared to the Pennsylvania average among 482 comparable communities in the ranking pool.
Complaints per year Info Average complaints per year since 2021. 0.40.8 This facility has 50% fewer complaints per year than a typical Pennsylvania nursing home (0.4 vs. PA avg 0.8).↓ 50% better

Inspection Reports Summary Info An editor-reviewed summary of the themes and findings across this facility's recent inspection reports.

  • November 18, 2025 inspection found inaccurate transcription of physician orders for two residents, causing incorrect medication dosages and potential harm.
  • June 3, 2025 complaint investigation substantiated mental abuse via social media and failure to follow Bipap orders, resulting in actual harm and ICU admission.
  • October 2, 2025 renewal inspection cited seven deficiencies including food storage, medication availability, and incomplete resident assessments, with plans of correction accepted and ongoing audits.

Health Inspection History

Inspections since 2023
Total health inspections 8

Pennsylvania average 6.7


Last Health inspection on Jul 2025

Total health citations
28 Rank #131 / 203Health citations — State benchmarkedThis home is ranked 131st out of 203 homes in Pennsylvania for health citations. Shows this facility's total health deficiency citations benchmarked to the Pennsylvania State average, with a ranking across all 203 PA SNFs. Lower citation counts earn a better rank.Click the rank badge to see the full State ranking.Click here to see the full State ranking.

Pennsylvania average 31.3

Citations per inspection
3.5 Rank #93 / 203Citations per inspection — State benchmarkedThis home is ranked 93rd out of 203 homes in Pennsylvania for citations per inspection. Shows average deficiency citations per CMS inspection for this facility versus the Pennsylvania mean across 203 SNFs with citation data. Lower is better.Click the rank badge to see the full State ranking.Click here to see the full State ranking.

Pennsylvania average 4.4


Health citations are formal notices following inspections when they fail to comply with safety and care standards.

21 of 28 citations resulted from standard inspections; 6 of 28 resulted from complaint investigations; and 1 of 28 came from combined inspections (standard and complaint).

Breakdown of citation severity (last 3 years)
Critical health citations
0
100% better than Pennsylvania average

Pennsylvania average: 0.3


Serious health citations
1
67% worse than Pennsylvania average

Pennsylvania average: 0.6

0 critical citations Pennsylvania average: 0.3

1 serious citation Pennsylvania average: 0.6

26 moderate citations Pennsylvania average: 29.5

1 minor citation Pennsylvania average: 0.8
Citations history (last 3 years)
Quality of Care moderate citation Jul 22, 2025
Corrected

Abuse/Neglect moderate citation Jun 03, 2025
Corrected

Quality of Care serious citation Jun 03, 2025
Corrected

Quality of Care moderate citation Apr 30, 2025
Corrected

Staffing Data

Reporting period: October 1 – December 31, 2025 (Q4 2025). Source: CMS Payroll-Based Journal report.

Total staff 137
Employees 117
Contractors 20
Staff to resident ratio 1.23 : 1
33% fewer staff per resident than Pennsylvania average
Pennsylvania average ratio: 1.83 : 1 Pennsylvania average ratio: 1.83 : 1See full Pennsylvania ranking
Avg staff/day 63
Average shift 8.4 hours
8% better than Pennsylvania average
Pennsylvania average: 7.8 hours Pennsylvania average shift: 7.8 hoursSee full Pennsylvania ranking
Total staff hours (quarter) 48,720

Nursing staff breakdown

Q4 2025 · Oct 1 – Dec 31 More info This data comes from the CMS Payroll-Based Journal report covering October 1 – December 31, 2025.
Registered Nurse

Manages medical care and health needs.

RN Staff Info 25 total: 24 full-time employees and 1 contractor. 25
Average shift length Info Average shift length. Calculated as total hours divided by days worked and average staff per day. 9.1 hours
Licensed Practical Nurse

Assists with medical care and medications.

LPN Staff Info All 7 LPN Staff are full-time employees. No contractors work on this role. 7
Average shift length Info Average shift length. Calculated as total hours divided by days worked and average staff per day. 9.1 hours
Certified Nursing Assistant

Helps with daily care and mobility.

CNA Staff Info All 62 CNA Staff are full-time employees. No contractors work on this role. 62
Average shift length Info Average shift length. Calculated as total hours divided by days worked and average staff per day. 8.6 hours

Contractor staffing

Q4 2025 · Oct 1 – Dec 31 More info This data comes from the CMS Payroll-Based Journal report covering October 1 – December 31, 2025.

Total hours from contractors

8.3%

4,022 contractor hours this quarter

Respiratory Therapy Technician: 3 Occupational Therapy Assistant: 3 Physical Therapy Assistant: 3 Qualified Social Worker: 2 Speech Language Pathologist: 2 Physical Therapy Aide: 2 Feeding Assistant: 2 Registered Nurse: 1 Nurse Aide in Training: 1 Medical Director: 1

Staff by category

Q4 2025 · Oct 1 – Dec 31 More info This data comes from the CMS Payroll-Based Journal report covering October 1 – December 31, 2025.
Certified Nursing Assistant6206224,52192100%8.6
Registered Nurse241259,58692100%9.1
Licensed Practical Nurse7073,88292100%9.1
Clinical Nurse Specialist8082,6706672%7.9
Other Dietary Services Staff5051,9588896%7.7
Mental Health Service Worker2028246470%8
Speech Language Pathologist0226396571%6.7
Feeding Assistant0226046368%8.7
Nurse Aide in Training5165375863%7.3
Respiratory Therapy Technician0335177177%7.2
Physical Therapy Assistant0335166874%7.2
Qualified Social Worker0225036672%7.6
Nurse Practitioner1014796166%7.8
Administrator2024725661%8
Dietitian1014545863%7.8
Physical Therapy Aide0223745964%6
Occupational Therapy Assistant0331251415%7.8
Medical Director011602022%3
62 Certified Nursing Assistant
% of Days 100%
25 Registered Nurse
% of Days 100%
7 Licensed Practical Nurse
% of Days 100%
8 Clinical Nurse Specialist
% of Days 72%
5 Other Dietary Services Staff
% of Days 96%
2 Mental Health Service Worker
% of Days 70%
2 Speech Language Pathologist
% of Days 71%
2 Feeding Assistant
% of Days 68%
6 Nurse Aide in Training
% of Days 63%
3 Respiratory Therapy Technician
% of Days 77%
3 Physical Therapy Assistant
% of Days 74%
2 Qualified Social Worker
% of Days 72%
1 Nurse Practitioner
% of Days 66%
2 Administrator
% of Days 61%
1 Dietitian
% of Days 63%
2 Physical Therapy Aide
% of Days 64%
3 Occupational Therapy Assistant
% of Days 15%
1 Medical Director
% of Days 22%

Penalties and fines

Federal penalties imposed by CMS for regulatory violations, including civil money penalties (fines) and denials of payment for new Medicare/Medicaid admissions.

Source: CMS Penalties Database

No penalties in the past 3 years

No civil money penalties or payment denials were reported in the last 3 years.

Quality of care over time

These measures show how residents usually do over time at this home, based on health outcomes and preventive care.

High-risk clinical events score Info A composite score based on pressure ulcers, falls with injury, weight loss, walking ability decline, and activities of daily living decline. 22.2
102% worse than Pennsylvania average

Pennsylvania average: 11.0

Functional decline score Info A composite score based on activities of daily living decline, walking ability decline, and incontinence. 37.5
69% worse than Pennsylvania average

Pennsylvania average: 22.2

Long-stay resident measures
Significantly below average Pennsylvania avg: 3.7 Info CMS star rating based on long-stay quality measure performance. 5 stars = significantly above average, 1 star = significantly below average.
Need for Help with Daily Activities Increased Info Percent of long-stay residents whose need for help with daily activities has increased 36.6%
93% worse than Pennsylvania average

Pennsylvania average: 19.0%

Walking Ability Worsened Info Percent of long-stay residents whose ability to move independently worsened 46.1%
118% worse than Pennsylvania average

Pennsylvania average: 21.1%

Low Risk Residents with Bowel/Bladder Incontinence Info Percent of low risk long-stay residents who lose control of their bowels or bladder 29.8%
12% worse than Pennsylvania average

Pennsylvania average: 26.7%

Falls with Major Injury Info Percent of long-stay residents experiencing one or more falls with major injury 7.3%
128% worse than Pennsylvania average

Pennsylvania average: 3.2%

High Risk Residents with Pressure Ulcers Info Percent of long-stay high risk residents with pressure ulcers 10.8%
96% worse than Pennsylvania average

Pennsylvania average: 5.5%

Urinary Tract Infection Info Percent of long-stay residents with a urinary tract infection 1.6%
7% better than Pennsylvania average

Pennsylvania average: 1.8%

Lost Too Much Weight Info Percent of long-stay residents who lose too much weight 10.1%
52% worse than Pennsylvania average

Pennsylvania average: 6.6%

Depressive Symptoms Info Percent of long-stay residents who have depressive symptoms 7.5%
35% worse than Pennsylvania average

Pennsylvania average: 5.5%

Antipsychotic Use Info Percent of long-stay residents who received an antipsychotic medication 23.3%
36% worse than Pennsylvania average

Pennsylvania average: 17.1%

Pneumococcal Vaccine Info Percent of long-stay residents assessed and appropriately given the pneumococcal vaccine 70.2%
19% worse than Pennsylvania average

Pennsylvania average: 86.9%

Influenza Vaccine Info Percent of long-stay residents assessed and appropriately given the seasonal influenza vaccine 98.0%
5% better than Pennsylvania average

Pennsylvania average: 93.5%

Hospitalizations per 1,000 days Info Number of hospitalizations per 1,000 long-stay resident days. 1.80
7% worse than Pennsylvania average

Pennsylvania average: 1.68

ED visits per 1,000 days Info Number of outpatient emergency department visits per 1,000 long-stay resident days. 1.65
38% worse than Pennsylvania average

Pennsylvania average: 1.20

Short-stay resident measures
Below average Pennsylvania avg: 3.2 Info CMS star rating based on short-stay quality measure performance. 5 stars = much above average, 1 star = much below average.
Pneumococcal Vaccine Info Percent of short-stay residents assessed and appropriately given the pneumococcal vaccine 68.0%
In line with Pennsylvania average

Pennsylvania average: 68.8%

Antipsychotic medication increase Info Percent of short-stay residents who newly received an antipsychotic medication 2.5%
59% worse than Pennsylvania average

Pennsylvania average: 1.5%

Influenza Vaccine Info Percent of short-stay residents assessed and appropriately given the seasonal influenza vaccine 78.7%
15% better than Pennsylvania average

Pennsylvania average: 68.7%

Re-hospitalized after SNF stay Info Percentage of short-stay residents who were re-hospitalized after their nursing home admission. 24.4%
6% worse than Pennsylvania average

Pennsylvania average: 23.1%

Emergency department visits Info Percentage of short-stay residents who had an outpatient emergency department visit. 6.6%
33% better than Pennsylvania average

Pennsylvania average: 9.8%

Falls with major injury Info Percentage of SNF residents who experience falls with major injury during their stay. 0.0%
100% better than Pennsylvania average

Pennsylvania average: 0.8%

Ability to care for self at discharge Info Percentage of residents at or above expected ability to care for themselves at discharge. 32.6%
39% worse than Pennsylvania average

Pennsylvania average: 53.7%

Successful return to home or community Info Rate of successful return to home or community from a skilled nursing facility. 45.0%
11% worse than Pennsylvania average

Pennsylvania average: 50.6%

Breakdown by payment type

Medicare

16% of new residents, usually for short-term rehab.

Typical stay 22 days

Private pay

81% of new residents, often for short stays.

Typical stay 1 - 2 months

Medicaid

2% of new residents, often for long-term daily care.

Typical stay 14 years

Facility Characteristics

Source: CMS Long-Term Care Facility Characteristics (Data as of Jan 2026)

Total residents 111
Medicare
5
4.5% of residents
Medicaid
63
56.8% of residents
Private pay or other
43
38.7% of residents
Programs & Services
Residents Group

Residents meet regularly to discuss policies, care quality, and activities

Nurse Aide Training

State-approved Nurse Aide Training and Competency Evaluation Program on-site

Active Resident Council

Organized group of residents that meets regularly to discuss facility policies, quality of life, and activities.

Finances and operations

Governmental community
Operated by a subsidized facility district.
Home revenue
$22.4M
Operating deficit
-$5.7M
Governmental community Operated by a subsidized facility district.
Home revenue
$22.4M Rank #108 / 205Revenue — State benchmarkedThis home is ranked 108th out of 205 homes in Pennsylvania for revenue. Shows this facility's annual revenue compared to the Pennsylvania SNF average. Higher revenue generally means more resources for staffing and capital — read alongside Payroll %.Click the rank badge to see the full State ranking.Click here to see the full State ranking.
Operating deficit
-$5.7M
Payroll costs Info The portion of the home's budget spent on staff, including nurses, caregivers, and other employees who support care and operations. Rank #59 / 205Payroll — State benchmarkedThis home is ranked 59th out of 205 homes in Pennsylvania for payroll. Shows total annual staff payroll benchmarked to the Pennsylvania average. Higher payroll investment relative to peers often signals better staffing and less reliance on cheaper contract labor.Click the rank badge to see the full State ranking.Click here to see the full State ranking.
$14.0M
62.5% of revenue Rank #16 / 205Payroll % — State benchmarkedThis home is ranked 16th out of 205 homes in Pennsylvania for payroll %. Shows payroll as a percentage of revenue versus the Pennsylvania average. Well-run Pennsylvania SNFs typically land around 53–61% — the top third Statewide. Below 25% may signal understaffing or heavy agency use — read with Staffing ratings.Click the rank badge to see the full State ranking.Click here to see the full State ranking.
Other operating costs Info All remaining costs needed to run the home, such as food, utilities, building maintenance, supplies and administrative expenses.
$14.1M
Total costs $28.1M

Who this home usually serves

TYPE OF STAY

Primarily short stays

Residents typically stay for brief periods, with frequent admissions and discharges throughout the year.

Places of interest near Canterbury Place

Address 2.8 miles from city center Info Estimated distance in miles from Pittsburgh's city center to Canterbury Place's address, calculated via Google Maps. — 0.17 miles to nearest hospital (Pediatric Child Advocacy Center at UPMC Children's Hospital of Pittsburgh)

Calculate Travel Distance to Canterbury Place

Add your location

Address

Financial Assistance for
Nursing Home in Pennsylvania

Canterbury Place is located in Pittsburgh, Pennsylvania.
Here are the financial assistance programs available to residents in Pennsylvania.

Get Financial aid guidance

Community HealthChoices (CHC)

PA Medicaid CHC

Age 65+ or disabled
General Pennsylvania resident, Medicaid-eligible, nursing home-level care need.
Income Limits (2025) ~$2,829/month 300% FBR, individual
Asset Limits $2,000 (individual), $3,000 (couple) (excludes home, car).
PA

Managed care model; high urban demand (e.g., Philadelphia, Pittsburgh).

Benefits
Personal care (5-7 hours/day, e.g., bathing, dressing) Respite care (up to 240 hours/year) Adult day care ($70/day) Home modifications ($1,500 avg.)

Pennsylvania OPTIONS Program

PA OPTIONS

Age 60+
General Pennsylvania resident, at risk of nursing home placement.
Income Limits ~$2,000/month individual, varies by region
Asset Limits $8,000 individual
PA

Cost-sharing required above certain income; rural/urban balance.

Benefits
In-home care (3-5 hours/week) Respite (up to 10 days/year) Adult day care (~$70/day) Transportation (~5 trips/month)

Living Independence for the Elderly (LIFE)

Pennsylvania LIFE (PACE)

Age 55+
General PA resident (specific counties), NFLOC, safe with LIFE support.
Income Limits (2025) ~$2,829/month (Medicaid-eligible); private pay option available.
Asset Limits $2,000 (individual), $3,000 (couple) for Medicaid enrollees.
PA

16 providers in 25 counties (e.g., Allegheny, Luzerne); LIFE branding unique to PA.

Benefits
Personal care (5-7 hours/day) Medical care Meals Transportation Respite Therapies

Medicare Savings Program (MSP)

Pennsylvania Medicare Savings Program

Age 65+ or disabled
General PA resident, Medicare Part A/B.
Income Limits (2025) ~$2,510/month (QMB), ~$3,380/month (SLMB), ~$3,598/month (QI)—individual.
Asset Limits $9,430 (individual), $14,130 (couple).
PA

Three tiers; includes Extra Help for Part D; no waitlist.

Benefits
Covers Part B premiums ($174.70/month) Deductibles ($240/year) Copays (~20%)

Family Caregiver Support Program (FCSP)

Pennsylvania Family Caregiver Support Program

Age
General Caregivers of 60+ needing care or 55+ caregivers of others; PA resident; functional needs (2+ ADLs).
Income Limits (2025) No strict cap; reimbursements up to $600/month if care recipient income < ~$2,322/month 185% FPL
Asset Limits Not assessed; need-based.
PA

High demand; includes grandparent caregivers.

Benefits
Respite (4-6 hours/week or 5 days/year) Adult day care ($60/day) Supplies (~$2,000/year) Caregiver training

VA Aid and Attendance (A&A) and Housebound Benefits

Pennsylvania VA Aid and Attendance/Housebound

Age 65+ or disabled veteran/spouse
General PA resident, wartime service, need for ADL help (A&A) or homebound.
Income Limits (2025) Net income < ~$1,984/month (veteran with dependent, A&A); pension offsets income.
Asset Limits ~$155,356 net worth limit
PA

High veteran population; supports rural/urban care needs.

Benefits
Cash (~$1,433-$2,642/month veteran, ~$951-$1,318 spouse) for care costs (e.g., in-home, assisted living)

Property Tax/Rent Rebate Program (PTRR)

Pennsylvania Property Tax/Rent Rebate Program

Age 65+
General PA resident, homeowner/renter (or widow/er 50+, disabled 18+).
Income Limits (2025) ~$45,000/year individual or couple, excludes half of Social Security
Asset Limits Not assessed; income-focused.
PA

Rebates up to $1,000; ~600,000 eligible annually.

Benefits
Rebates ($250-$1,000 based on income; e.g., $1,000 if income < $8,000)

Senior Farmers’ Market Nutrition Program (SFMNP)

Pennsylvania SFMNP

Age 60+
General PA resident, low-income.
Income Limits (2025) ~$2,322/month individual, 185% FPL
Asset Limits Not assessed.
PA

Vouchers (~$50/season) via 52 AAAs; serves ~200,000 annually.

Benefits
Vouchers (~$50/season) for fresh produce at approved markets

Compare Nursing Home around Pittsburgh

The information below is reported by the Pennsylvania Department of Human Services and Department of Health.

5 facilities compared · CMS & PA Dept. of Health data

Filter by care type
Vincentian Home
NH

Nursing Home Licensed facility providing 24/7 skilled nursing care for residents with complex, ongoing medical needs. Staffed by RNs, LPNs, and CNAs. Inspected and star-rated annually by CMS. Accepts Medicare (short-term rehab) and Medicaid (long-term care).

AL

Assisted Living A licensed, long-term care setting for seniors or individuals with disabilities who need help with daily activities — like bathing, dressing, and medication management — but not 24-hour skilled nursing. Offers housing, meals, and around-the-clock support while aiming to maximize resident independence.

Pittsburgh
90
Facility 90
PA AVG 95
Rank #254 / 555
57.8% -27%4.64 +83%+12%$0354.4-52A
20
Facility 20
PA AVG 46
Rank #533 / 668
Vincentian Collaborative System$39.6M$18.3M46.4%395034
Asbury Heights
NH

Nursing Home Licensed facility providing 24/7 skilled nursing care for residents with complex, ongoing medical needs. Staffed by RNs, LPNs, and CNAs. Inspected and star-rated annually by CMS. Accepts Medicare (short-term rehab) and Medicaid (long-term care).

AL

Assisted Living A licensed, long-term care setting for seniors or individuals with disabilities who need help with daily activities — like bathing, dressing, and medication management — but not 24-hour skilled nursing. Offers housing, meals, and around-the-clock support while aiming to maximize resident independence.

Pittsburgh
120
Facility 120
PA AVG 95
Rank #129 / 555
36.7% -53%4.34 +58%+5%$0233.8-44-
47
Facility 47
PA AVG 46
Rank #320 / 668
Asbury Senior Care LLC$26.8M$16.0M59.8%395391
Reformed Presbyterian Home
NH

Nursing Home Licensed facility providing 24/7 skilled nursing care for residents with complex, ongoing medical needs. Staffed by RNs, LPNs, and CNAs. Inspected and star-rated annually by CMS. Accepts Medicare (short-term rehab) and Medicaid (long-term care).

AL

Assisted Living A licensed, long-term care setting for seniors or individuals with disabilities who need help with daily activities — like bathing, dressing, and medication management — but not 24-hour skilled nursing. Offers housing, meals, and around-the-clock support while aiming to maximize resident independence.

Pittsburgh (Perry South)
56
Facility 56
PA AVG 95
Rank #424 / 555
42.9% -45%4.80 +151%+16%$0317.8-24A+
50
Facility 50
PA AVG 46
Rank #283 / 668
Lorrie Meneely$10.3M$5.5M53%395561
The Haven at North Hills Senior Residence
NH

Nursing Home Licensed facility providing 24/7 skilled nursing care for residents with complex, ongoing medical needs. Staffed by RNs, LPNs, and CNAs. Inspected and star-rated annually by CMS. Accepts Medicare (short-term rehab) and Medicaid (long-term care).

AL

Assisted Living A licensed, long-term care setting for seniors or individuals with disabilities who need help with daily activities — like bathing, dressing, and medication management — but not 24-hour skilled nursing. Offers housing, meals, and around-the-clock support while aiming to maximize resident independence.

Pittsburgh (Ivory Avenue)
90
Facility 90
PA AVG 95
Rank #254 / 555
60.0% -24%4.66 -13%+12%$0335.5-54A+
34
Facility 34
PA AVG 46
Rank #426 / 668
The Haven At North Hills LLC$5.9M$3.0M50.6%395903
Canterbury Place
NH

Nursing Home Licensed facility providing 24/7 skilled nursing care for residents with complex, ongoing medical needs. Staffed by RNs, LPNs, and CNAs. Inspected and star-rated annually by CMS. Accepts Medicare (short-term rehab) and Medicaid (long-term care).

AL

Assisted Living A licensed, long-term care setting for seniors or individuals with disabilities who need help with daily activities — like bathing, dressing, and medication management — but not 24-hour skilled nursing. Offers housing, meals, and around-the-clock support while aiming to maximize resident independence.

Pittsburgh (Central Lawrenceville)
78
Facility 78
PA AVG 95
Rank #315 / 555
--4.32 +52%+4%$0283.5111A+
93
Facility 93
PA AVG 46
Rank #18 / 668
Upmc$22.4M$14.0M62.5%395146

Frequently Asked Questions about Canterbury Place

What neighborhood is Canterbury Place in?

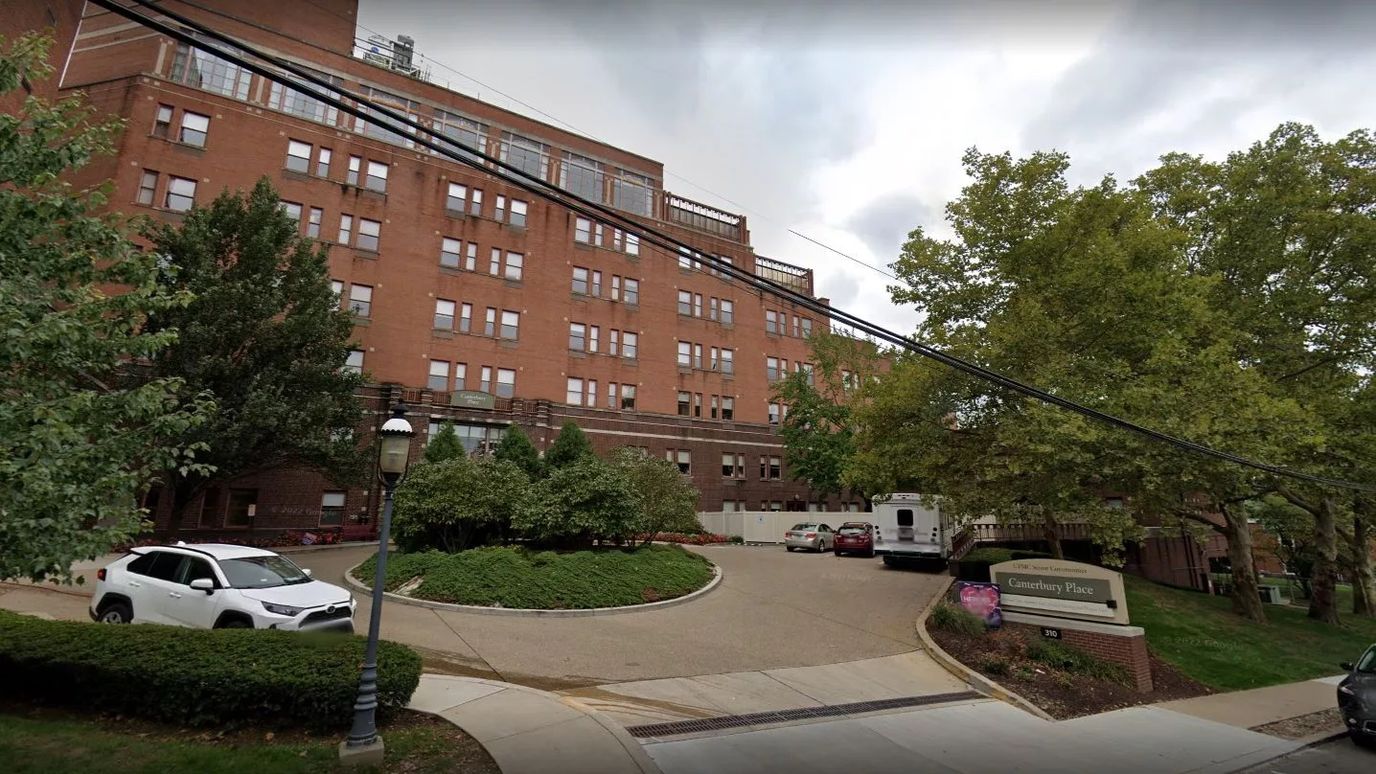
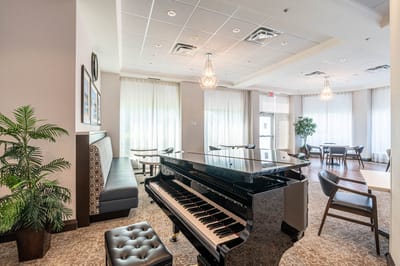
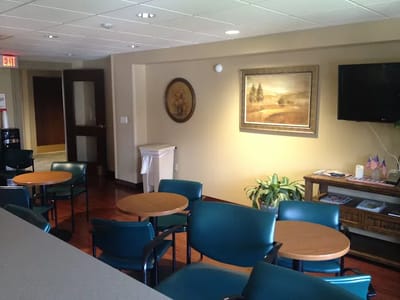
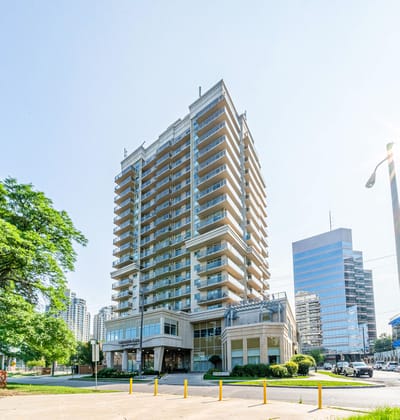
Canterbury Place is in the Central Lawrenceville neighborhood of Pittsburgh.

Is Canterbury Place in a walkable area?

Canterbury Place has a walk score of 93. Walker's paradise. Daily errands do not require a car, with many shops and services nearby.

What is the license number of Canterbury Place?

According to PA state health department records, Canterbury Place's license number is 429490.

When does Canterbury Place's license expire?

According to PA state health department records, Canterbury Place's license expires on June 17, 2026.

What is the occupancy rate at Canterbury Place?

Canterbury Place's occupancy is 89.5%.

Does Canterbury Place operate as a for-profit or non-profit?

Canterbury Place is registered as a non-profit in PA.

How many beds does Canterbury Place have?

Canterbury Place has 78 beds.

Guides for Better Senior Living

Care Cost Calculator: See Prices in Your Area

Nursing Home Data Explorer

Don’t Wait Too Long: 7 Red Flag Signs Your Parent Needs Assisted Living Now

The True Cost of Assisted Living in 2025 – And How Families Are Paying For It

Understanding Senior Living Costs: Pricing Models, Discounts & Financial Assistance

Explore Open Rooms
1 Contact details
2 What type of senior care service are you looking for?
3 What budget do you have in mind for senior care?
4 How soon do you need to find care?
5 Additional details

Thank you for your interest!

Our team will be in touch shortly to help with next steps.