Little Sisters of the Poor
Nursing Home & Independent Living · Pittsburgh, PA
CMS overall rating Info CMS (the Centers for Medicare & Medicaid Services) is the federal agency that rates nursing home quality. Its Overall Rating runs from 1 to 5 stars, combining health inspections, staffing, and quality measures, with inspections weighted most heavily.

Little Sisters of the Poor

Nursing Home & Independent Living · Pittsburgh, PA
CMS overall rating Info CMS (the Centers for Medicare & Medicaid Services) is the federal agency that rates nursing home quality. Its Overall Rating runs from 1 to 5 stars, combining health inspections, staffing, and quality measures, with inspections weighted most heavily.

Overview of Little Sisters of the Poor

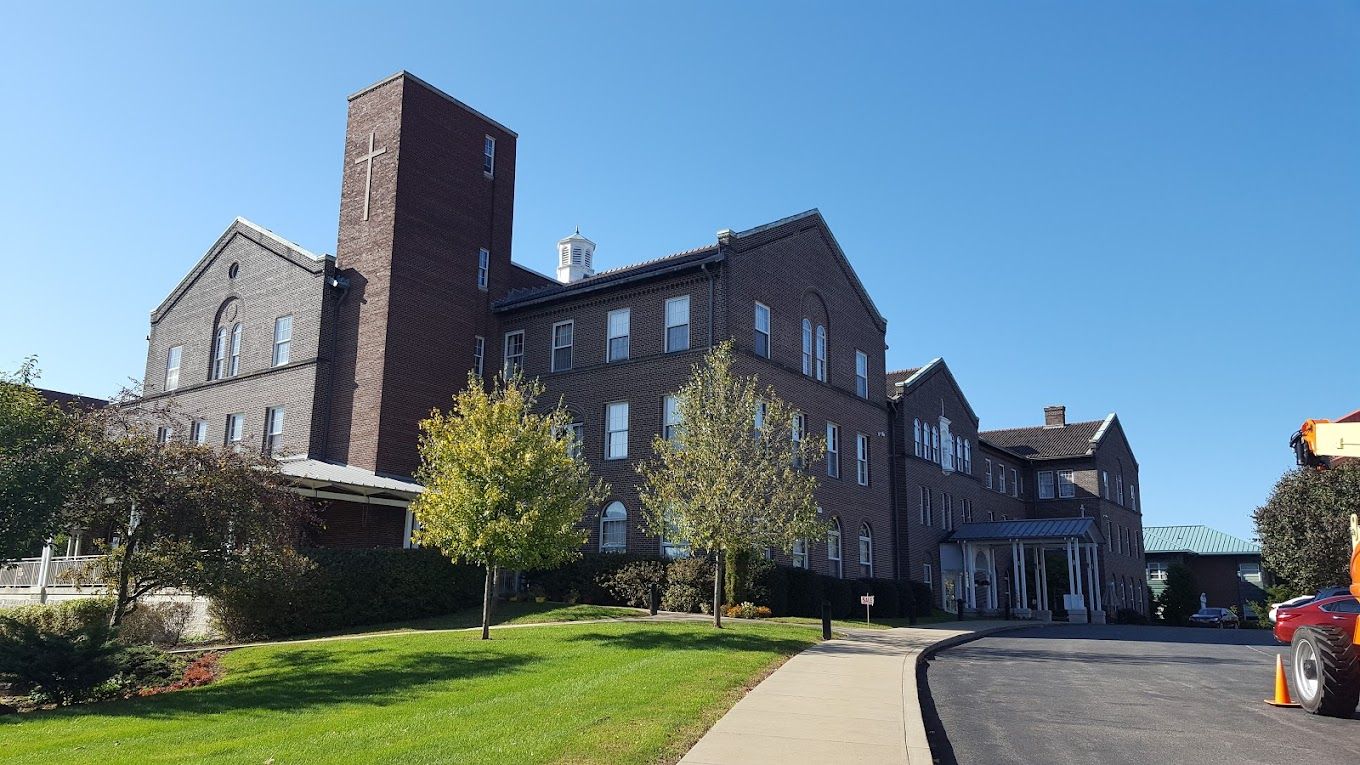
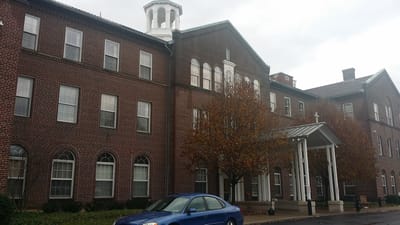
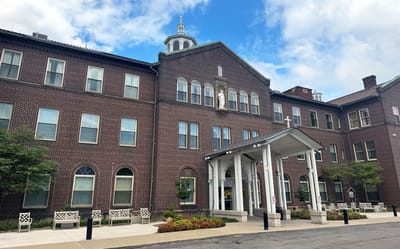
Little Sisters of the Poor occupies a three-story building at 1028 Benton Ave in Pittsburgh’s Brighton Heights neighborhood. It offers nursing home and independent living on the same campus, with 48 beds and 40 residents currently in place, for an occupancy rate of 58.3%. The Walk Score of 46 reflects a neighborhood where most errands still call for a car.

The staffing profile is the most concrete thing the data shows. Total nursing coverage runs 6 hours 43 minutes per resident per day. Registered nurses account for 1 hour 34 minutes of that. Nurse aides carry 3 hours 51 minutes, which is a meaningful daily allocation of direct, hands-on care time.

An Active Resident Council meets regularly, giving residents a structured forum to address care quality, facility policies, and day-to-day concerns. On the coverage side, the facility is CMS-certified and accepts both Medicare and Medicaid.

The picture here is a small, Medicaid-accessible nursing community with a staffing mix that leans heavily toward direct aide care and meaningful RN presence. Families looking for a Pittsburgh facility that accepts federal coverage and keeps its care model oriented toward hands-on daily support will find the basics in place here.

Quality ratings

Measured by Centers for Medicare & Medicaid Services (CMS)

Overall rating Info The Overall CMS Rating combines results from health inspections, staffing levels and quality measures. Health inspections carry the most weight. Staffing and quality scores can increase or decrease the final rating based on performance compared to state and national standards.
▼ 66.6% Below PA avg. ▼ 66.6% Below PA avg.PA average: 3.0Click the badge to see the full State ranking.Click here to see the full State ranking.
Health Inspection Info Based on the results of the facility's three most recent standard inspections and any complaint investigations. CMS reviews the number, scope, and severity of deficiencies, with more recent findings weighted more heavily.
▼ 64.3% Below PA avg. ▼ 64.3% Below PA avg.PA average: 2.8Click the badge to see the full State ranking.Click here to see the full State ranking.
Staffing Info Measures average nursing staff hours per resident per day, including Registered Nurses (RNs) and total nursing staff. Ratings are adjusted based on the level of care residents require and are compared to state and national benchmarks.
▲ 47.4% Above PA avg. ▲ 47.4% Above PA avg.PA average: 3.4Click the badge to see the full State ranking.Click here to see the full State ranking.
Quality Measures Info Based on clinical and physical health indicators reported to CMS, such as hospital readmissions, falls, pressure ulcers, and improvements in mobility. These measures reflect how well residents' health needs are being managed.
▼ 70.5% Below PA avg. ▼ 70.5% Below PA avg.PA average: 3.4Click the badge to see the full State ranking.Click here to see the full State ranking.

Staffing hours breakdown

Info Daily nursing hours per resident by staff type, reported to CMS. Higher is generally better — compare this facility to state and national averages to see where staffing stands.

Hours per resident per day — compared to Pennsylvania state averages

Total nursing care / resident Info This home is ranked 5th out of 207 homes in Pennsylvania for nurse hours. Total adjusted nursing hours per resident per day, combining RN, LPN, and aide time. CMS adjusts this for case-mix so facilities can be fairly compared.
6h 43m per day
Rank #5 / 207Nurse hours — State benchmarkedThis home is ranked 5th out of 207 homes in Pennsylvania. Shows adjusted nurse hours per resident per day benchmarked to the Pennsylvania average, with a ranking across 207 Pennsylvania facilities. More hours mean more direct care. The national average is about 3.5 hrs; below 3.0 is a red flag.Rankings are based only on facilities in Pennsylvania that report data for that category. Facilities without available data are excluded from the ranking.Click the rank badge to see the full State ranking.Click here to see the full State ranking.
This facility Pennsylvania avg (4h 9m per day)
vs Pennsylvania avg
+62%

2 of 6 metrics below state avg

Standout metric Registered Nurse (RN) is +100% above state avg
Staff typeHours / Day / Residentvs state avg
Registered Nurse (RN) Info RNs hold the highest nursing license and can assess residents, interpret test results, and direct care plans. More RN hours per day often signals stronger clinical oversight and faster response to health changes. 1h 34m per day ▲ 100% State avg: 47m per day · National avg: 41m per day
LPN / LVN Info Licensed Practical Nurses (LPNs) or Licensed Vocational Nurses (LVNs) deliver routine hands-on care — medication administration, wound dressing, and monitoring vital signs. They work under RN supervision and make up a large share of daily bedside care. 11m per day ▼ 80% State avg: 55m per day · National avg: 52m per day
Nurse Aide Info Certified Nurse Aides (CNAs) provide the most direct day-to-day assistance: bathing, dressing, feeding, and mobility. Nurse aide hours are typically the largest staffing category and directly affect residents' quality of life. 3h 51m per day ▲ 75% State avg: 2h 12m per day · National avg: 2h 21m per day
Weekend Total Nursing Info Combined nursing hours (RN + LPN + Nurse Aide) per resident per day on weekends. Staffing often drops on weekends — this figure reveals whether the facility maintains adequate coverage outside of weekday hours. 4h 46m per day ▲ 36% State avg: 3h 31m per day · National avg: 3h 26m per day
Physical Therapist Info Hours per resident per day provided by licensed Physical Therapists (PTs) or PT Assistants. PT services help residents recover mobility after injury or illness and are especially important for post-acute (short-stay) rehabilitation. 0m per day ▼ 100% State avg: 6m per day · National avg: 4m per day
Weekend RN Info Registered nurse hours specifically on weekends. Facilities sometimes reduce RN presence on Saturdays and Sundays — a low weekend RN figure compared to weekday hours can indicate reduced clinical oversight when most administrative staff are absent. 59m per day ▲ 79% State avg: 33m per day · National avg: 29m per day

Capacity and availability

This home usually has availability

Lower occupancy than the Pennsylvania average: 78.7%
Occupancy rate
58.3% Rank #375 / 518Occupancy rate — State benchmarkedThis home is ranked 375th out of 518 homes in Pennsylvania. Shows this facility's occupancy rate versus the Pennsylvania average, with its Statewide rank out of 518. Higher occupancy signals strong local demand and financial stability.Rankings are based only on facilities in Pennsylvania that report data for that category. Facilities without available data are excluded from the ranking.Click the rank badge to see the full State ranking.Click here to see the full State ranking.
Bed community size
48-bed community Rank #457 / 555Bed count — State benchmarkedThis home is ranked 457th out of 555 homes in Pennsylvania. Shows this facility's certified or reported bed count compared to other Pennsylvania facilities. Larger communities may offer more amenities, programs, and on-site services for residents and families.Rankings are based only on facilities in Pennsylvania that report data for that category. Facilities without available data are excluded from the ranking.Click the rank badge to see the full State ranking.Click here to see the full State ranking.
A moderately sized community that may balance personal attention with shared amenities and social activities.
Walk Score
Walk Score: 46 / 100 Rank #329 / 668Walk Score — State benchmarkedThis home is ranked 329th out of 668 homes in Pennsylvania. Shows how walkable this facility's neighborhood is compared to the average Walk Score across Pennsylvania facilities. Higher scores benefit residents, families, and staff.Rankings are based only on facilities in Pennsylvania that report data for that category. Facilities without available data are excluded from the ranking.Click the rank badge to see the full State ranking.Click here to see the full State ranking.
Somewhat walkable. A few nearby services may be reachable on foot, but most trips require transportation.

Contact Little Sisters of the Poor

Staffing Data

Reporting period: October 1 – December 31, 2025 (Q4 2025). Source: CMS Payroll-Based Journal report.

Total staff 146
Employees 69
Contractors 77
Staff to resident ratio 3.65 : 1
99% more staff per resident than Pennsylvania average
Pennsylvania average ratio: 1.83 : 1 Pennsylvania average ratio: 1.83 : 1See full Pennsylvania ranking
Avg staff/day 36
Average shift 7.7 hours
0% compared with Pennsylvania average
Pennsylvania average: 7.8 hours Pennsylvania average shift: 7.8 hoursSee full Pennsylvania ranking
Total staff hours (quarter) 25,600

Nursing staff breakdown

Q4 2025 · Oct 1 – Dec 31 More info This data comes from the CMS Payroll-Based Journal report covering October 1 – December 31, 2025.
Registered Nurse

Manages medical care and health needs.

RN Staff Info 28 total: 12 full-time employees and 16 contractors. 28
Average shift length Info Average shift length. Calculated as total hours divided by days worked and average staff per day. 7.6 hours
Licensed Practical Nurse

Assists with medical care and medications.

LPN Staff Info 10 total: 3 full-time employees and 7 contractors. 10
Average shift length Info Average shift length. Calculated as total hours divided by days worked and average staff per day. 6.5 hours
Certified Nursing Assistant

Helps with daily care and mobility.

CNA Staff Info 91 total: 41 full-time employees and 50 contractors. 91
Average shift length Info Average shift length. Calculated as total hours divided by days worked and average staff per day. 8 hours

Contractor staffing

Q4 2025 · Oct 1 – Dec 31 More info This data comes from the CMS Payroll-Based Journal report covering October 1 – December 31, 2025.

Total hours from contractors

17.6%

4,495 contractor hours this quarter

Certified Nursing Assistant: 50 Registered Nurse: 16 Licensed Practical Nurse: 7 Administrator: 1 Other Physician: 1 Physician Assistant: 1 Medical Director: 1

Staff by category

Q4 2025 · Oct 1 – Dec 31 More info This data comes from the CMS Payroll-Based Journal report covering October 1 – December 31, 2025.
Certified Nursing Assistant41509115,43292100%8
Registered Nurse1216284,86092100%7.6
Clinical Nurse Specialist6061,0116571%7.4
Dental Services Staff2029176267%8
Licensed Practical Nurse37107478289%6.5
Therapeutic Recreation Specialist2027096672%8
Administrator0115286672%8
Dietitian1014886267%7.9
Other Dietary Services Staff1014565762%8
Nurse Practitioner1014125257%7.9
Physician Assistant011271112%2.5
Medical Director011855%1.5
Other Physician011755%1.4
91 Certified Nursing Assistant
% of Days 100%
28 Registered Nurse
% of Days 100%
6 Clinical Nurse Specialist
% of Days 71%
2 Dental Services Staff
% of Days 67%
10 Licensed Practical Nurse
% of Days 89%
2 Therapeutic Recreation Specialist
% of Days 72%
1 Administrator
% of Days 72%
1 Dietitian
% of Days 67%
1 Other Dietary Services Staff
% of Days 62%
1 Nurse Practitioner
% of Days 57%
1 Physician Assistant
% of Days 12%
1 Medical Director
% of Days 5%
1 Other Physician
% of Days 5%

Penalties and fines

Includes penalties issued in 2024-2025

Federal penalties imposed by CMS for regulatory violations, including civil money penalties (fines) and denials of payment for new Medicare/Medicaid admissions.

Source: CMS Penalties Database (Data as of Jan 2026)

Total fines amount $50K Rank #197 / 210Federal fines — State benchmarkedThis home is ranked 197th out of 210 homes in Pennsylvania. Shows this facility's cumulative CMS federal fine dollars versus the Pennsylvania average among facilities with fines, and where it ranks among 210 facilities in the pool. Lower total dollars mean a better rank.Rankings are based only on facilities in Pennsylvania that report data for that category. Facilities without available data are excluded from the ranking.Click the rank badge to see the full State ranking.Click here to see the full State ranking.
15% lower than Pennsylvania average

Pennsylvania average: $59K

Number of fines 2
In line with Pennsylvania average

Pennsylvania average: 2.1

Payment Denials Info Serious action where Medicare and/or Medicaid temporarily stops payments for new residents until issues are fixed. 0
100% fewer payment denials than Pennsylvania average

Pennsylvania average: 0.2

Fines amount comparison
This facility $50K
Pennsylvania average $59K
Penalty History

Penalties are imposed by CMS for violations of federal nursing home regulations.

2 penalties in the past 3 years

Multiple penalties were reported in the last 3 years.

Civil Money Penalty Info Fines imposed for noncompliance, which can be assessed per day or per instance of violation. Apr 16, 2025
$26K
Civil Money Penalty Info Fines imposed for noncompliance, which can be assessed per day or per instance of violation. Nov 27, 2024
$25K

Last updated: Jan 2026

Quality of care over time

These measures show how residents usually do over time at this home, based on health outcomes and preventive care.

High-risk clinical events score Info A composite score based on pressure ulcers, falls with injury, weight loss, walking ability decline, and activities of daily living decline. 10.7
In line with Pennsylvania average

Pennsylvania average: 11.0

Functional decline score Info A composite score based on activities of daily living decline, walking ability decline, and incontinence. 19.9
11% better than Pennsylvania average

Pennsylvania average: 22.2

Long-stay resident measures
Below average Pennsylvania avg: 3.7 Info CMS star rating based on long-stay quality measure performance. 5 stars = significantly above average, 1 star = significantly below average.
Need for Help with Daily Activities Increased Info Percent of long-stay residents whose need for help with daily activities has increased 21.0%
10% worse than Pennsylvania average

Pennsylvania average: 19.0%

Walking Ability Worsened Info Percent of long-stay residents whose ability to move independently worsened 12.3%
42% better than Pennsylvania average

Pennsylvania average: 21.1%

Low Risk Residents with Bowel/Bladder Incontinence Info Percent of low risk long-stay residents who lose control of their bowels or bladder 26.5%
In line with Pennsylvania average

Pennsylvania average: 26.7%

Falls with Major Injury Info Percent of long-stay residents experiencing one or more falls with major injury 5.6%
74% worse than Pennsylvania average

Pennsylvania average: 3.2%

High Risk Residents with Pressure Ulcers Info Percent of long-stay high risk residents with pressure ulcers 6.1%
11% worse than Pennsylvania average

Pennsylvania average: 5.5%

Urinary Tract Infection Info Percent of long-stay residents with a urinary tract infection 6.3%
257% worse than Pennsylvania average

Pennsylvania average: 1.8%

Lost Too Much Weight Info Percent of long-stay residents who lose too much weight 8.9%
34% worse than Pennsylvania average

Pennsylvania average: 6.6%

Depressive Symptoms Info Percent of long-stay residents who have depressive symptoms 0.0%
100% better than Pennsylvania average

Pennsylvania average: 5.5%

Antipsychotic Use Info Percent of long-stay residents who received an antipsychotic medication 23.1%
35% worse than Pennsylvania average

Pennsylvania average: 17.1%

Pneumococcal Vaccine Info Percent of long-stay residents assessed and appropriately given the pneumococcal vaccine 100.0%
15% better than Pennsylvania average

Pennsylvania average: 86.9%

Influenza Vaccine Info Percent of long-stay residents assessed and appropriately given the seasonal influenza vaccine 100.0%
7% better than Pennsylvania average

Pennsylvania average: 93.5%

Short-stay resident measures
Pneumococcal Vaccine Info Percent of short-stay residents assessed and appropriately given the pneumococcal vaccine 59.3%
14% worse than Pennsylvania average

Pennsylvania average: 68.8%

Facility Characteristics

Source: CMS Long-Term Care Facility Characteristics (Data as of Jan 2026)

Total residents 40
Medicare
1
2.5% of residents
Medicaid
33
82.5% of residents
Private pay or other
6
15% of residents
Programs & Services
Residents Group

Residents meet regularly to discuss policies, care quality, and activities

Active Resident Council

Organized group of residents that meets regularly to discuss facility policies, quality of life, and activities.

What does this home offer?

Building type icon
Building type icon

Building Type: 3-story

Places of interest near Little Sisters of the Poor

Address 3.9 miles from city center Info Estimated distance in miles from Pittsburgh's city center to Little Sisters of the Poor's address, calculated via Google Maps. — 3.14 miles to nearest hospital (Heritage Valley Kennedy)

Calculate Travel Distance to Little Sisters of the Poor

Add your location

Address

Compare Nursing Homes around Pittsburgh

The information below is reported by the Pennsylvania Department of Human Services and Department of Health.

5 facilities compared · CMS & PA Dept. of Health data

Vincentian Home
NH
AL
IL
MC
Pittsburgh
90
Facility 90
PA AVG 94
Rank #251 / 555
57.8%
Facility 57.8%
PA AVG 78.7%
Rank #384 / 518
-27%
4.64
Facility 4.64
PA AVG 4.15
Rank #70 / 207
+83%+12%
$0
Facility $0
PA AVG $61.2k
Rank #1 / 210
83
Facility 83
PA AVG 83
Rank #233 / 460
35
Facility 35
PA AVG 31.3
Rank #152 / 207
4.4
Facility 4.4
PA AVG 4.4
Rank #128 / 207
-52A
20
Facility 20
PA AVG 46
Rank #533 / 668
Vincentian Collaborative System
$22.3M
Facility $22.3M
PA AVG $32.8M
Rank #39 / 209
$12.4M
Facility $12.4M
PA AVG $6.7M
Rank #28 / 209
55.7%
Facility 55.7%
PA AVG 40%
Rank #115 / 209
395034
Asbury Heights
NH
AL
IL
MC
Pittsburgh
120
Facility 120
PA AVG 94
Rank #127 / 555
36.7%
Facility 36.7%
PA AVG 78.7%
Rank #493 / 518
-53%
4.34
Facility 4.34
PA AVG 4.15
Rank #90 / 207
+58%+5%
$0
Facility $0
PA AVG $61.2k
Rank #1 / 210
88
Facility 88
PA AVG 83
Rank #162 / 460
23
Facility 23
PA AVG 31.3
Rank #121 / 207
3.8
Facility 3.8
PA AVG 4.4
Rank #109 / 207
-44-
47
Facility 47
PA AVG 46
Rank #320 / 668
Asbury Senior Care LLC
$20.5M
Facility $20.5M
PA AVG $32.8M
Rank #79 / 209
$8.2M
Facility $8.2M
PA AVG $6.7M
Rank #43 / 209
40%
Facility 40%
PA AVG 40%
Rank #28 / 209
395391
Reformed Presbyterian Home
NH
IL
Pittsburgh (Perry South)
56
Facility 56
PA AVG 94
Rank #422 / 555
42.9%
Facility 42.9%
PA AVG 78.7%
Rank #472 / 518
-45%
4.80
Facility 4.80
PA AVG 4.15
Rank #55 / 207
+151%+16%
$0
Facility $0
PA AVG $61.2k
Rank #1 / 210
75
Facility 75
PA AVG 83
Rank #338 / 460
31
Facility 31
PA AVG 31.3
Rank #146 / 207
7.8
Facility 7.8
PA AVG 4.4
Rank #196 / 207
-24A+
50
Facility 50
PA AVG 46
Rank #283 / 668
Lorrie Meneely
$7.3M
Facility $7.3M
PA AVG $32.8M
Rank #184 / 209
$4.4M
Facility $4.4M
PA AVG $6.7M
Rank #185 / 209
60.1%
Facility 60.1%
PA AVG 40%
Rank #66 / 209
395561
Canterbury Place
NH
HC
MC
PC
RC
Pittsburgh (Central Lawrenceville)
78
Facility 78
PA AVG 94
Rank #311 / 555
--
4.32
Facility 4.32
PA AVG 4.15
Rank #90 / 207
+52%+4%
$0
Facility $0
PA AVG $61.2k
Rank #1 / 210
86
Facility 86
PA AVG 83
Rank #193 / 460
28
Facility 28
PA AVG 31.3
Rank #135 / 207
3.5
Facility 3.5
PA AVG 4.4
Rank #97 / 207
111A+
93
Facility 93
PA AVG 46
Rank #18 / 668
Upmc
$14.2M
Facility $14.2M
PA AVG $32.8M
Rank #112 / 209
$9.3M
Facility $9.3M
PA AVG $6.7M
Rank #60 / 209
65.2%
Facility 65.2%
PA AVG 40%
Rank #16 / 209
395146
Little Sisters of the Poor
NH
IL
Pittsburgh (Brighton Heights)
48
Facility 48
PA AVG 94
Rank #457 / 555
58.3%
Facility 58.3%
PA AVG 78.7%
Rank #375 / 518
-26%
6.72
Facility 6.72
PA AVG 4.15
Rank #5 / 207
+60%+62%
$68.4k
Facility $68.4k
PA AVG $61.2k
Rank #197 / 210
-
41
Facility 41
PA AVG 31.3
Rank #161 / 207
13.7
Facility 13.7
PA AVG 4.4
Rank #207 / 207
-44-
46
Facility 46
PA AVG 46
Rank #329 / 668
Claire Mccanless
-
Facility -
PA AVG $32.8M
Rank #206 / 209
-
Facility -
PA AVG $6.7M
Rank #193 / 209
-
Facility -
PA AVG 40%
Rank #1 / 209
396116

Financial Assistance for
Nursing Home in Pennsylvania

Little Sisters of the Poor is located in Pittsburgh, Pennsylvania.
Here are the financial assistance programs available to residents in Pennsylvania.

Get Financial aid guidance

Community HealthChoices (CHC)

PA Medicaid CHC

Age 65+ or disabled
General Pennsylvania resident, Medicaid-eligible, nursing home-level care need.
Income Limits (2025) ~$2,829/month 300% FBR, individual
Asset Limits $2,000 (individual), $3,000 (couple) (excludes home, car).
PA

Managed care model; high urban demand (e.g., Philadelphia, Pittsburgh).

Benefits
Personal care (5-7 hours/day, e.g., bathing, dressing) Respite care (up to 240 hours/year) Adult day care ($70/day) Home modifications ($1,500 avg.)

Pennsylvania OPTIONS Program

PA OPTIONS

Age 60+
General Pennsylvania resident, at risk of nursing home placement.
Income Limits ~$2,000/month individual, varies by region
Asset Limits $8,000 individual
PA

Cost-sharing required above certain income; rural/urban balance.

Benefits
In-home care (3-5 hours/week) Respite (up to 10 days/year) Adult day care (~$70/day) Transportation (~5 trips/month)

Living Independence for the Elderly (LIFE)

Pennsylvania LIFE (PACE)

Age 55+
General PA resident (specific counties), NFLOC, safe with LIFE support.
Income Limits (2025) ~$2,829/month (Medicaid-eligible); private pay option available.
Asset Limits $2,000 (individual), $3,000 (couple) for Medicaid enrollees.
PA

16 providers in 25 counties (e.g., Allegheny, Luzerne); LIFE branding unique to PA.

Benefits
Personal care (5-7 hours/day) Medical care Meals Transportation Respite Therapies

Medicare Savings Program (MSP)

Pennsylvania Medicare Savings Program

Age 65+ or disabled
General PA resident, Medicare Part A/B.
Income Limits (2025) ~$2,510/month (QMB), ~$3,380/month (SLMB), ~$3,598/month (QI)—individual.
Asset Limits $9,430 (individual), $14,130 (couple).
PA

Three tiers; includes Extra Help for Part D; no waitlist.

Benefits
Covers Part B premiums ($174.70/month) Deductibles ($240/year) Copays (~20%)

Family Caregiver Support Program (FCSP)

Pennsylvania Family Caregiver Support Program

Age
General Caregivers of 60+ needing care or 55+ caregivers of others; PA resident; functional needs (2+ ADLs).
Income Limits (2025) No strict cap; reimbursements up to $600/month if care recipient income < ~$2,322/month 185% FPL
Asset Limits Not assessed; need-based.
PA

High demand; includes grandparent caregivers.

Benefits
Respite (4-6 hours/week or 5 days/year) Adult day care ($60/day) Supplies (~$2,000/year) Caregiver training

VA Aid and Attendance (A&A) and Housebound Benefits

Pennsylvania VA Aid and Attendance/Housebound

Age 65+ or disabled veteran/spouse
General PA resident, wartime service, need for ADL help (A&A) or homebound.
Income Limits (2025) Net income < ~$1,984/month (veteran with dependent, A&A); pension offsets income.
Asset Limits ~$155,356 net worth limit
PA

High veteran population; supports rural/urban care needs.

Benefits
Cash (~$1,433-$2,642/month veteran, ~$951-$1,318 spouse) for care costs (e.g., in-home, assisted living)

Property Tax/Rent Rebate Program (PTRR)

Pennsylvania Property Tax/Rent Rebate Program

Age 65+
General PA resident, homeowner/renter (or widow/er 50+, disabled 18+).
Income Limits (2025) ~$45,000/year individual or couple, excludes half of Social Security
Asset Limits Not assessed; income-focused.
PA

Rebates up to $1,000; ~600,000 eligible annually.

Benefits
Rebates ($250-$1,000 based on income; e.g., $1,000 if income < $8,000)

Senior Farmers’ Market Nutrition Program (SFMNP)

Pennsylvania SFMNP

Age 60+
General PA resident, low-income.
Income Limits (2025) ~$2,322/month individual, 185% FPL
Asset Limits Not assessed.
PA

Vouchers (~$50/season) via 52 AAAs; serves ~200,000 annually.

Benefits
Vouchers (~$50/season) for fresh produce at approved markets

Frequently Asked Questions about Little Sisters of the Poor

What neighborhood is Little Sisters of the Poor in?

Little Sisters of the Poor is in the Brighton Heights neighborhood.

Is Little Sisters of the Poor in a walkable area?

Little Sisters of the Poor has a walk score of 46. Somewhat walkable. A few nearby services may be reachable on foot, but most trips require transportation.

What is the occupancy rate at Little Sisters of the Poor?

Little Sisters of the Poor's occupancy is 58.3%.

Does Little Sisters of the Poor operate as a for-profit or non-profit?

Little Sisters of the Poor is registered as a non-profit.

Are there photos of Little Sisters of the Poor?

Yes — there are 3 photos of Little Sisters of the Poor in the photo gallery on this page.

What is the address of Little Sisters of the Poor?

Little Sisters of the Poor is located at 1028 Benton Ave, Pittsburgh, PA 15212.

What is the phone number of Little Sisters of the Poor?

(412) 307-1100 will put you in contact with the team at Little Sisters of the Poor.

Guides for Better Senior Living

Care Cost Calculator: See Prices in Your Area

Nursing Home Data Explorer

Don’t Wait Too Long: 7 Red Flag Signs Your Parent Needs Assisted Living Now

The True Cost of Assisted Living in 2025 – And How Families Are Paying For It

Understanding Senior Living Costs: Pricing Models, Discounts & Financial Assistance