Explore Open Rooms

1 Contact details
2 What type of senior care service are you looking for?
3 What budget do you have in mind for senior care?
4 How soon do you need to find care?
5 Additional details

Thank you for your interest!

Our team will be in touch shortly to help with next steps.

Nursing Home

Capital Nursing And Rehabilitation Center

Nursing Home

Capital Nursing And Rehabilitation Center

3000 Holston Ln, Raleigh, NC 27610 View map
Overview of Capital Nursing and Rehabilitation Center

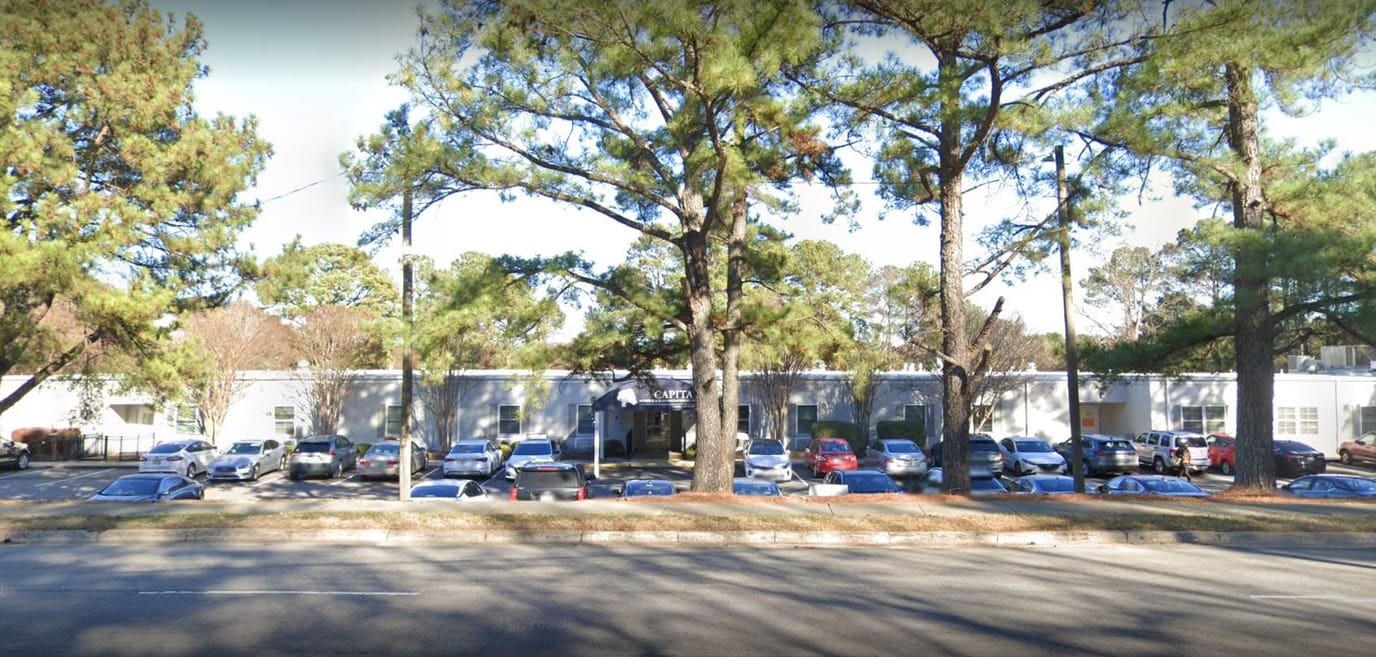
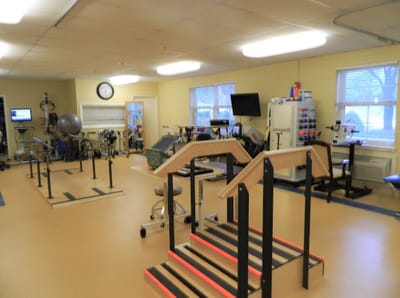
Capital Nursing and Rehabilitation Center is an award-winning senior living community in Holston Lane, Raleigh, NC, that is dedicated to improving seniors’ quality of life and provides a wide array of care services. These include short-term rehabilitation, skilled nursing, outpatient therapy, hospice care, palliative care, respite care, and long-term care. A team of compassionate and highly trained professionals welcomes seniors and takes care of their needs and aspirations.

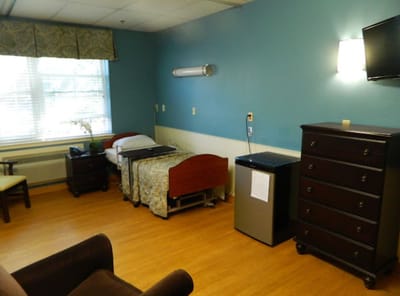
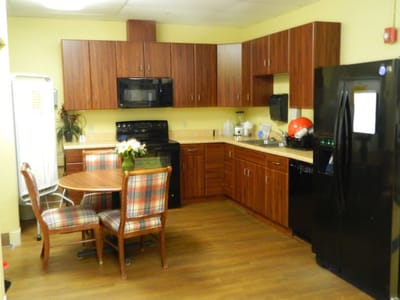
Remain well-engaged and do the things you enjoy with a well-thought-of calendar of enriching activities and exciting programs. Filled with extensive amenities, Capital Nursing and Rehabilitation Center strives to provide a comfortable and safe retirement for seniors to thrive and live their lives to the fullest.

(919) 231-6045

Quality ratings

Measured by Centers for Medicare & Medicaid Services (CMS)

Overall rating Info The Overall CMS Rating combines results from health inspections, staffing levels and quality measures. Health inspections carry the most weight. Staffing and quality scores can increase or decrease the final rating based on performance compared to state and national standards.
4/5
North Carolina average: 3.5/5
Health Inspection Info Based on the results of the facility's three most recent standard inspections and any complaint investigations. CMS reviews the number, scope, and severity of deficiencies, with more recent findings weighted more heavily.
4/5
North Carolina average: 3.4/5
Staffing Info Measures average nursing staff hours per resident per day, including Registered Nurses (RNs) and total nursing staff. Ratings are adjusted based on the level of care residents require and are compared to state and national benchmarks.
2/5
North Carolina average: 3.3/5
Quality Measures Info Based on clinical and physical health indicators reported to CMS, such as hospital readmissions, falls, pressure ulcers, and improvements in mobility. These measures reflect how well residents' health needs are being managed.
4/5
North Carolina average: 3.7/5

Nursing care per resident

Info This shows how many total hours of nursing staff time are available per resident each day. Higher numbers usually mean more staff support.
3h 26m per day

This home provides 31% less nursing time per resident than the North Carolina average.

North Carolina average: 4h 57m per day

Staffing hours breakdown

Info Hours of care per resident per day, broken down by staff type. Data from CMS Medicare.
Staff type Facility State avg National avg
Registered Nurse (RN) Info Registered nurse hours per resident per day. 28m per day 35m per day 41m per day
Nurse Aide Info Nurse aide hours per resident per day. 2h 6m per day 2h 19m per day 2h 21m per day
Total Nursing (Weekend) Info Total number of nurse staff hours per resident per day on weekends. 3h 2m per day 3h 20m per day 3h 26m per day
Physical Therapist Info Physical therapist staff hours per resident per day. 3m per day 5m per day 4m per day
RN (Weekend) Info Registered nurse hours per resident per day on weekends. 19m per day 23m per day 29m per day

Capacity and availability

Medium-capacity home

Offers a balance of services and community atmosphere.

Total beds 125

This home usually has availability

Lower occupancy suggests more openings may be available.

Lower demand than the North Carolina average
Occupancy rate 75.9%
Residents per day (avg) 100
Occupancy rate
75.9%
Residents per day (avg)
100

Who this home usually serves

TYPE OF STAY

Primarily short stays

Residents typically stay for brief periods, with frequent admissions and discharges throughout the year.

Might be optimal for
Post-acute recovery Temporary care Transitional stays

Breakdown by payment type

Medicare

26% of new residents, usually for short-term rehab.

Typical stay 27 days

Private pay

66% of new residents, often for short stays.

Typical stay 1 - 2 months

Medicaid

9% of new residents, often for long-term daily care.

Typical stay 2 years

Finances and operations

Privately-owned community
Operated by a business corporation.
Home revenue
$13.9M
Profit
$490.1K
Privately-owned community Operated by a business corporation.
Home revenue
$13,877,032.00
Profit
$490,076.00
Payroll costs Info The portion of the home's budget spent on staff, including nurses, caregivers, and other employees who support care and operations.
$5.4M
38.7% of revenue
Other operating costs Info All remaining costs needed to run the home, such as food, utilities, building maintenance, supplies and administrative expenses.
$8.0M
Total costs $13.4M
Years in operation
20 years in operation
A longer operating history, which may indicate experience navigating regulations and delivering ongoing care.
Walk Score
Walk Score: 43 / 100
Somewhat walkable. A few nearby services may be reachable on foot, but most trips require transportation.
BBB Rating
BBB Rating: B- (Not Accredited)
An independent rating from the Better Business Bureau based on factors such as complaint history, transparency, and business practices.
How BBB ratings work

Additional licensing details

CMS Certification Number: 345202

Ownership & operating entity

Profit status: for-profit

Staffing

Key information about the people who lead and staff this community.

Leadership

Contact: Mr. Ronnie McNeil, Co-Owner

Care Services

Alzheimer's Certification

What does this home offer?

Building type icon
Building type icon

Building Type: Single-story

Types of Care at Capital Nursing And Rehabilitation Center

Skilled Nursing Hospice Care Respite Care Nursing Care
Contact Capital Nursing And Rehabilitation Center

Inspection History

In North Carolina, the Department of Health and Human Services, Division of Health Service Regulation conducts unannounced surveys to ensure nursing and adult care homes meet safety standards.

5 visits/inspections

3 visits/inspections triggered by complaints

3 routine inspections

Results

5 with issues

0 without issues

Latest inspection

Date:August 7, 2025
Type:Routine

20 deficiencies

Deficiencies indicate regulatory issues. A higher number implies the facility had several areas requiring improvement.

Health Inspection History

Inspections
Total health inspections 5

North Carolina average 4


Last Health inspection on Aug 2025

Total health citations 14

North Carolina average 20.9

Citations per inspection
2.8

North Carolina average 4.99


Health citations are formal notices following inspections when they fail to comply with safety and care standards.

8 of 14 citations resulted from standard inspections; 2 of 14 resulted from complaint investigations; and 4 of 14 came from combined inspections (standard and complaint).

Breakdown of citation severity (last 3 years)
Critical Health citations More info 0
100% better than North Carolina average

North Carolina average: 1.3


Serious Health citations More info 0
100% better than North Carolina average

North Carolina average: 0.9

0 critical citations More info North Carolina average: 1.3

0 serious citations More info North Carolina average: 0.9

10 moderate citations More info North Carolina average: 17.1

4 minor citations More info North Carolina average: 1.6
Citations history (last 3 years)
Abuse/Neglect moderate citation Info Issues related to protecting resident's from harm, including abuse, neglect, or mistreatment. Aug 07, 2025
Corrected

Pharmacy moderate citation Info Issues related to medication management, including how drugs are stored, administered, and monitored. Aug 07, 2025
Corrected

Quality of Care moderate citation Info Issues related to how well residents receive appropriate treatment and support for their medical and daily care needs. Aug 07, 2025
Corrected

Care Planning minor citation Info Issues related to creating and updating personalized care plans for residents based on their needs and conditions. Aug 07, 2025
Corrected

Compare Nursing Homes around Raleigh The information below is reported by the North Carolina Department of Health and Human Services, Division of Health Service Regulation.

5 facilities compared · CMS & NC Dept. of Health data · Updated Mar 2026

College Pines Health and Rehabilitation Center
AL

Assisted Living A licensed, long-term care setting for seniors or individuals with disabilities who need help with daily activities — like bathing, dressing, and medication management — but not 24-hour skilled nursing. Offers housing, meals, and around-the-clock support while aiming to maximize resident independence.

NH

Nursing Home Licensed facility providing 24/7 skilled nursing care for residents with complex, ongoing medical needs. Staffed by RNs, LPNs, and CNAs. Inspected and star-rated annually by CMS. Accepts Medicare (short-term rehab) and Medicaid (long-term care).

Connelly Springs
104
88.6%
+16%
3.98
-2%
0%
2
4
2
92
-
6
-
$15,2M
$5,2M
34.1%
345446
Capital Nursing And Rehabilitation Center
AL

Assisted Living A licensed, long-term care setting for seniors or individuals with disabilities who need help with daily activities — like bathing, dressing, and medication management — but not 24-hour skilled nursing. Offers housing, meals, and around-the-clock support while aiming to maximize resident independence.

HC

Home Care Professional care delivered in the person's own home — from companionship and errands to skilled nursing and therapy. Allows seniors to age in place. Medicare covers skilled home health when medically necessary.

IL

Independent Living Lifestyle-focused communities for older adults offering dining, activities, and transportation with minimal personal care. Best for active, independent seniors who want community without medical support.

NH

Nursing Home Licensed facility providing 24/7 skilled nursing care for residents with complex, ongoing medical needs. Staffed by RNs, LPNs, and CNAs. Inspected and star-rated annually by CMS. Accepts Medicare (short-term rehab) and Medicaid (long-term care).

Raleigh (East Raleigh)
125
75.9%
-1%
3.43
-16%
-14%
0
14
0
100
B-
43
Liberty Commons Nursing And Rehabilitation Center Of Wake County, Llc
$13,6M
$5,4M
39.4%
345202
Hillcrest Raleigh At Crabtree Valley
AL

Assisted Living A licensed, long-term care setting for seniors or individuals with disabilities who need help with daily activities — like bathing, dressing, and medication management — but not 24-hour skilled nursing. Offers housing, meals, and around-the-clock support while aiming to maximize resident independence.

NH

Nursing Home Licensed facility providing 24/7 skilled nursing care for residents with complex, ongoing medical needs. Staffed by RNs, LPNs, and CNAs. Inspected and star-rated annually by CMS. Accepts Medicare (short-term rehab) and Medicaid (long-term care).

Raleigh (North Hills)
134
73.7%
-4%
4.27
+34%
+7%
1
12
1
100
A+
31
Hillcrest Convalescent Center, Inc.
$21,5M
$6,5M
30.2%
345555
Raleigh Rehabilitation Center
AL

Assisted Living A licensed, long-term care setting for seniors or individuals with disabilities who need help with daily activities — like bathing, dressing, and medication management — but not 24-hour skilled nursing. Offers housing, meals, and around-the-clock support while aiming to maximize resident independence.

NH

Nursing Home Licensed facility providing 24/7 skilled nursing care for residents with complex, ongoing medical needs. Staffed by RNs, LPNs, and CNAs. Inspected and star-rated annually by CMS. Accepts Medicare (short-term rehab) and Medicaid (long-term care).

Raleigh
157
80.8%
+6%
3.54
+35%
-11%
3
26
4
140
-
48
Jackson, Christina
$18,9M
$6,2M
32.8%
345049
Hayes Barton Place
-
AL

Assisted Living A licensed, long-term care setting for seniors or individuals with disabilities who need help with daily activities — like bathing, dressing, and medication management — but not 24-hour skilled nursing. Offers housing, meals, and around-the-clock support while aiming to maximize resident independence.

IL

Independent Living Lifestyle-focused communities for older adults offering dining, activities, and transportation with minimal personal care. Best for active, independent seniors who want community without medical support.

MC

Memory Care Secured, specialized care for people living with Alzheimer's or dementia. Staff trained in cognitive impairment, with higher staff-to-resident ratios and an environment designed to reduce confusion and wandering risk.

NH

Nursing Home Licensed facility providing 24/7 skilled nursing care for residents with complex, ongoing medical needs. Staffed by RNs, LPNs, and CNAs. Inspected and star-rated annually by CMS. Accepts Medicare (short-term rehab) and Medicaid (long-term care).

Raleigh (Five Points)
-
-
-
-
-
-
-
-
-
0
0
0
-
-
59
-
-
-
-
-

Places of interest near Capital Nursing And Rehabilitation Center

Address 3.7 miles from city center — 0.41 miles to nearest hospital (Heart & Vascular - Cardiovascular & Thoracic Surgery - Raleigh Campus)

Address 3000 Holston Ln, Raleigh, NC 27610

Calculate Travel Distance to Capital Nursing And Rehabilitation Center

Add your location

Address

Staffing Data (Q2 2025)

This data corresponds to Q2 2025 and is based on CMS Payroll-Based Journal.

Total staff 118
Employees 99
Contractors 19
Staff to resident ratio 1.18:1
36% worse than North Carolina average

North Carolina average ratio: 1.85:1

Avg staff/day 48
Average shift 7.8 hours
0% compared with North Carolina average

North Carolina average: 8 hours

Total staff hours (quarter) 34,053
Nursing staff breakdown
Registered Nurse

Manages medical care and health needs.

Total count 9
Average shift length Info Average shift length. Calculated as total hours divided by days worked and average staff per day. 8.1 hours

No contractors work on this role.

Licensed Practical Nurse

Assists with medical care and medications.

Total count 23
Average shift length Info Average shift length. Calculated as total hours divided by days worked and average staff per day. 8.8 hours

No contractors work on this role.

Certified Nursing Assistant

Helps with daily care and mobility.

Total count 59
Average shift length Info Average shift length. Calculated as total hours divided by days worked and average staff per day. 7.7 hours

No contractors work on this role.

Contractor staffing

Total hours from contractors

8.5%

2,882 contractor hours this quarter

Respiratory Therapy Technician: 4 Speech Language Pathologist: 4 Qualified Social Worker: 3 Physical Therapy Aide: 3 Physical Therapy Assistant: 2 Nurse Practitioner: 1 Occupational Therapy Assistant: 1 Medical Director: 1
Staff by category
Certified Nursing Assistant5905918,57691100%7.7
Licensed Practical Nurse230238,07591100%8.8
Registered Nurse9091,94091100%8.1
Clinical Nurse Specialist3031,0656976%8
Physical Therapy Assistant0225896571%6.3
Speech Language Pathologist0445876774%6
Nurse Practitioner1125116167%8
Dietitian1015116470%8
Physical Therapy Aide0335017987%6.1
Dental Services Staff1014896167%8
Administrator1014806167%7.9
Respiratory Therapy Technician0443344549%6.9
Qualified Social Worker0333336470%5
Occupational Therapy Assistant011551213%4.6
RN Director of Nursing101522%2.7
Medical Director011333%1
59 Certified Nursing Assistant
% of Days 100%
23 Licensed Practical Nurse
% of Days 100%
9 Registered Nurse
% of Days 100%
3 Clinical Nurse Specialist
% of Days 76%
2 Physical Therapy Assistant
% of Days 71%
4 Speech Language Pathologist
% of Days 74%
2 Nurse Practitioner
% of Days 67%
1 Dietitian
% of Days 70%
3 Physical Therapy Aide
% of Days 87%
1 Dental Services Staff
% of Days 67%
1 Administrator
% of Days 67%
4 Respiratory Therapy Technician
% of Days 49%
3 Qualified Social Worker
% of Days 70%
1 Occupational Therapy Assistant
% of Days 13%
1 RN Director of Nursing
% of Days 2%
1 Medical Director
% of Days 3%

Facility Characteristics

Source: CMS Long-Term Care Facility Characteristics (Data as of Jan 2026)

Total census
100 residents
Residents by payment source
Medicare
9 residents (9%)
Medicaid
71 residents (71%)
Private pay or other
20 residents (20%)
Programs & Services
Residents' Group

Residents meet regularly to discuss policies, care quality, and activities

Active Resident Council

Organized group of residents that meets regularly to discuss facility policies, quality of life, and activities.

Quality of care over time

These measures show how residents usually do over time at this home, based on health outcomes and preventive care.

High-risk clinical events score Info A composite score based on pressure ulcers, falls with injury, weight loss, walking ability decline, and activities of daily living decline. 4.8
58% better than North Carolina average

North Carolina average: 11.5

Functional decline score Info A composite score based on activities of daily living decline, walking ability decline, and incontinence. 14.0
32% better than North Carolina average

North Carolina average: 20.6

Long-stay resident measures
Significantly above average North Carolina avg: 2.9 Info CMS star rating based on long-stay quality measure performance. 5 stars = significantly above average, 1 star = significantly below average.
Need for Help with Daily Activities Increased Info Percent of long-stay residents whose need for help with daily activities has increased 6.9%
61% better than North Carolina average

North Carolina average: 17.5%

Walking Ability Worsened Info Percent of long-stay residents whose ability to move independently worsened 9.1%
61% better than North Carolina average

North Carolina average: 23.3%

Low Risk Residents with Bowel/Bladder Incontinence Info Percent of low risk long-stay residents who lose control of their bowels or bladder 26.1%
22% worse than North Carolina average

North Carolina average: 21.4%

Falls with Major Injury Info Percent of long-stay residents experiencing one or more falls with major injury 0.9%
75% better than North Carolina average

North Carolina average: 3.6%

High Risk Residents with Pressure Ulcers Info Percent of long-stay high risk residents with pressure ulcers 3.3%
48% better than North Carolina average

North Carolina average: 6.3%

Urinary Tract Infection Info Percent of long-stay residents with a urinary tract infection 1.9%
29% better than North Carolina average

North Carolina average: 2.6%

Lost Too Much Weight Info Percent of long-stay residents who lose too much weight 3.8%
48% better than North Carolina average

North Carolina average: 7.4%

Depressive Symptoms Info Percent of long-stay residents who have depressive symptoms 0.7%
85% better than North Carolina average

North Carolina average: 4.4%

Antipsychotic Use Info Percent of long-stay residents who received an antipsychotic medication 12.2%
9% better than North Carolina average

North Carolina average: 13.4%

Pneumococcal Vaccine Info Percent of long-stay residents assessed and appropriately given the pneumococcal vaccine 98.2%
7% better than North Carolina average

North Carolina average: 91.6%

Influenza Vaccine Info Percent of long-stay residents assessed and appropriately given the seasonal influenza vaccine 95.2%
In line with North Carolina average

North Carolina average: 94.1%

Short-stay resident measures
Average North Carolina avg: 2.7 Info CMS star rating based on short-stay quality measure performance. 5 stars = much above average, 1 star = much below average.
Pneumococcal Vaccine Info Percent of short-stay residents assessed and appropriately given the pneumococcal vaccine 92.5%
16% better than North Carolina average

North Carolina average: 79.9%

Antipsychotic medication increase Info Percent of short-stay residents who newly received an antipsychotic medication 0.6%
62% better than North Carolina average

North Carolina average: 1.5%

Influenza Vaccine Info Percent of short-stay residents assessed and appropriately given the seasonal influenza vaccine 79.4%
In line with North Carolina average

North Carolina average: 78.1%

Re-hospitalized after SNF stay Info Percentage of short-stay residents who were re-hospitalized after their nursing home admission. 20.0%
13% better than North Carolina average

North Carolina average: 22.9%

Emergency department visits Info Percentage of short-stay residents who had an outpatient emergency department visit. 12.2%
8% better than North Carolina average

North Carolina average: 13.2%

Falls with major injury Info Percentage of SNF residents who experience falls with major injury during their stay. 1.3%
62% worse than North Carolina average

North Carolina average: 0.8%

Ability to care for self at discharge Info Percentage of residents at or above expected ability to care for themselves at discharge. 43.8%
19% worse than North Carolina average

North Carolina average: 53.7%

Successful return to home or community Info Rate of successful return to home or community from a skilled nursing facility. 52.2%
In line with North Carolina average

North Carolina average: 50.6%

Guides for Better Senior Living

Care Cost Calculator: See Prices in Your Area

Nursing Home Data Explorer

Don’t Wait Too Long: 7 Red Flag Signs Your Parent Needs Assisted Living Now

The True Cost of Assisted Living in 2025 – And How Families Are Paying For It

Understanding Senior Living Costs: Pricing Models, Discounts & Financial Assistance

Financial Aid for North Carolina Seniors

Get financial aid guidance

Community Alternatives Program for Disabled Adults

NC Medicaid CAP/DA

Age 65+ or disabled, North Carolina resident, Medicaid- eligible, nursing home-level care need.

~$2,829/month (300% FBR, individual).

$2,000 (individual), $3,000 (couple).

High demand; waitlists common in urban areas.

North Carolina Senior Care Options

NC SCO (via NFCSP)

Caregiver of someone 60+ (or with dementia), North Carolina resident.

No strict limit; prioritizes low-income.

Not applicable.

Limited slots; rural/urban balance.

Program of All-Inclusive Care for the Elderly (PACE)

North Carolina PACE (e.g., PACE of the Triad)

Age 55+, NC resident (specific counties), NFLOC, safe with PACE support.

~$2,829/month (Medicaid-eligible); private pay option available.

$2,000 (individual), $3,000 (couple) for Medicaid enrollees.

Available in 10+ counties (e.g., Guilford, Wake); multiple providers (e.g., PACE of the Southern Piedmont).

In-Home Aide Services

North Carolina In-Home Aide Services

Age 60+, NC resident, unable to perform 1+ ADL, at risk of nursing home placement.

No strict cap; prioritizes low-income (~$24,980/year).

Not assessed; need-based.

Family can be aides; varies by county funding.

Medicare Savings Program (MSP)

North Carolina Medicare Savings Program

Age 65+ or disabled, NC resident, Medicare Part A/B.

~$2,510/month (QMB), ~$3,380/month (SLMB), ~$3,598/month (QI)—individual.

$9,430 (individual), $14,130 (couple).

Three tiers; no waitlist; includes Extra Help for Part D.

Low-Income Energy Assistance Program (LIHEAP)

North Carolina LIHEAP

Age 60+ prioritized, NC resident, low-income household.

~$3,970/month (individual, 185% FPL).

Not assessed; income-focused.

Covers oil, gas, electric; emergency aid via Crisis Intervention Program (CIP).

Senior Community Service Employment Program (SCSEP)

North Carolina SCSEP

Age 55+, unemployed, low-income, NC resident.

~$1,983/month (125% FPL).

Not specified; income-focused.

Priority for veterans, rural residents; AARP partnership.

VA Aid and Attendance (A&A) and Housebound Benefits

North Carolina VA Aid and Attendance/Housebound

Age 65+ or disabled veteran/spouse, NC resident, wartime service, need for ADL help (A&A) or homebound.

Net income < ~$1,984/month (veteran with dependent, A&A); pension offsets income.

~$155,356 (net worth limit).

High veteran demand in rural/urban areas.

Urgent Repair Program (URP)

North Carolina Urgent Repair Program

Age 60+ prioritized, NC resident, homeowner, low-income.

~$30,258/year (50% AMI, varies by county).

Not strictly assessed; home value considered.

Forgivable at $2,000/year; statewide via local partners.

State/County Special Assistance (SA)

North Carolina Special Assistance

Age 65+ (or disabled), NC resident, in licensed adult care home, low-income.

~$1,255/month (individual, 100% FPL); varies by facility rate.

$2,000 (individual).

Covers assisted living; counties supplement state funds.