

Total health inspections
6
Virginia average 4.2
Last Health inspection on Sep 2025

We arrange tours, appointments, and even moving support so you don’t have to

Carrington Place of Chesapeake is a skilled nursing community. Tranquility surrounds your environment with a family-like atmosphere, contributing to an inspiring and relaxing experience for a comfortable recovery period. Carrington Place boasts an elegant home with delightful hospitality that encourages residents to live on their terms while receiving quality service from the dedicated care staff.
The skilled nursing facility provides a list of specialties, such as wound care, therapy (speech, occupational, physical), psychiatric services, dental care, and 24/7 nursing supervision. Other essential services include housekeeping, medication administration, and social activities.
 Official CMS rating based on health inspections, staffing and quality measures.
Official CMS rating based on deficiencies found during state health inspections.
Official CMS rating based on nurse staffing hours per resident per day.
Official CMS rating based on clinical outcomes for residents.
Average daily nursing hours per resident (adjusted for acuity). Higher values indicate more nursing time per resident.
Official CMS rating based on health inspections, staffing and quality measures.
Official CMS rating based on deficiencies found during state health inspections.
Official CMS rating based on nurse staffing hours per resident per day.
Official CMS rating based on clinical outcomes for residents.
Average daily nursing hours per resident (adjusted for acuity). Higher values indicate more nursing time per resident.
Offers a balance of services and community atmosphere.
Lower occupancy suggests more openings may be available.
Most residents stay for extended periods and receive ongoing daily care.
19% of new residents, usually for short-term rehab.
49% of new residents, often for short stays.
32% of new residents, often for long-term daily care.
The portion of the home's budget spent on staff, including nurses, caregivers, and other employees who support care and operations.
All remaining costs needed to run the home, such as food, utilities, building maintenance, supplies and administrative expenses.
Nursing Homes 24/7 care needed
Nursing Homes 24/7 care needed
Nursing Homes 24/7 care needed
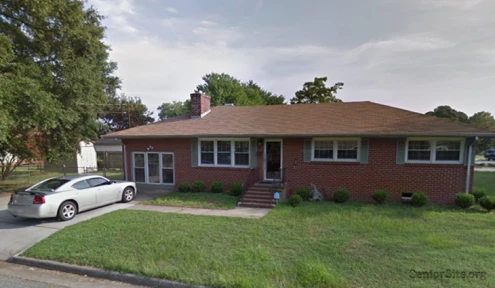
 Autumn Care of Chesapeake
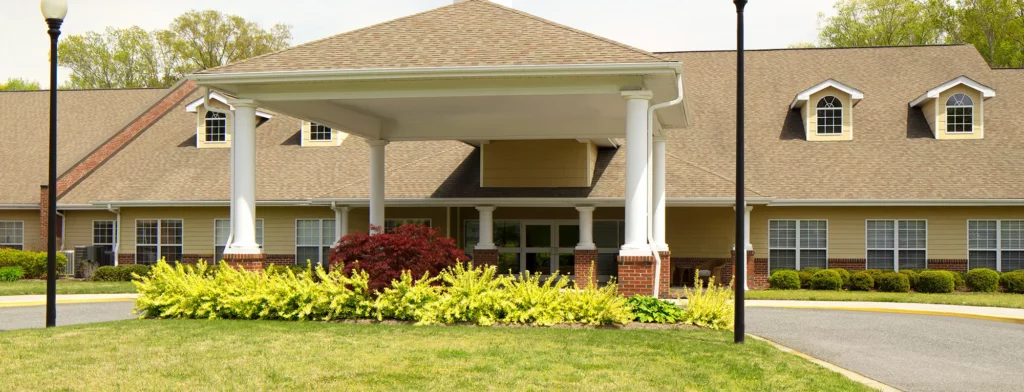
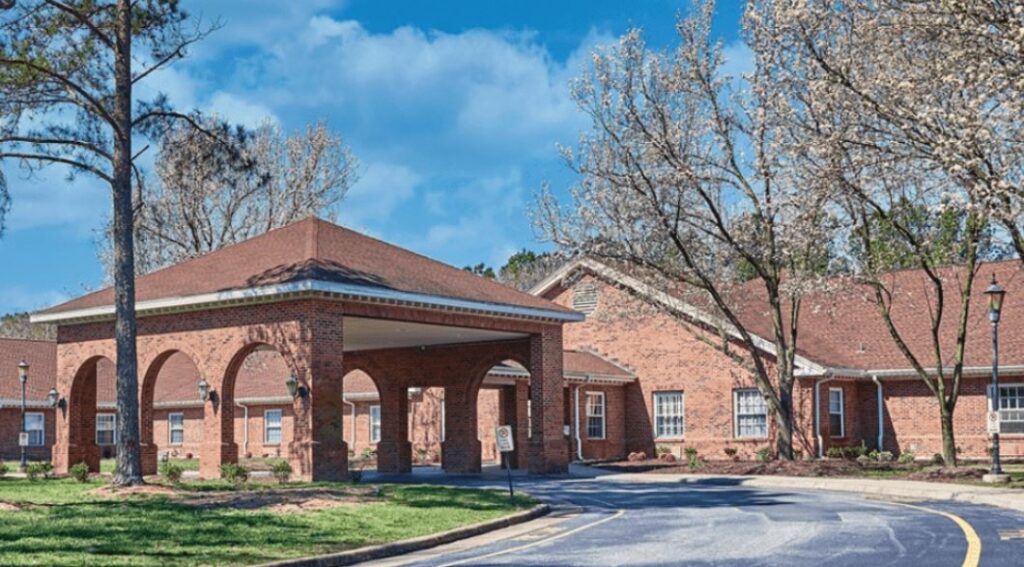
 Carrington Place of Chesapeake
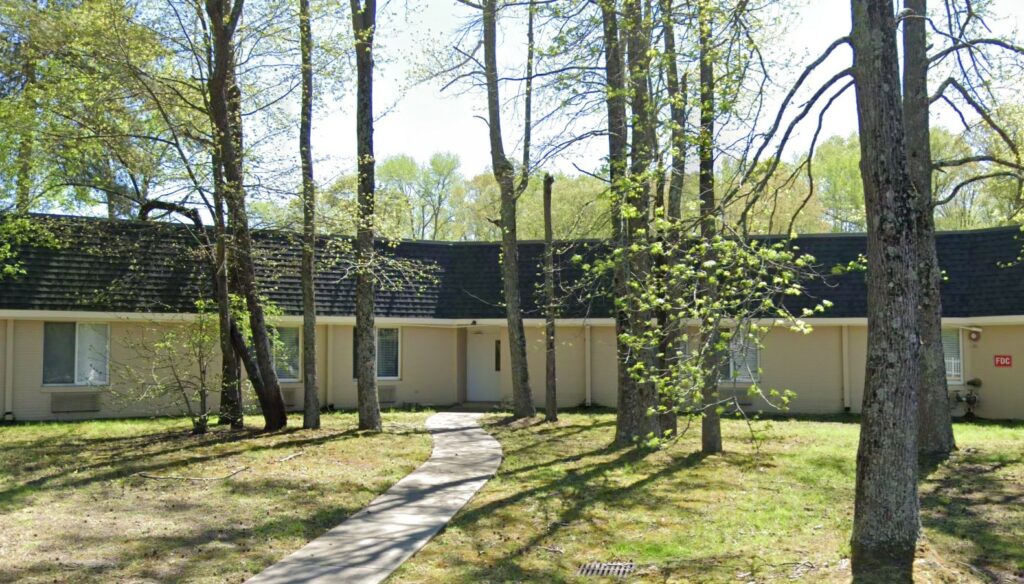
 Chesapeake Health and Rehabilitation Center
![]() 4.4 miles from city center — 4.1 miles to nearest hospital (Bon Secours Maryview Medical Center)
4.4 miles from city center — 4.1 miles to nearest hospital (Bon Secours Maryview Medical Center)
![]() 1017 George Washington Hwy N, Chesapeake, VA 23323
1017 George Washington Hwy N, Chesapeake, VA 23323
Add your location
Source: CMS Payroll-Based Journal (Q2 2025)
| Role ⓘ | Count ⓘ | Avg Shift (hrs) ⓘ | Uses Contractors? ⓘ |
|---|---|---|---|
| Registered Nurse | 7 | 9.7 | No |
| Licensed Practical Nurse | 26 | 9.2 | No |
| Certified Nursing Assistant | 49 | 9.3 | No |
| Role ⓘ | Employees ⓘ | Contractors ⓘ | Total Staff ⓘ | Total Hours ⓘ | Days Worked ⓘ | % of Days ⓘ | Avg Shift (hrs) ⓘ |
|---|---|---|---|---|---|---|---|
| Certified Nursing Assistant | 49 | 0 | 49 | 14,491 | 91 | 100% | 9.3 |
| Licensed Practical Nurse | 26 | 0 | 26 | 8,567 | 91 | 100% | 9.2 |
| Registered Nurse | 7 | 0 | 7 | 1,558 | 88 | 97% | 9.7 |
| Clinical Nurse Specialist | 4 | 0 | 4 | 1,159 | 78 | 86% | 7.1 |
| RN Director of Nursing | 4 | 0 | 4 | 1,094 | 73 | 80% | 8.4 |
| Speech Language Pathologist | 4 | 0 | 4 | 789 | 78 | 86% | 5.7 |
| Administrator | 2 | 0 | 2 | 552 | 64 | 70% | 8 |
| Nurse Practitioner | 1 | 0 | 1 | 504 | 63 | 69% | 8 |
| Physical Therapy Aide | 3 | 0 | 3 | 498 | 68 | 75% | 5.1 |
| Dental Services Staff | 1 | 0 | 1 | 496 | 62 | 68% | 8 |
| Other Dietary Services Staff | 1 | 0 | 1 | 432 | 54 | 59% | 8 |
| Respiratory Therapy Technician | 2 | 0 | 2 | 332 | 67 | 74% | 4.5 |
| Physical Therapy Assistant | 3 | 0 | 3 | 288 | 62 | 68% | 4.6 |
| Qualified Social Worker | 4 | 0 | 4 | 202 | 76 | 84% | 2.6 |
Virginia average 4.2
Last Health inspection on Sep 2025
Health citations are formal notices following inspections when they fail to comply with safety and care standards.
50 of 58 citations resulted from standard inspections; and 8 of 58 resulted from complaint investigations.
Virginia average: 0.4
Virginia average: 1
Data sourced from CMS Health Deficiencies reports. Citation severity codes range from A (least serious) to L (most serious). Immediate Jeopardy (J-L) citations indicate situations where the facility's noncompliance has placed residents at risk of death or serious harm.
Source: CMS Long-Term Care Facility Characteristics (Data as of Jan 2026)
Active councils help families stay involved in care decisions and facility operations.
These measures show how residents usually do over time at this home, based on health outcomes and preventive care.
Virginia average: 10.1
Virginia average: 19.7
Virginia average: 16.8%
Virginia average: 19.7%
Virginia average: 22.6%
Virginia average: 3.6%
Virginia average: 5.4%
Virginia average: 1.5%
Virginia average: 5.9%
Virginia average: 14.9%
Virginia average: 12.9%
Virginia average: 91.3%
Virginia average: 94.0%
Virginia average: 74.9%
Virginia average: 1.2%
Virginia average: 73.6%
Quality measures are calculated from Minimum Data Set (MDS) assessments. For most measures, lower percentages indicate better care quality.
Historical financial and operational data for Carrington Place of Chesapeake based on CMS SNF Cost Reports.
Loading trend charts...
Care Cost Calculator: See Prices in Your Area
Nursing Home Data Explorer
Don’t Wait Too Long: 7 Red Flag Signs Your Parent Needs Assisted Living Now
The True Cost of Assisted Living in 2025 – And How Families Are Paying For It
Understanding Senior Living Costs: Pricing Models, Discounts & Financial Assistance

We help families find affordable senior communities and unlock same day discounts, Medicaid, and Medicare options tailored to your needs.
Contact us Today
Touring a community? Use this expert-backed checklist to stay organized, ask the right questions, and find the perfect fit.
We'll send you a PDF version of the touring checklist.


