Total health inspections
4
Florida average 4.3
Last Health inspection on Jan 2025

We arrange tours, appointments, and even moving support so you don’t have to
Thank you for your interest!
Our team will be in touch shortly to help with next steps.
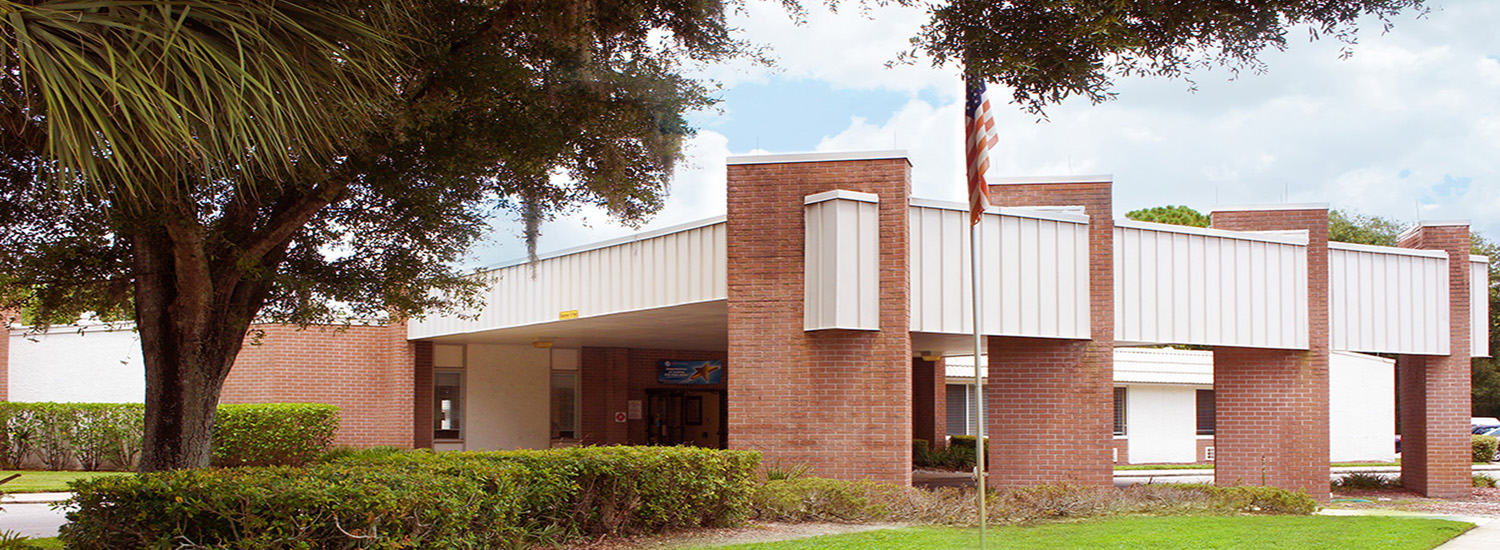
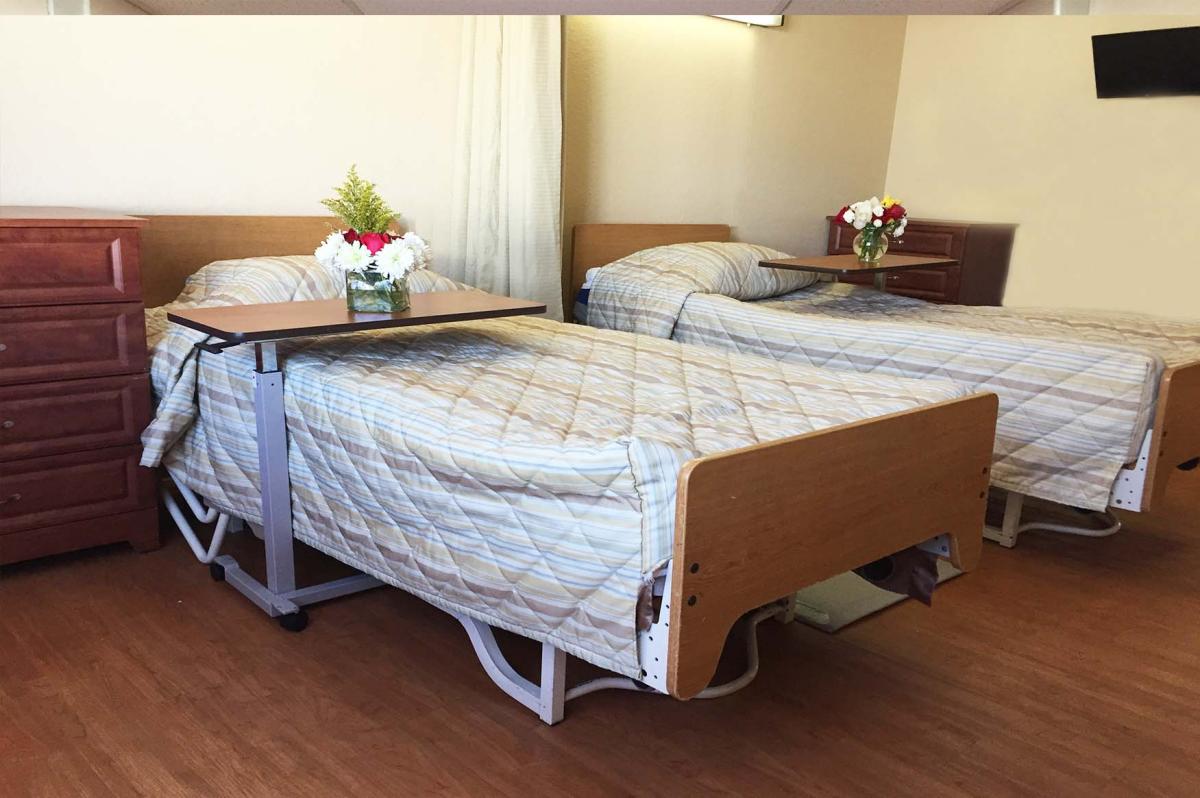


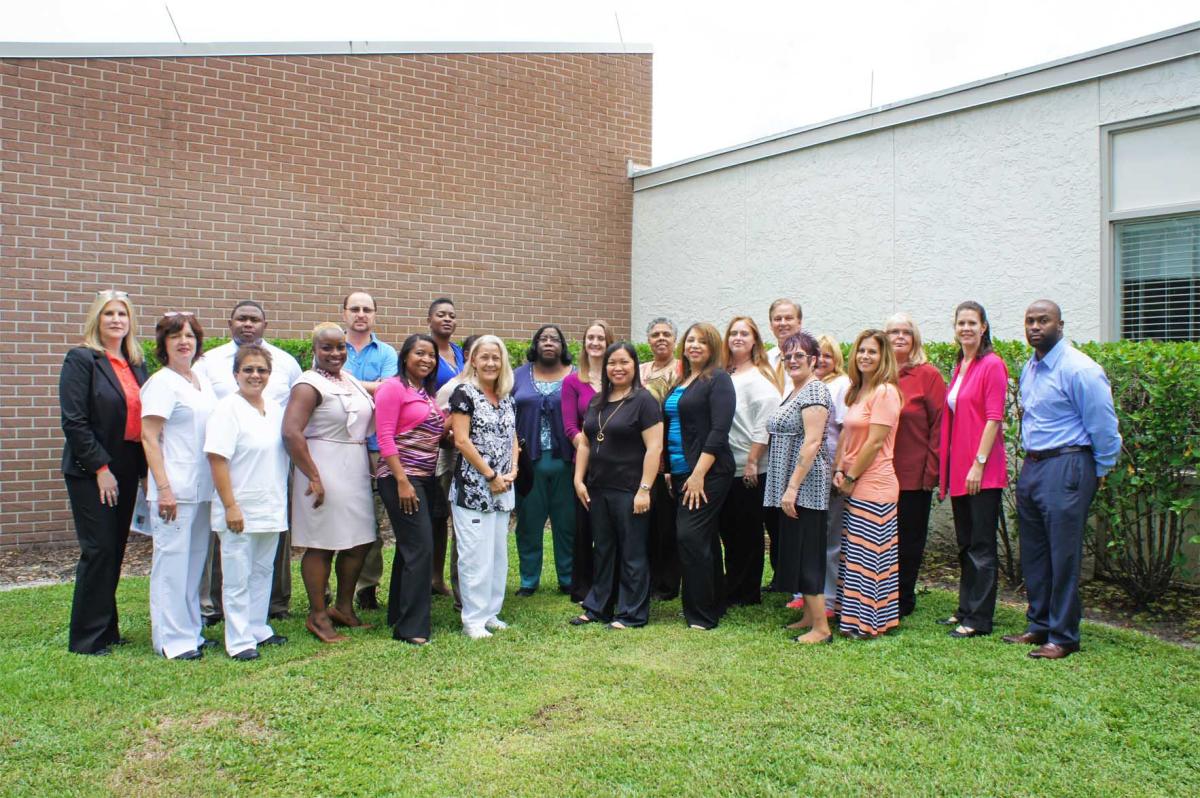

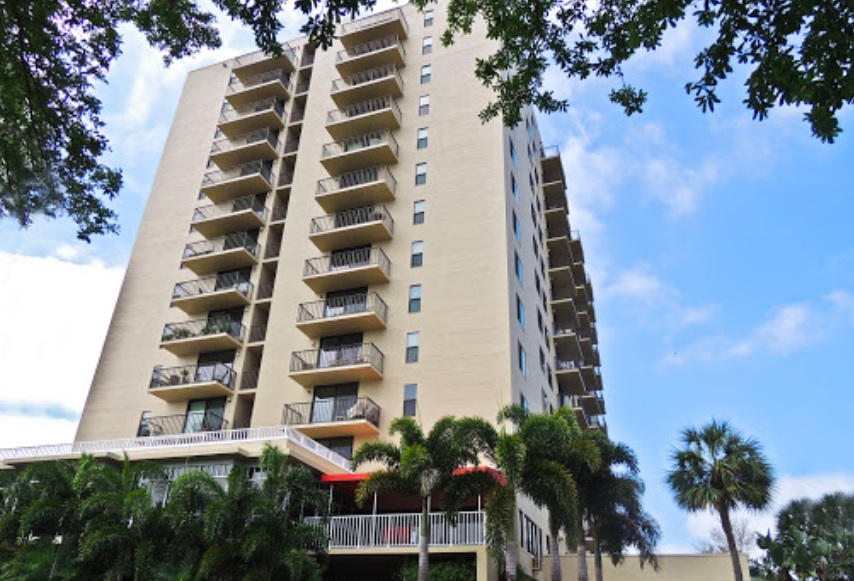
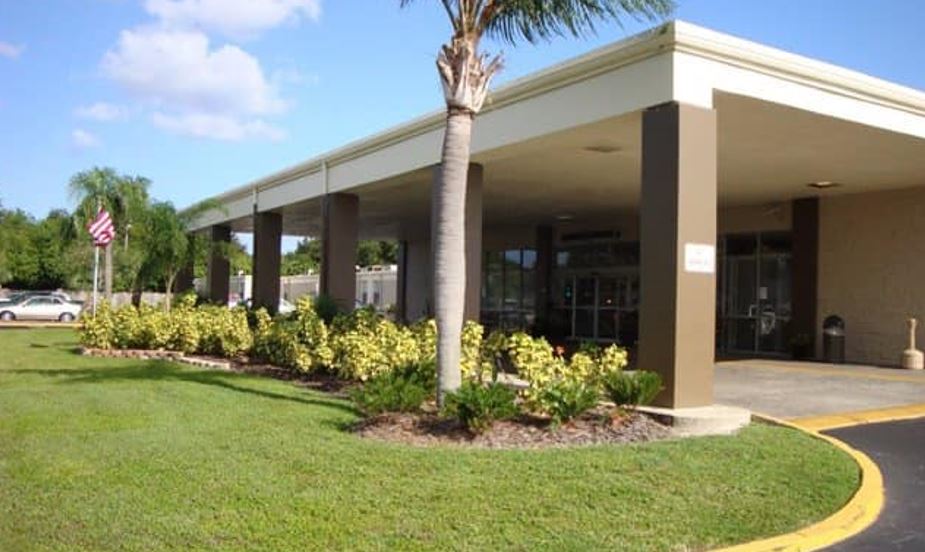
Providing quality services to meet the care needs of each individual, Carrollwood Care Center is a senior living community in Tampa, Florida. It is a nursing home that has offered post-acute services, skilled nursing services, rehabilitation programs, restorative programs, respite care, and palliative care for over two decades. It highlights its ability to thoughtfully create individual treatment plans in an efficient and compassionate manner.
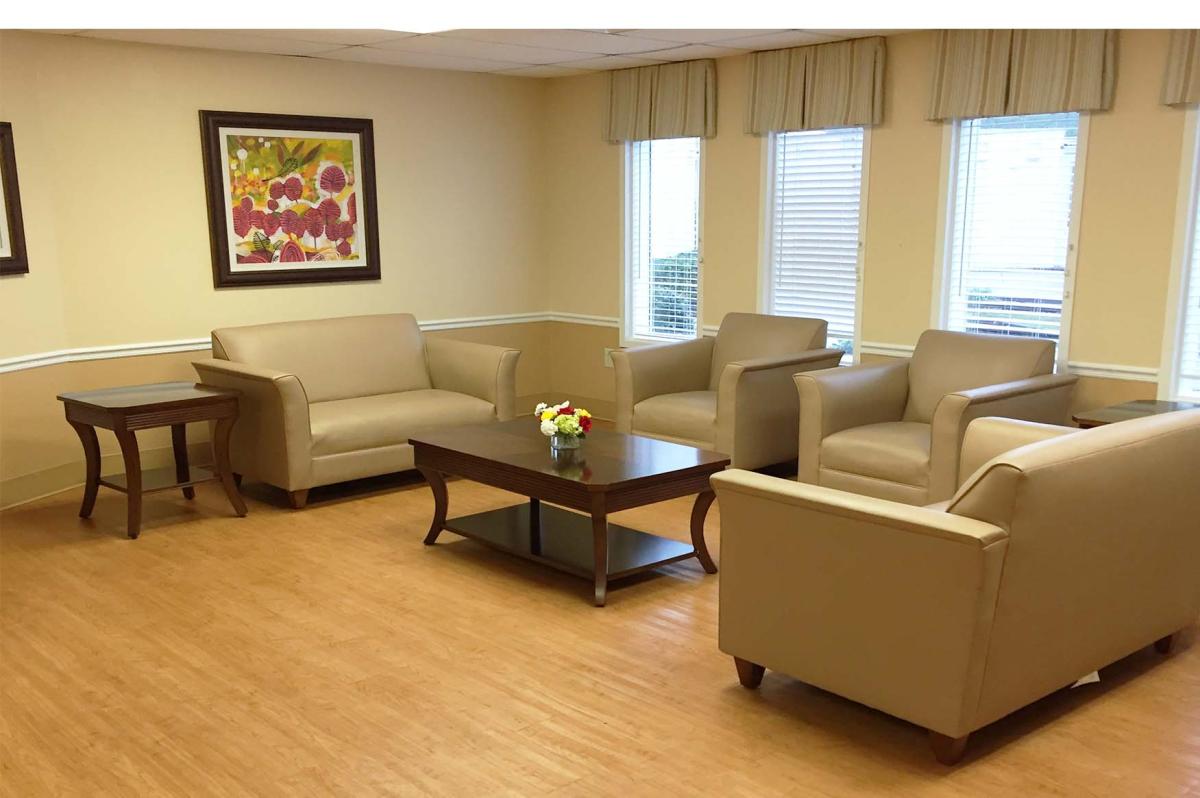
This community endeavors to be responsive to the evolving needs of its residents and be able to cater to such changes in an environment that exceeds customers’ expectations. A testament to this commitment are the recognitions they received in 2019 which include the National Quality Bronze Award from the AHCA/NCAL and the Governor’s Gold Seal Award.
Melanie Y. Wilson is a highly motivated and adaptable nursing home administrator with over 15 years of long-term care and skilled nursing facility experience. She has led the team at Carrollwood Care Center for 3 years, fostering a positive work culture. Melanie holds a Bachelor of Science in Gerontology from the University of South Florida and an MBA from Nova Southeastern University. She enjoys spending time with family, meditation, exploring new cuisines, and volunteer work.
Offers a balance of services and community atmosphere.
Occupancy is moderate, suggesting balanced demand.
This home supports both short-term rehab and long-term care, with residents staying for a wide range of durations.
43% of new residents, usually for short-term rehab.
49% of new residents, often for short stays.
8% of new residents, often for long-term daily care.
Florida average 4.3
Last Health inspection on Jan 2025
Florida average 19.7
Florida average 4.48
Health citations are formal notices following inspections when they fail to comply with safety and care standards.
18 of 21 citations resulted from standard inspections; and 3 of 21 resulted from complaint investigations.
Florida average: 0.8
Florida average: 0.4
Data sourced from CMS Health Deficiencies reports. Citation severity codes range from A (least serious) to L (most serious). Immediate Jeopardy (J-L) citations indicate situations where the facility's noncompliance has placed residents at risk of death or serious harm.
Nursing Home Licensed facility providing 24/7 skilled nursing care for residents with complex, ongoing medical needs. Staffed by RNs, LPNs, and CNAs. Inspected and star-rated annually by CMS. Accepts Medicare (short-term rehab) and Medicaid (long-term care).
Assisted Living A licensed, long-term care setting for seniors or individuals with disabilities who need help with daily activities — like bathing, dressing, and medication management — but not 24-hour skilled nursing. Offers housing, meals, and around-the-clock support while aiming to maximize resident independence.
![]() 10.7 miles from city center — 5.61 miles to nearest hospital (AdventHealth Carrollwood Hospital)
10.7 miles from city center — 5.61 miles to nearest hospital (AdventHealth Carrollwood Hospital)
![]() 15002 Hutchison Rd, Tampa, FL 33625
15002 Hutchison Rd, Tampa, FL 33625
Add your location
This data corresponds to Q2 2025 and is based on CMS Payroll-Based Journal.
Florida average ratio: 1.52:1
Florida average: 7.9 hours
Manages medical care and health needs.
This role is partially covered by contractors.
Assists with medical care and medications.
No contractors work on this role.
Helps with daily care and mobility.
No contractors work on this role.
Total hours from contractors
6,359 contractor hours this quarter
| Certified Nursing Assistant | 53 | 0 | 53 | 21,110 | 91 | 100% | 8.4 |
| Licensed Practical Nurse | 17 | 0 | 17 | 6,354 | 91 | 100% | 8.7 |
| Clinical Nurse Specialist | 7 | 0 | 7 | 2,940 | 90 | 99% | 8.2 |
| Registered Nurse | 10 | 1 | 11 | 1,947 | 91 | 100% | 7.2 |
| Speech Language Pathologist | 0 | 13 | 13 | 1,673 | 90 | 99% | 6.8 |
| Physical Therapy Aide | 0 | 7 | 7 | 1,623 | 90 | 99% | 7.3 |
| Physical Therapy Assistant | 0 | 4 | 4 | 1,166 | 75 | 82% | 6.7 |
| Respiratory Therapy Technician | 0 | 7 | 7 | 900 | 71 | 78% | 6.1 |
| Qualified Social Worker | 0 | 6 | 6 | 884 | 67 | 74% | 6.8 |
| RN Director of Nursing | 3 | 0 | 3 | 687 | 60 | 66% | 8.4 |
| Administrator | 1 | 0 | 1 | 472 | 59 | 65% | 8 |
| Mental Health Service Worker | 1 | 0 | 1 | 464 | 58 | 64% | 8 |
| Dietitian | 1 | 0 | 1 | 442 | 57 | 63% | 7.7 |
| Nurse Practitioner | 1 | 0 | 1 | 384 | 51 | 56% | 7.5 |
| Other Dietary Services Staff | 1 | 0 | 1 | 252 | 41 | 45% | 6.2 |
| Occupational Therapy Aide | 1 | 0 | 1 | 228 | 34 | 37% | 6.7 |
| Therapeutic Recreation Specialist | 0 | 2 | 2 | 53 | 16 | 18% | 3.3 |
| Occupational Therapy Assistant | 0 | 2 | 2 | 50 | 9 | 10% | 5.5 |
| Medical Director | 0 | 1 | 1 | 3 | 2 | 2% | 1.3 |
Source: CMS Long-Term Care Facility Characteristics (Data as of Jan 2026)
Residents meet regularly to discuss policies, care quality, and activities
Organized group of residents that meets regularly to discuss facility policies, quality of life, and activities.
Data sourced from CMS Long-Term Care Facility Characteristics quarterly report. Payer mix reflects the current resident census by primary payment source.
These measures show how residents usually do over time at this home, based on health outcomes and preventive care.
Florida average: 7.4
Florida average: 12.4
Florida average: 10.5%
Florida average: 12.9%
Florida average: 13.5%
Florida average: 2.6%
Florida average: 5.4%
Florida average: 0.9%
Florida average: 6.0%
Florida average: 3.3%
Florida average: 8.0%
Florida average: 97.7%
Florida average: 99.2%
Florida average: 2.10
Florida average: 1.18
Florida average: 94.0%
Florida average: 1.5%
Florida average: 94.7%
Florida average: 26.2%
Florida average: 9.3%
Florida average: 0.8%
Florida average: 53.7%
Florida average: 50.6%
Quality measures are calculated from Minimum Data Set (MDS) assessments. For most measures, lower percentages indicate better care quality.
Federal penalties imposed by CMS for regulatory violations, including civil money penalties (fines) and denials of payment for new Medicare/Medicaid admissions.
Source: CMS Penalties Database (Data as of Jan 2026)
Florida average: $72K
Florida average: 2.6
Florida average: 0.1
Penalties are imposed by CMS for violations of federal nursing home regulations.
Last updated: Jan 2026
Historical financial and operational data for Carrollwood Care Center based on CMS SNF Cost Reports.
Loading trend charts...
Care Cost Calculator: See Prices in Your Area
Nursing Home Data Explorer
Don’t Wait Too Long: 7 Red Flag Signs Your Parent Needs Assisted Living Now
The True Cost of Assisted Living in 2025 – And How Families Are Paying For It
Understanding Senior Living Costs: Pricing Models, Discounts & Financial Assistance

Touring a community? Use this expert-backed checklist to stay organized, ask the right questions, and find the perfect fit.
We'll send you a PDF version of the touring checklist.