


Castle Peak Assisted Living
Nursing Home · Colorado, CO

Castle Peak Assisted Living
Nursing Home · Colorado, CO
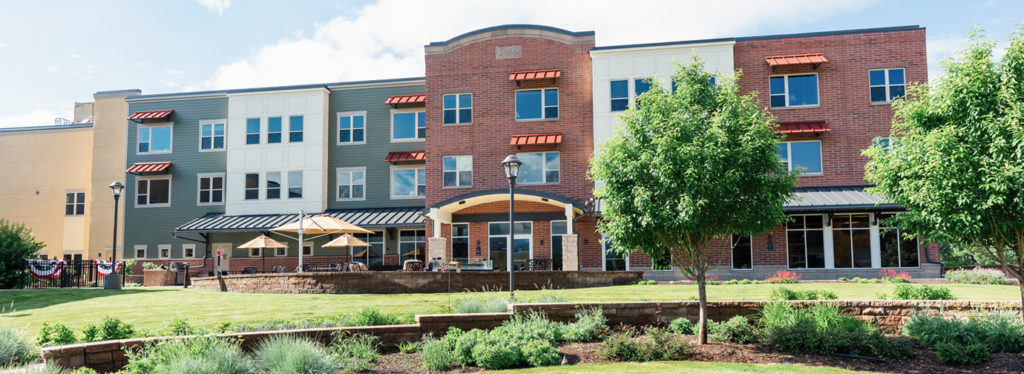
Castle Peak is a nonprofit senior life and rehabilitation community located in Eagle, Colorado. It offers a variety of living options including assisted living, skilled nursing, memory care, and spiritual care. The community is designed to provide a wellness-focused environment with numerous amenities and services to support residents' needs.
30-bed community Rank #427 / 542Bed count — State benchmarkedThis home is ranked 427th out of 542 homes in Colorado. Shows this facility's certified or reported bed count compared to other Colorado SNFs. Larger communities may offer more amenities, programs, and on-site services for residents and families.Click the rank badge to see the full State ranking.Click here to see the full State ranking.
A moderately sized community that may balance personal attention with shared amenities and social activities.
Walk Score: 55 / 100 Rank #419 / 875Walk Score — State benchmarkedThis home is ranked 419th out of 875 homes in Colorado. Shows how walkable this facility's neighborhood is compared to the average Walk Score across Colorado SNFs. Higher scores benefit residents, families, and staff.Click the rank badge to see the full State ranking.Click here to see the full State ranking.
Moderately walkable. Some errands can be accomplished on foot, with a mix of nearby amenities.
About this community
Facility TypeAssisted Living Residence (licensed Only)
StatusActive
CMS Certification Number065420
Castle Peak Assisted Living is administrated by Jesse Cornish.
Owner NameCastle Peak Senior Care LLC
Rehabilitation Services
Respite Care
Short-Term Rehab
24-Hour Staffing
Skilled Nursing Short-Term Care
Skilled Nursing Long-Term Care
Spiritual Care
Emergency Response Systems
Delicious Meals
Scheduled Outings For Shopping And Entertainment
Lounges
Beauty Salon/Barber Shop
Exercise Room
Walking Paths
Full Calendar Of Clubs
Classes And Events
Specific ProgramsLife at Castle Peak, Donate Now
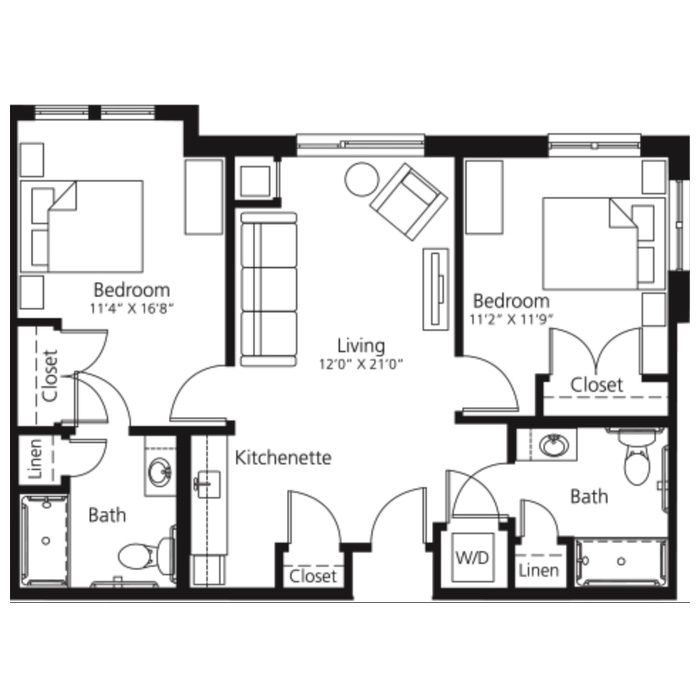
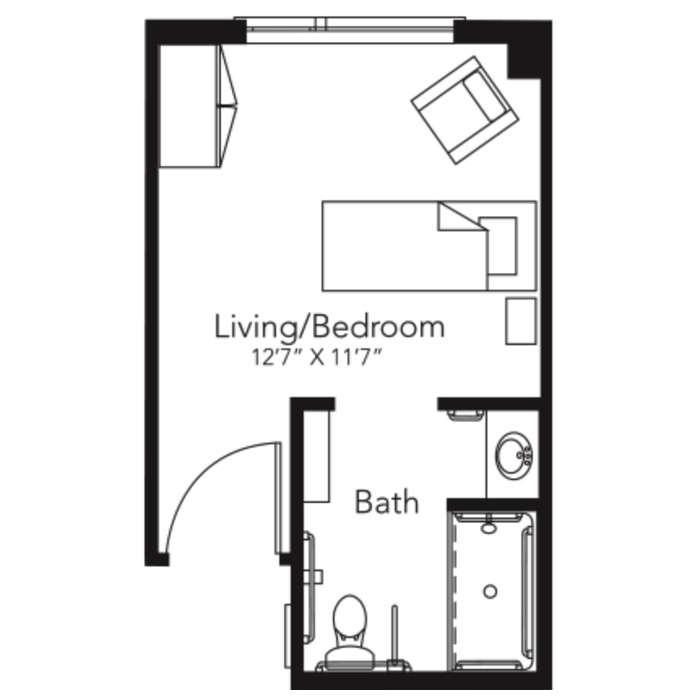
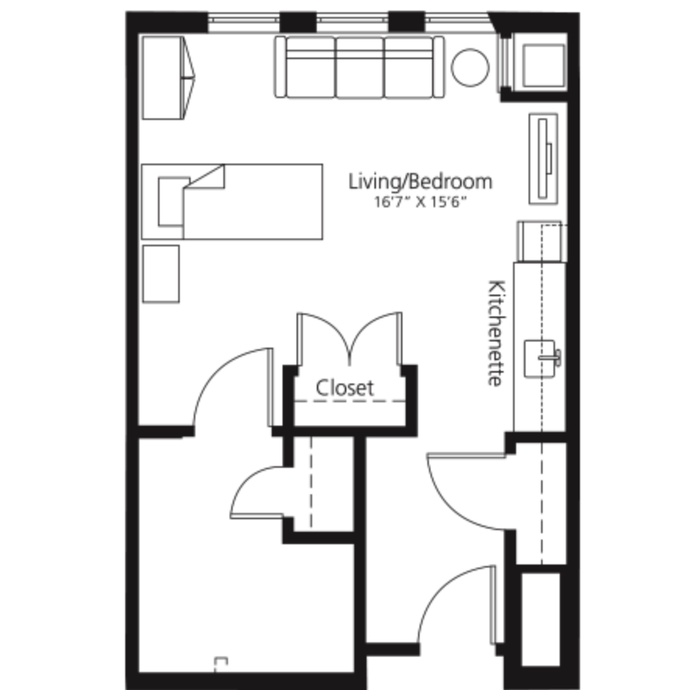
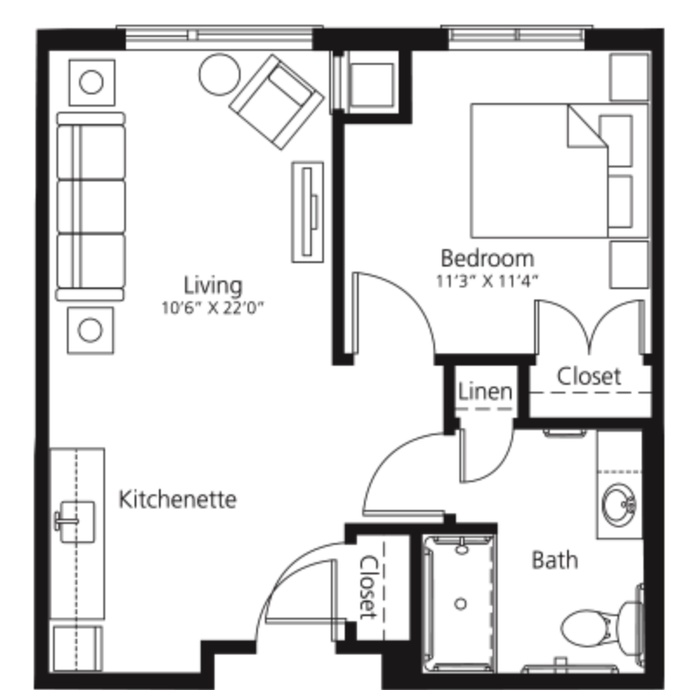
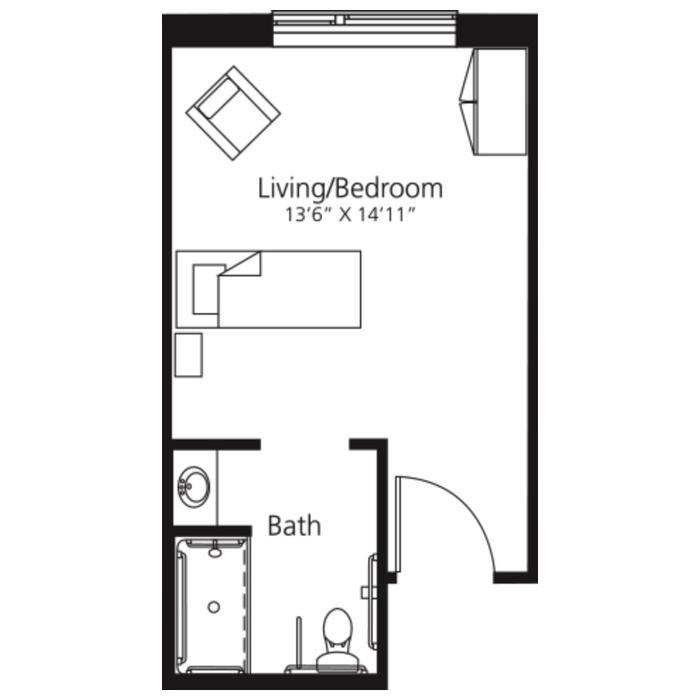
Living Spaces & Floor Plans for Castle Peak Assisted Living
Studio Suite
Download PDFDeluxe Studio Suite
Download PDFSuite Apartment
Download PDFOne Bedroom
Download PDFTwo Bedroom
Download PDFPlaces of interest near Castle Peak Assisted Living
![]() 0.0 miles from city center
0.0 miles from city center
![]() Estimated distance in miles from Eagle's city center to Castle Peak Assisted Living's address, calculated via Google Maps.
Estimated distance in miles from Eagle's city center to Castle Peak Assisted Living's address, calculated via Google Maps.
Calculate Travel Distance to Castle Peak Assisted Living
Add your location
Financial Assistance for
Nursing Home in Colorado
Castle Peak Assisted Living is located in EAGLE, Colorado.
Here are the financial assistance programs available to residents in Colorado.
Compare Nursing Home around Colorado
The information below is reported by the Colorado Department of Public Health and Environment, Health Facilities Division.
Filter by care type
| Centre Avenue Health and Rehab Facility |
NH Nursing Home Licensed facility providing 24/7 skilled nursing care for residents with complex, ongoing medical needs. Staffed by RNs, LPNs, and CNAs. Inspected and star-rated annually by CMS. Accepts Medicare (short-term rehab) and Medicaid (long-term care).
AL Assisted Living A licensed, long-term care setting for seniors or individuals with disabilities who need help with daily activities — like bathing, dressing, and medication management — but not 24-hour skilled nursing. Offers housing, meals, and around-the-clock support while aiming to maximize resident independence. | Fort Collins (Centre Avenue) | 90 | 88.9% | +16% | 4.33 | +16% | +12% | $8.0k | 5 | 2.5 | 2 | 82 | A+ | 73 | - | $16.8M | $10.2M | 60.6% | 65377 | ||||
| Fairacres Manor |
NH Nursing Home Licensed facility providing 24/7 skilled nursing care for residents with complex, ongoing medical needs. Staffed by RNs, LPNs, and CNAs. Inspected and star-rated annually by CMS. Accepts Medicare (short-term rehab) and Medicaid (long-term care).
AL Assisted Living A licensed, long-term care setting for seniors or individuals with disabilities who need help with daily activities — like bathing, dressing, and medication management — but not 24-hour skilled nursing. Offers housing, meals, and around-the-clock support while aiming to maximize resident independence.
N Nursing
RC Respite Care Short-term temporary care — days to weeks — to give family caregivers a break. Full care provided during the stay. Often used after hospitalization or to trial a facility before a permanent placement decision. | Greeley (18Th Avenue) | 116 | 89.4% | +17% | 4.08 | +27% | +6% | $0 | 17 | 5.7 | 1 | 109 | - | 57 | Jill Nelson | $16.4M | $8.6M | 52.6% | 65211 | ||||
| The Center at Centennial |
NH Nursing Home Licensed facility providing 24/7 skilled nursing care for residents with complex, ongoing medical needs. Staffed by RNs, LPNs, and CNAs. Inspected and star-rated annually by CMS. Accepts Medicare (short-term rehab) and Medicaid (long-term care).
AL Assisted Living A licensed, long-term care setting for seniors or individuals with disabilities who need help with daily activities — like bathing, dressing, and medication management — but not 24-hour skilled nursing. Offers housing, meals, and around-the-clock support while aiming to maximize resident independence. | Colorado Springs (West Colorado Springs) | 80 | 90.2% | +18% | 4.04 | +14% | +5% | $0 | 21 | 4.2 | 3 | 64 | - | 45 | The Medical Center LLC | $29.3M | $9.3M | 31.8% | 65390 |
Frequently Asked Questions about Castle Peak Assisted Living
Who is the owner of Castle Peak Assisted Living?
The legal owner and operator of Castle Peak Assisted Living is Castle Peak Senior Care Llc.
Is Castle Peak Assisted Living in a walkable area?
Castle Peak Assisted Living has a walk score of 55. Moderately walkable. Some errands can be accomplished on foot, with a mix of nearby amenities.
Does Castle Peak Assisted Living have different floorplan options?
Yes — see the floorplan options available at Castle Peak Assisted Living on this page.
Who is the administrator of Castle Peak Assisted Living?
Jesse Cornish is the administrator of Castle Peak Assisted Living.
How many beds does Castle Peak Assisted Living have?
Castle Peak Assisted Living has 30 beds.
Are there photos of Castle Peak Assisted Living?
Yes — there are 6 photos of Castle Peak Assisted Living in the photo gallery on this page.
What is the address of Castle Peak Assisted Living?
Castle Peak Assisted Living is located at 195 FREESTONE RD.
Guides for Better Senior Living
Care Cost Calculator: See Prices in Your Area
Nursing Home Data Explorer
Don’t Wait Too Long: 7 Red Flag Signs Your Parent Needs Assisted Living Now
The True Cost of Assisted Living in 2025 – And How Families Are Paying For It
Understanding Senior Living Costs: Pricing Models, Discounts & Financial Assistance
Contact Us

Published on
Updated on
Feedback
Write a review for Castle Peak Assisted Living
Rate your overall experience with this community
Explore Open Rooms
1
Contact details
2
What type of senior care service are you looking for?
3
What budget do you have in mind for senior care?
4
How soon do you need to find care?
5
Additional details
Thank you for your interest!
Our team will be in touch shortly to help with next steps.
Need Help?
Let us help you or a loved one find the perfect senior home.
