Cearu Medical Resort
Nursing Home & Assisted Living · Tulsa, OK
CMS overall rating Info CMS (the Centers for Medicare & Medicaid Services) is the federal agency that rates nursing home quality. Its Overall Rating runs from 1 to 5 stars, combining health inspections, staffing, and quality measures, with inspections weighted most heavily.

Cearu Medical Resort

Nursing Home & Assisted Living · Tulsa, OK
CMS overall rating Info CMS (the Centers for Medicare & Medicaid Services) is the federal agency that rates nursing home quality. Its Overall Rating runs from 1 to 5 stars, combining health inspections, staffing, and quality measures, with inspections weighted most heavily.
Calculator: See prices in your area
Cearu Medical Resort accepts Medicare, Medicaid, and private pay.

Overview of Cearu Medical Resort

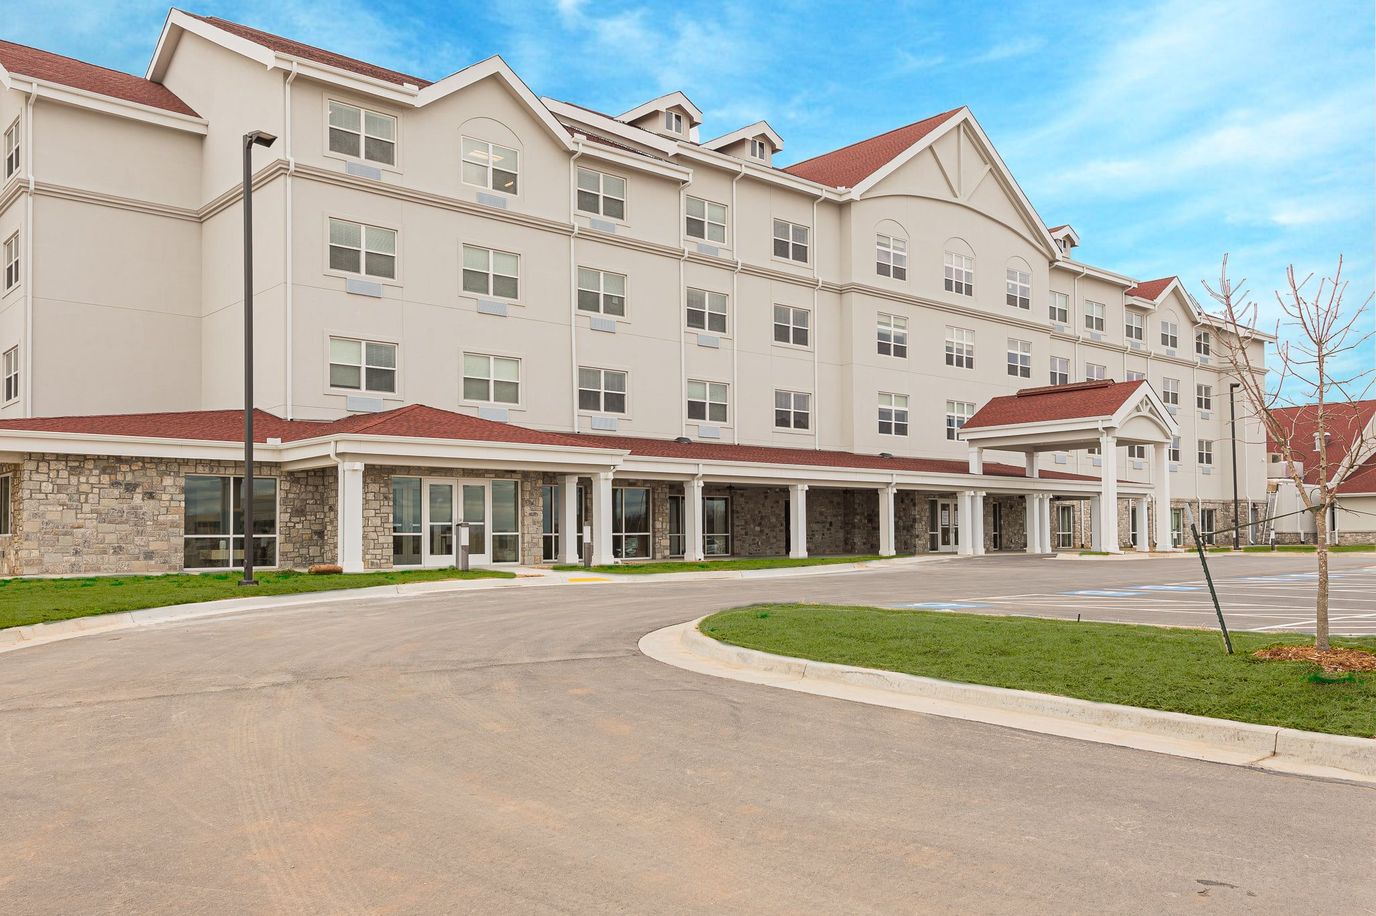
Cearu Medical Resort prides itself on offering a luxurious living experience with top-notch healthcare services. The home delivers short-term acute care services, along with comprehensive rehabilitation and wound care. They also provide hospice services for those who require it. Located in Hillcrest, it is close to Hillcrest Hospital South and the Veterans Administration Outpatient Medical Center. 
Residents can enjoy resort-like living with access to hospital services, including a therapy gym with the latest equipment. Accommodations have exquisite furnishings, ensuring that guests are always comfortable and secured. In addition, the home offers complimentary Wi-Fi and a bistro to make the stay even more pleasant. For acute care or rehabilitation services punctuated by an experience of a luxurious healthcare facility, choose Cearu Medical Resort.

(918) 965-0101

Quality ratings

Measured by Centers for Medicare & Medicaid Services (CMS)

Overall rating Info The Overall CMS Rating combines results from health inspections, staffing levels and quality measures. Health inspections carry the most weight. Staffing and quality scores can increase or decrease the final rating based on performance compared to state and national standards.
▲ 52.2% Above OK avg. ▲ 52.2% Above OK avg.OK average: 2.6Click the badge to see the full State ranking.Click here to see the full State ranking.
Health Inspection Info Based on the results of the facility's three most recent standard inspections and any complaint investigations. CMS reviews the number, scope, and severity of deficiencies, with more recent findings weighted more heavily.
▲ 44.6% Above OK avg. ▲ 44.6% Above OK avg.OK average: 2.8Click the badge to see the full State ranking.Click here to see the full State ranking.
Staffing Info Measures average nursing staff hours per resident per day, including Registered Nurses (RNs) and total nursing staff. Ratings are adjusted based on the level of care residents require and are compared to state and national benchmarks.
▼ 22.9% Below OK avg. ▼ 22.9% Below OK avg.OK average: 2.6Click the badge to see the full State ranking.Click here to see the full State ranking.
Quality Measures Info Based on clinical and physical health indicators reported to CMS, such as hospital readmissions, falls, pressure ulcers, and improvements in mobility. These measures reflect how well residents' health needs are being managed.
▲ 41.4% Above OK avg. ▲ 41.4% Above OK avg.OK average: 2.8Click the badge to see the full State ranking.Click here to see the full State ranking.

Staffing hours breakdown

Info Daily nursing hours per resident by staff type, reported to CMS. Higher is generally better — compare this facility to state and national averages to see where staffing stands.

Hours per resident per day — compared to Oklahoma state averages

Total nursing care / resident Info This home is ranked 36th out of 51 homes in Oklahoma for nurse hours. Total adjusted nursing hours per resident per day, combining RN, LPN, and aide time. CMS adjusts this for case-mix so facilities can be fairly compared.
4h 9m per day
Rank #36 / 51Nurse hours — State benchmarkedThis home is ranked 36th out of 51 homes in Oklahoma. Shows adjusted nurse hours per resident per day benchmarked to the Oklahoma average, with a ranking across 51 Oklahoma facilities. More hours mean more direct care. The national average is about 3.5 hrs; below 3.0 is a red flag.Rankings are based only on facilities in Oklahoma that report data for that category. Facilities without available data are excluded from the ranking.Click the rank badge to see the full State ranking.Click here to see the full State ranking.
This facility Oklahoma avg (4h 34m per day)
vs Oklahoma avg
-9%

1 of 6 metrics below state avg

Standout metric Physical Therapist is +525% above state avg
Staff typeHours / Day / Residentvs state avg
Registered Nurse (RN) Info RNs hold the highest nursing license and can assess residents, interpret test results, and direct care plans. More RN hours per day often signals stronger clinical oversight and faster response to health changes. 27m per day ▲ 36% State avg: 20m per day · National avg: 41m per day
LPN / LVN Info Licensed Practical Nurses (LPNs) or Licensed Vocational Nurses (LVNs) deliver routine hands-on care — medication administration, wound dressing, and monitoring vital signs. They work under RN supervision and make up a large share of daily bedside care. 1h 27m per day ▲ 56% State avg: 56m per day · National avg: 52m per day
Nurse Aide Info Certified Nurse Aides (CNAs) provide the most direct day-to-day assistance: bathing, dressing, feeding, and mobility. Nurse aide hours are typically the largest staffing category and directly affect residents' quality of life. 2h 34m per day ■ Avg State avg: 2h 34m per day · National avg: 2h 21m per day
Weekend Total Nursing Info Combined nursing hours (RN + LPN + Nurse Aide) per resident per day on weekends. Staffing often drops on weekends — this figure reveals whether the facility maintains adequate coverage outside of weekday hours. 4h 4m per day ▲ 17% State avg: 3h 29m per day · National avg: 3h 26m per day
Physical Therapist Info Hours per resident per day provided by licensed Physical Therapists (PTs) or PT Assistants. PT services help residents recover mobility after injury or illness and are especially important for post-acute (short-stay) rehabilitation. 6m per day ▲ 525% State avg: 1m per day · National avg: 4m per day
Weekend RN Info Registered nurse hours specifically on weekends. Facilities sometimes reduce RN presence on Saturdays and Sundays — a low weekend RN figure compared to weekday hours can indicate reduced clinical oversight when most administrative staff are absent. 14m per day ▼ 17% State avg: 17m per day · National avg: 29m per day

Capacity and availability

This home usually has availability

Higher occupancy than the Oklahoma average: 60.6%
Occupancy rate
75.7% Rank #67 / 132Occupancy rate — State benchmarkedThis home is ranked 67th out of 132 homes in Oklahoma. Shows this facility's occupancy rate versus the Oklahoma average, with its Statewide rank out of 132. Higher occupancy signals strong local demand and financial stability.Rankings are based only on facilities in Oklahoma that report data for that category. Facilities without available data are excluded from the ranking.Click the rank badge to see the full State ranking.Click here to see the full State ranking.
Avg. Length of Stay
57 days
Bed community size
104-bed community Rank #27 / 141Bed count — State benchmarkedThis home is ranked 27th out of 141 homes in Oklahoma. Shows this facility's certified or reported bed count compared to other Oklahoma facilities. Larger communities may offer more amenities, programs, and on-site services for residents and families.Rankings are based only on facilities in Oklahoma that report data for that category. Facilities without available data are excluded from the ranking.Click the rank badge to see the full State ranking.Click here to see the full State ranking.
A larger shared setting that may offer more common spaces and organized community services.
Walk Score
Walk Score: 19 / 100 Rank #159 / 208Walk Score — State benchmarkedThis home is ranked 159th out of 208 homes in Oklahoma. Shows how walkable this facility's neighborhood is compared to the average Walk Score across Oklahoma facilities. Higher scores benefit residents, families, and staff.Rankings are based only on facilities in Oklahoma that report data for that category. Facilities without available data are excluded from the ranking.Click the rank badge to see the full State ranking.Click here to see the full State ranking.
Car-dependent. Most errands require a car, with limited nearby walkable options.

Contact Cearu Medical Resort

Staffing Data

Reporting period: October 1 – December 31, 2025 (Q4 2025). Source: CMS Payroll-Based Journal report.

Total staff 174
Employees 173
Contractors 1
Staff to resident ratio 1.85 : 1
15% more staff per resident than Oklahoma average
Oklahoma average ratio: 1.61 : 1 Oklahoma average ratio: 1.61 : 1See full Oklahoma ranking
Avg staff/day 72
Average shift 7.7 hours
6% worse than Oklahoma average
Oklahoma average: 8.2 hours Oklahoma average shift: 8.2 hoursSee full Oklahoma ranking
Total staff hours (quarter) 50,753

Nursing staff breakdown

Q4 2025 · Oct 1 – Dec 31 More info This data comes from the CMS Payroll-Based Journal report covering October 1 – December 31, 2025.
Registered Nurse

Manages medical care and health needs.

RN Staff Info All 8 RN Staff are full-time employees. No contractors work on this role. 8
Average shift length Info Average shift length. Calculated as total hours divided by days worked and average staff per day. 8.2 hours
Licensed Practical Nurse

Assists with medical care and medications.

LPN Staff Info All 39 LPN Staff are full-time employees. No contractors work on this role. 39
Average shift length Info Average shift length. Calculated as total hours divided by days worked and average staff per day. 8 hours
Certified Nursing Assistant

Helps with daily care and mobility.

CNA Staff Info All 66 CNA Staff are full-time employees. No contractors work on this role. 66
Average shift length Info Average shift length. Calculated as total hours divided by days worked and average staff per day. 7.4 hours

Contractor staffing

Q4 2025 · Oct 1 – Dec 31 More info This data comes from the CMS Payroll-Based Journal report covering October 1 – December 31, 2025.

Total hours from contractors

0.3%

158 contractor hours this quarter

Occupational Therapy Aide: 1

Staff by category

Q4 2025 · Oct 1 – Dec 31 More info This data comes from the CMS Payroll-Based Journal report covering October 1 – December 31, 2025.
Certified Nursing Assistant6606617,70492100%7.4
Licensed Practical Nurse3903911,82592100%8
Medication Aide/Technician190195,95792100%7.9
Speech Language Pathologist8082,2147784%7.7
Registered Nurse8082,1749199%8.2
Physical Therapy Aide7071,7558997%7.2
RN Director of Nursing3031,5786773%8.2
Dental Services Staff3031,5206672%8
Clinical Nurse Specialist3031,4966672%8
Qualified Social Worker4041,0947784%7.1
Respiratory Therapy Technician4049598087%6.9
Physical Therapy Assistant3038767784%7.1
Administrator1015206571%8
Nurse Practitioner1015126672%7.8
Other Dietary Services Staff4044115762%6.9
Occupational Therapy Aide0111584953%3.2
66 Certified Nursing Assistant
% of Days 100%
39 Licensed Practical Nurse
% of Days 100%
19 Medication Aide/Technician
% of Days 100%
8 Speech Language Pathologist
% of Days 84%
8 Registered Nurse
% of Days 99%
7 Physical Therapy Aide
% of Days 97%
3 RN Director of Nursing
% of Days 73%
3 Dental Services Staff
% of Days 72%
3 Clinical Nurse Specialist
% of Days 72%
4 Qualified Social Worker
% of Days 84%
4 Respiratory Therapy Technician
% of Days 87%
3 Physical Therapy Assistant
% of Days 84%
1 Administrator
% of Days 71%
1 Nurse Practitioner
% of Days 72%
4 Other Dietary Services Staff
% of Days 62%
1 Occupational Therapy Aide
% of Days 53%

Penalties and fines

Includes penalties issued in 2024

Federal penalties imposed by CMS for regulatory violations, including civil money penalties (fines) and denials of payment for new Medicare/Medicaid admissions.

Source: CMS Penalties Database (Data as of Jan 2026)

Total fines amount $17K Rank #37 / 53Federal fines — State benchmarkedThis home is ranked 37th out of 53 homes in Oklahoma. Shows this facility's cumulative CMS federal fine dollars versus the Oklahoma average among facilities with fines, and where it ranks among 53 facilities in the pool. Lower total dollars mean a better rank.Rankings are based only on facilities in Oklahoma that report data for that category. Facilities without available data are excluded from the ranking.Click the rank badge to see the full State ranking.Click here to see the full State ranking.
61% lower than Oklahoma average

Oklahoma average: $43K

Number of fines 1
57% fewer fines than Oklahoma average

Oklahoma average: 2.3

Payment Denials Info Serious action where Medicare and/or Medicaid temporarily stops payments for new residents until issues are fixed. 0
100% fewer payment denials than Oklahoma average

Oklahoma average: 0.4

Fines amount comparison
This facility $17K
Oklahoma average $43K
Penalty History

Penalties are imposed by CMS for violations of federal nursing home regulations.

1 penalty in the past 3 years

Oct 31, 2024 · $17K

Civil Money Penalty Info Fines imposed for noncompliance, which can be assessed per day or per instance of violation. Oct 31, 2024
$17K

Last updated: Jan 2026

Quality of care over time

These measures show how residents usually do over time at this home, based on health outcomes and preventive care.

High-risk clinical events score Info A composite score based on pressure ulcers, falls with injury, weight loss, walking ability decline, and activities of daily living decline. 12.5
41% worse than Oklahoma average

Oklahoma average: 8.9

Functional decline score Info A composite score based on activities of daily living decline, walking ability decline, and incontinence. 26.6
63% worse than Oklahoma average

Oklahoma average: 16.3

Long-stay resident measures
Below average Oklahoma avg: 3.7 Info CMS star rating based on long-stay quality measure performance. 5 stars = significantly above average, 1 star = significantly below average.
Need for Help with Daily Activities Increased Info Percent of long-stay residents whose need for help with daily activities has increased 21.9%
52% worse than Oklahoma average

Oklahoma average: 14.4%

Walking Ability Worsened Info Percent of long-stay residents whose ability to move independently worsened 27.1%
62% worse than Oklahoma average

Oklahoma average: 16.8%

Low Risk Residents with Bowel/Bladder Incontinence Info Percent of low risk long-stay residents who lose control of their bowels or bladder 30.7%
73% worse than Oklahoma average

Oklahoma average: 17.8%

Falls with Major Injury Info Percent of long-stay residents experiencing one or more falls with major injury 3.7%
15% better than Oklahoma average

Oklahoma average: 4.4%

High Risk Residents with Pressure Ulcers Info Percent of long-stay high risk residents with pressure ulcers 5.7%
8% worse than Oklahoma average

Oklahoma average: 5.2%

Urinary Tract Infection Info Percent of long-stay residents with a urinary tract infection 2.2%
27% better than Oklahoma average

Oklahoma average: 3.0%

Lost Too Much Weight Info Percent of long-stay residents who lose too much weight 4.0%
8% worse than Oklahoma average

Oklahoma average: 3.7%

Depressive Symptoms Info Percent of long-stay residents who have depressive symptoms 8.2%
145% worse than Oklahoma average

Oklahoma average: 3.3%

Antipsychotic Use Info Percent of long-stay residents who received an antipsychotic medication 8.7%
44% better than Oklahoma average

Oklahoma average: 15.5%

Pneumococcal Vaccine Info Percent of long-stay residents assessed and appropriately given the pneumococcal vaccine 98.9%
9% better than Oklahoma average

Oklahoma average: 90.6%

Influenza Vaccine Info Percent of long-stay residents assessed and appropriately given the seasonal influenza vaccine 93.3%
In line with Oklahoma average

Oklahoma average: 94.6%

Hospitalizations per 1,000 days Info Number of hospitalizations per 1,000 long-stay resident days. 2.03
11% better than Oklahoma average

Oklahoma average: 2.28

ED visits per 1,000 days Info Number of outpatient emergency department visits per 1,000 long-stay resident days. 1.23
58% better than Oklahoma average

Oklahoma average: 2.91

Short-stay resident measures
Above average Oklahoma avg: 2.9 Info CMS star rating based on short-stay quality measure performance. 5 stars = much above average, 1 star = much below average.
Pneumococcal Vaccine Info Percent of short-stay residents assessed and appropriately given the pneumococcal vaccine 96.5%
29% better than Oklahoma average

Oklahoma average: 75.0%

Antipsychotic medication increase Info Percent of short-stay residents who newly received an antipsychotic medication 0.2%
90% better than Oklahoma average

Oklahoma average: 2.0%

Influenza Vaccine Info Percent of short-stay residents assessed and appropriately given the seasonal influenza vaccine 93.5%
26% better than Oklahoma average

Oklahoma average: 74.0%

Re-hospitalized after SNF stay Info Percentage of short-stay residents who were re-hospitalized after their nursing home admission. 24.6%
9% better than Oklahoma average

Oklahoma average: 27.0%

Emergency department visits Info Percentage of short-stay residents who had an outpatient emergency department visit. 11.5%
33% better than Oklahoma average

Oklahoma average: 17.1%

Falls with major injury Info Percentage of SNF residents who experience falls with major injury during their stay. 0.9%
21% worse than Oklahoma average

Oklahoma average: 0.8%

Ability to care for self at discharge Info Percentage of residents at or above expected ability to care for themselves at discharge. 45.1%
16% worse than Oklahoma average

Oklahoma average: 53.7%

Successful return to home or community Info Rate of successful return to home or community from a skilled nursing facility. 63.5%
26% better than Oklahoma average

Oklahoma average: 50.6%

Breakdown by payment type

Medicare

36% of new residents, usually for short-term rehab.

Typical stay 12 - 13 months

Private pay

54% of new residents, often for short stays.

Typical stay 1 - 2 years

Medicaid

10% of new residents, often for long-term daily care.

Typical stay 1 months

Facility Characteristics

Source: CMS Long-Term Care Facility Characteristics (Data as of Jan 2026)

Total residents 94
Medicare
36
38.3% of residents
Medicaid
23
24.5% of residents
Private pay or other
35
37.2% of residents
Programs & Services
Residents Group

Residents meet regularly to discuss policies, care quality, and activities

Family Member Group

Family members meet regularly to discuss policies, care quality, and activities

Active Family Council

Organized group of family members that meets regularly to discuss facility policies, resident care, and activities.

Active Resident Council

Organized group of residents that meets regularly to discuss facility policies, quality of life, and activities.

Finances and operations

Based on CMS SNF Cost Report for fiscal year ending in 12/2023.

Privately-owned community
Operated by a single business entity.
Net patient revenue Info Net patient revenue — what the home actually collects for resident care, after contractual allowances, bad debt and discounts are subtracted from its gross charges (CMS cost report, Worksheet G-3). It covers resident care only; money the home earns from other sources is shown separately as "Other income."
$12.9M
Net patient income Info Net patient income: net patient revenue minus the home's total operating expenses. A positive figure means it earns more from resident care than it spends to deliver it; a negative figure means the opposite. It excludes non-operating "other income."
-$2.5M
Privately-owned community Operated by a single business entity.
Net patient revenue Info Net patient revenue — what the home actually collects for resident care, after contractual allowances, bad debt and discounts are subtracted from its gross charges (CMS cost report, Worksheet G-3). It covers resident care only; money the home earns from other sources is shown separately as "Other income."
$12.9M Rank #16 / 55Revenue — State benchmarkedThis home is ranked 16th out of 55 homes in Oklahoma. Shows this facility's annual revenue compared to the Oklahoma average. Higher revenue generally means more resources for staffing and capital — read alongside Payroll %.Rankings are based only on facilities in Oklahoma that report data for that category. Facilities without available data are excluded from the ranking.Click the rank badge to see the full State ranking.Click here to see the full State ranking.
Net patient income Info Net patient income: net patient revenue minus the home's total operating expenses. A positive figure means it earns more from resident care than it spends to deliver it; a negative figure means the opposite. It excludes non-operating "other income."
-$2.5M
Payroll costs Info Staff salaries plus wage-related costs — benefits such as payroll taxes, health insurance and retirement — from the home's own accounting records (CMS cost report, Worksheet A). Contract or agency labor is counted separately, under other operating costs. Rank #15 / 55Payroll — State benchmarkedThis home is ranked 15th out of 55 homes in Oklahoma. Shows total annual staff payroll benchmarked to the Oklahoma average. Higher payroll investment relative to peers often signals better staffing and less reliance on cheaper contract labor.Rankings are based only on facilities in Oklahoma that report data for that category. Facilities without available data are excluded from the ranking.Click the rank badge to see the full State ranking.Click here to see the full State ranking.
$7.1M 54.7% of net patient revenue Info Payroll as a share of revenue: staff salaries and wage-related benefits divided by net patient revenue. A higher figure means more of each revenue dollar goes to staff pay. Rank #16 / 55Payroll % — State benchmarkedThis home is ranked 16th out of 55 homes in Oklahoma. Shows payroll as a percentage of revenue versus the Oklahoma average. Well-run Oklahoma facilities typically land around 55–61% — the top third Statewide. Below 25% may signal understaffing or heavy agency use — read with Staffing ratings.Rankings are based only on facilities in Oklahoma that report data for that category. Facilities without available data are excluded from the ranking.Click the rank badge to see the full State ranking.Click here to see the full State ranking.
Other operating costs Info Everything it costs to run the home apart from payroll — food, utilities, supplies, maintenance, contract labor and administration. Calculated as total operating expense minus payroll (staff salaries and wage-related benefits).
$8.3M
Total costs Info The home's total operating expense for the year — all the costs of running it, salaries included (CMS cost report, Worksheet G-3).
$15.4M

Who this home usually serves

TYPE OF STAY

Mix of rehab and long-term care

This home supports both short-term rehab and long-term care, with residents staying for a wide range of durations.

Most new residents arrive under private pay (54% of admissions), and a typical private pay stay runs around 1 - 2 years.

Admissions
72 total

Coverage residents most often arrive under.

Medicare 36%
Private pay 54%
Medicaid 10%
Discharges
491 total

Coverage residents most often leave under.

Medicare 91%
Private pay 9%

Places of interest near Cearu Medical Resort

Address 10.8 miles from city center Info Estimated distance in miles from Tulsa's city center to Cearu Medical Resort's address, calculated via Google Maps.

Calculate Travel Distance to Cearu Medical Resort

Add your location

Address

Compare Nursing Homes around Tulsa

The information below is reported by the Oklahoma State Department of Health, Protective Health Services.

5 facilities compared · CMS & OK Dept. of Health data

Aberdeen Heights Assisted Living
NH
AL
Tulsa (Southridge Estate)
96
Facility 96
OK AVG 74
Rank #34 / 141
54.2%
Facility 54.2%
OK AVG 60.6%
Rank #116 / 132
-11%
4.48
Facility 4.48
OK AVG 4.57
Rank #25 / 51
+79%-2%
$0
Facility $0
OK AVG $48.8k
Rank #1 / 53
9
Facility 9
OK AVG 23.5
Rank #10 / 53
3.0
Facility 3.0
OK AVG 5.0
Rank #17 / 53
-44F
43
Facility 43
OK AVG 38
Rank #93 / 208
-
$4.0M
Facility $4.0M
OK AVG $6.4M
Rank #49 / 55
$2.2M
Facility $2.2M
OK AVG $2.8M
Rank #47 / 55
56.2%
Facility 56.2%
OK AVG 47.7%
Rank #15 / 55
375580
The Villages at Southern Hills
NH
AL
HC
RC
Tulsa (South Peoria)
98
Facility 98
OK AVG 74
Rank #33 / 141
43.9%
Facility 43.9%
OK AVG 60.6%
Rank #126 / 132
-28%
3.90
Facility 3.90
OK AVG 4.57
Rank #41 / 51
-26%-15%
$0
Facility $0
OK AVG $48.8k
Rank #1 / 53
3
Facility 3
OK AVG 23.5
Rank #2 / 53
1.5
Facility 1.5
OK AVG 5.0
Rank #2 / 53
-43A+
46
Facility 46
OK AVG 38
Rank #84 / 208
Lee Sudbeck
$16.8M
Facility $16.8M
OK AVG $6.4M
Rank #7 / 55
$7.5M
Facility $7.5M
OK AVG $2.8M
Rank #11 / 55
44.9%
Facility 44.9%
OK AVG 47.7%
Rank #52 / 55
375546
Cearu Medical Resort
NH
AL
Tulsa
104
Facility 104
OK AVG 74
Rank #27 / 141
75.7%
Facility 75.7%
OK AVG 60.6%
Rank #67 / 132
+25%
4.14
Facility 4.14
OK AVG 4.57
Rank #36 / 51
-24%-9%
$16.8k
Facility $16.8k
OK AVG $48.8k
Rank #37 / 53
4
Facility 4
OK AVG 23.5
Rank #3 / 53
2.0
Facility 2.0
OK AVG 5.0
Rank #6 / 53
1100-
19
Facility 19
OK AVG 38
Rank #159 / 208
Southtown Asset Management LLC
$12.9M
Facility $12.9M
OK AVG $6.4M
Rank #16 / 55
$7.1M
Facility $7.1M
OK AVG $2.8M
Rank #15 / 55
54.7%
Facility 54.7%
OK AVG 47.7%
Rank #16 / 55
375581
University Village Retirement Community
NH
AL
IL
Tulsa
150
Facility 150
OK AVG 74
Rank #5 / 141
63.3%
Facility 63.3%
OK AVG 60.6%
Rank #102 / 132
+4%
4.98
Facility 4.98
OK AVG 4.57
Rank #16 / 51
+17%+9%
$0
Facility $0
OK AVG $48.8k
Rank #1 / 53
15
Facility 15
OK AVG 23.5
Rank #23 / 53
3.8
Facility 3.8
OK AVG 5.0
Rank #28 / 53
-95-
42
Facility 42
OK AVG 38
Rank #97 / 208
Blake Fail
$13.0M
Facility $13.0M
OK AVG $6.4M
Rank #15 / 55
$3.3M
Facility $3.3M
OK AVG $2.8M
Rank #39 / 55
25.6%
Facility 25.6%
OK AVG 47.7%
Rank #55 / 55
375531
Montereau
NH
AL
HC
IL
MC
Tulsa (South Granite Avenue)
80
Facility 80
OK AVG 74
Rank #49 / 141
66.3%
Facility 66.3%
OK AVG 60.6%
Rank #95 / 132
+9%
5.54
Facility 5.54
OK AVG 4.57
Rank #11 / 51
-50%+21%
$24.2k
Facility $24.2k
OK AVG $48.8k
Rank #39 / 53
13
Facility 13
OK AVG 23.5
Rank #19 / 53
2.6
Facility 2.6
OK AVG 5.0
Rank #14 / 53
156D-
48
Facility 48
OK AVG 38
Rank #74 / 208
Saunya Moore
$39.5M
Facility $39.5M
OK AVG $6.4M
Rank #1 / 55
$14.7M
Facility $14.7M
OK AVG $2.8M
Rank #1 / 55
37.2%
Facility 37.2%
OK AVG 47.7%
Rank #54 / 55
375460

Financial Assistance for
Nursing Home in Oklahoma

Cearu Medical Resort is located in Tulsa, Oklahoma.
Here are the financial assistance programs available to residents in Oklahoma.

Get Financial aid guidance

ADvantage Waiver

Oklahoma Medicaid ADvantage

Age 65+ or disabled
General Oklahoma resident, Medicaid- eligible, nursing home-level care need.
Income Limits (2025) ~$2,829/month 300% FBR, individual
Asset Limits $2,000 (individual), $3,000 (couple).
OK

High rural demand; waitlists possible.

Benefits
Personal care (5-7 hours/day) Respite (240 hours/year) Adult day care ($60/day) Home modifications ($1,500 avg.)

Oklahoma Respite Voucher Program

OK Respite Vouchers

Age Caregiver of someone 60+
General Oklahoma resident.
Income Limits ~$2,500/month individual, varies
Asset Limits $40,000 individual
OK

Limited vouchers; rural focus.

Benefits
In-home respite (up to 30 days/year) Adult day care (~$60/day) Facility respite (up to 5 days)

Personal Care Program

Oklahoma Personal Care Program

Age 65+ (or disabled)
General OK resident, Medicaid-eligible, need help with 1+ ADL.
Income Limits (2025) ~$1,255/month (100% FPL, individual); QIT optional.
Asset Limits $2,000 (individual), $3,000 (couple).
OK

No NFLOC required (less stringent than ADvantage); statewide via SoonerCare.

Benefits
Personal care (5-20 hours/week) Bathing Grooming Light housekeeping Meal prep

Older Americans Act (OAA) Services

Oklahoma OAA Services

Age 60+
General OK resident (or spouse of any age); no income/asset limits.
Income Limits (2025) None; donations encouraged for some services.
Asset Limits Not assessed.
OK

11 AAAs; services vary by region (e.g., urban vs. rural).

Benefits
Meals (home-delivered or congregate, ~$5-$7/meal value) Transportation Homemaker services (~4 hours/week) Respite (~5 days/year) Legal aid

Medicare Savings Program (MSP)

Oklahoma Medicare Savings Program

Age 65+ or disabled
General OK resident, Medicare Part A/B.
Income Limits (2025) ~$2,510/month (QMB), ~$3,380/month (SLMB), ~$3,598/month (QI)—individual.
Asset Limits $9,430 (individual), $14,130 (couple).
OK

Three tiers; includes Extra Help for Part D; no waitlist.

Benefits
Covers Part B premiums ($174.70/month) Deductibles ($240/year) Copays (~20%)

VA Aid and Attendance (A&A) and Housebound Benefits

Oklahoma VA Aid and Attendance/Housebound

Age 65+ or disabled veteran/spouse
General OK resident, wartime service, need for ADL help (A&A) or homebound.
Income Limits (2025) Net income < ~$1,984/month (veteran with dependent, A&A); pension offsets income.
Asset Limits ~$155,356 net worth limit
OK

High veteran population; supports rural/urban care needs.

Benefits
Cash (~$1,433-$2,642/month veteran, ~$951-$1,318 spouse) for care costs (e.g., in-home, assisted living)

Senior Farmers’ Market Nutrition Program (SFMNP)

Oklahoma SFMNP

Age 60+
General OK resident, low-income.
Income Limits (2025) ~$2,322/month individual, 185% FPL
Asset Limits Not assessed.
OK

Vouchers (~$50/season) via 11 AAAs; farmers’ market focus.

Benefits
Vouchers (~$50/season) for fresh produce at approved markets

Property Tax Exemption for Seniors

Oklahoma Senior Property Tax Exemption

Age 65+
General OK resident, homeowner, low-income.
Income Limits (2025) ~$25,000/year individual, adjusted annually
Asset Limits Not assessed; home value < $1M.
OK

Exemption up to $1,000 of assessed value; homestead required.

Benefits
Tax reduction (~$100-$200/year avg., varies by county)

Frequently Asked Questions about Cearu Medical Resort

Is Cearu Medical Resort in a walkable area?

Cearu Medical Resort has a walk score of 19. Car-dependent. Most errands require a car, with limited nearby walkable options.

What is the occupancy rate at Cearu Medical Resort?

Cearu Medical Resort's occupancy is 75.7%.

Are there photos of Cearu Medical Resort?

Yes — there is 1 photo of Cearu Medical Resort in the photo gallery on this page.

What is the address of Cearu Medical Resort?

Cearu Medical Resort is located at 8720 S 101St E Ave, Tulsa, OK 74133.

What is the phone number of Cearu Medical Resort?

(918) 965-0101 will put you in contact with the team at Cearu Medical Resort.

Is Cearu Medical Resort Medicare or Medicaid certified?

Yes — Cearu Medical Resort is a CMS-certified provider of Medicare and Medicaid.

Guides for Better Senior Living

Care Cost Calculator: See Prices in Your Area

Nursing Home Data Explorer

Don’t Wait Too Long: 7 Red Flag Signs Your Parent Needs Assisted Living Now

The True Cost of Assisted Living in 2025 – And How Families Are Paying For It

Understanding Senior Living Costs: Pricing Models, Discounts & Financial Assistance