


Total staff
186
Employees
159
Contractors
27
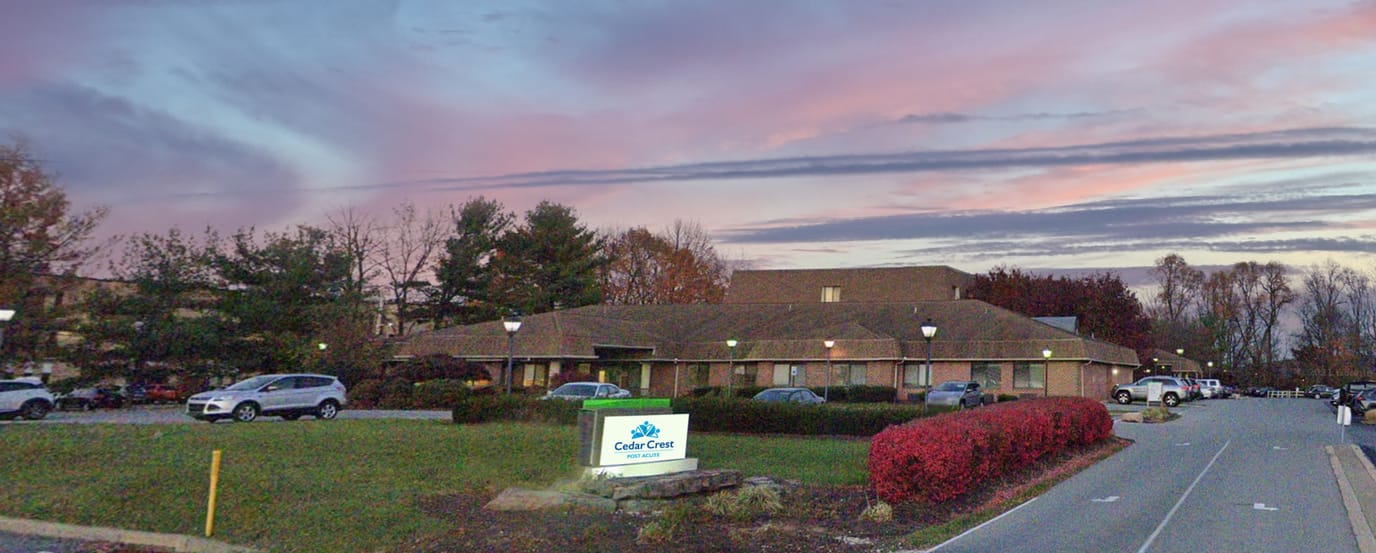

A community with unparalleled care for skilled nursing and rehabilitative services, Cedar Crest, focuses on conducting results-driven programs with cutting-edge technologies that specifically cater to the varying needs of the residents. With an emphasis on sub-acute rehabilitation, the nursing home consists of professional staff committed to providing seniors with a safe and comfortable environment.
Cedar Crest assures families and seniors that nursing home care services include a patient-centered community for post-acute and long-term skilled nursing, allowing for maximum potential in recovery. They are proud to be an Urgent SNF™ and Rehabbing Care™ partner, guaranteeing a revitalizing recovery experience for all.
Staffing hours
![]() Daily nursing hours per resident by staff type, reported to CMS. Higher is generally better — compare this facility to state and national averages to see where staffing stands.
Daily nursing hours per resident by staff type, reported to CMS. Higher is generally better — compare this facility to state and national averages to see where staffing stands.
Hours per resident per day vs Pennsylvania averages
Total nursing care
![]() This home is ranked 163rd out of 180 homes in Pennsylvania for nurse hours. Total adjusted nursing hours per resident per day, combining RN, LPN, and aide time. CMS adjusts this for case-mix so facilities can be fairly compared.
This home is ranked 163rd out of 180 homes in Pennsylvania for nurse hours. Total adjusted nursing hours per resident per day, combining RN, LPN, and aide time. CMS adjusts this for case-mix so facilities can be fairly compared.
3h 25m
18% below state avgAll 6 underlying metrics fall below the state average
Reporting period: October 1 – December 31, 2025 (Q4 2025). Source: CMS Payroll-Based Journal report.
Manages medical care and health needs.
Assists with medical care and medications.
Helps with daily care and mobility.
Total hours from contractors
4,187 contractor hours this quarter
| Certified Nursing Assistant | 83 | 0 | 83 | 26,956 | 92 | 100% | 8.1 |
| Licensed Practical Nurse | 38 | 1 | 39 | 11,086 | 92 | 100% | 8.8 |
| Registered Nurse | 20 | 5 | 25 | 7,595 | 92 | 100% | 9.3 |
| Clinical Nurse Specialist | 8 | 0 | 8 | 2,199 | 88 | 96% | 7.3 |
| Other Dietary Services Staff | 3 | 0 | 3 | 1,272 | 88 | 96% | 7.2 |
| Mental Health Service Worker | 2 | 0 | 2 | 976 | 69 | 75% | 8 |
| Qualified Social Worker | 0 | 5 | 5 | 948 | 77 | 84% | 7.3 |
| Physical Therapy Assistant | 0 | 4 | 4 | 927 | 74 | 80% | 7.6 |
| Physical Therapy Aide | 0 | 3 | 3 | 886 | 75 | 82% | 7 |
| Respiratory Therapy Technician | 0 | 6 | 6 | 620 | 81 | 88% | 6.4 |
| Dental Services Staff | 1 | 0 | 1 | 520 | 65 | 71% | 8 |
| Speech Language Pathologist | 0 | 3 | 3 | 516 | 66 | 72% | 7 |
| Nurse Practitioner | 1 | 0 | 1 | 504 | 60 | 65% | 8.4 |
| RN Director of Nursing | 1 | 0 | 1 | 499 | 63 | 68% | 7.9 |
| Administrator | 1 | 0 | 1 | 488 | 61 | 66% | 8 |
| Dietitian | 1 | 0 | 1 | 488 | 61 | 66% | 8 |
Federal penalties imposed by CMS for regulatory violations, including civil money penalties (fines) and denials of payment for new Medicare/Medicaid admissions.
Source: CMS Penalties Database
No penalties in the past 3 years
No civil money penalties or payment denials were reported in the last 3 years.
These measures show how residents usually do over time at this home, based on health outcomes and preventive care.
Pennsylvania average: 11.0
Pennsylvania average: 22.2
Pennsylvania average: 19.0%
Pennsylvania average: 21.1%
Pennsylvania average: 26.7%
Pennsylvania average: 3.2%
Pennsylvania average: 5.5%
Pennsylvania average: 1.8%
Pennsylvania average: 6.6%
Pennsylvania average: 5.5%
Pennsylvania average: 17.1%
Pennsylvania average: 86.9%
Pennsylvania average: 93.5%
Pennsylvania average: 1.68
Pennsylvania average: 1.20
Pennsylvania average: 68.8%
Pennsylvania average: 1.5%
Pennsylvania average: 68.7%
Pennsylvania average: 23.1%
Pennsylvania average: 9.8%
Pennsylvania average: 0.8%
Pennsylvania average: 53.7%
Pennsylvania average: 50.6%
Quality measures are calculated from Minimum Data Set (MDS) assessments. For most measures, lower percentages indicate better care quality.
45% of new residents, usually for short-term rehab.
46% of new residents, often for short stays.
9% of new residents, often for long-term daily care.
Source: CMS Long-Term Care Facility Characteristics (Data as of Jan 2026)
Residents meet regularly to discuss policies, care quality, and activities
Organized group of residents that meets regularly to discuss facility policies, quality of life, and activities.
Data sourced from CMS Long-Term Care Facility Characteristics quarterly report. Payer mix reflects the current resident census by primary payment source.
Historical financial and operational data for Cedar Crest Post Acute from 2012–2022, based on CMS SNF Cost Reports.
Key figures below are for fiscal year ending in 12/2022 — the home's most recent complete cost report, an older period than most facilities report.
Based on the home's most recent complete CMS SNF Cost Report — fiscal year ending in 12/2022. This is an older period than most facilities report, so compare with that in mind.
This home supports both short-term rehab and long-term care, with residents staying for a wide range of durations.
New residents most often arrive under private pay (46% of admissions), and a typical private pay stay runs around 19 days.
Coverage residents most often arrive under.
Coverage residents most often leave under.
Leslie Schupper is the Administrator at Cedar Crest Post Acute. She has been a licensed Nursing Home Administrator since 2009 and brings over 23 years of leadership experience, including roles in Behavioral Health Services. Leslie is passionate about teaching and training future generations, ensuring high-quality care and continuity for residents.
![]() 3.6 miles from city center
3.6 miles from city center
![]() Estimated distance in miles from Allentown's city center to Cedar Crest Post Acute's address, calculated via Google Maps.
Estimated distance in miles from Allentown's city center to Cedar Crest Post Acute's address, calculated via Google Maps.
Add your location
Info below is compiled from CMS reports & the PA Depts. of Human Services & Health, senior community websites & trusted data sources such as Walk Score & BBB.
Communities are listed from highest to lowest based on our ranking methodology.
| Riverton Enhanced Senior Living | NH AL IL MC RC SNF | Pa (Rittersville) | 90
Facility
90
PA AVG
94
Rank
#250 / 552 |
76.7%
Facility
76.7%
PA AVG
68.1
Rank
#191 / 506 | +13% | 3.51
Facility
3.51
PA AVG
4.15
Rank
#155 / 180 | +19% | -15% | $0
Facility
$0
PA AVG
$61.2k
Rank
#1 / 183 | 91
Facility
91
PA AVG
83
Rank
#112 / 468 | 7
Facility
7
PA AVG
31.3
Rank
#42 / 178 | 1.4
Facility
1.4
PA AVG
4.4
Rank
#17 / 178 | - | 69 | - |
56
Facility
56
PA AVG
47
Rank
#236 / 657 | Lee-Anne Liberatore | $16.0MFiscal year ending 12/2023
Facility
$16.0MFiscal year ending 12/2023
PA AVG
$32.8M
Rank
#124 / 181 | $7.2MFiscal year ending 12/2023
Facility
$7.2MFiscal year ending 12/2023
PA AVG
$6.7M
Rank
#115 / 181 | 45.1%Fiscal year ending 12/2023
Facility
45.1%Fiscal year ending 12/2023
PA AVG
40%
Rank
#70 / 181 | 395171 | ||||
| Cedarbrook Senior Care and Rehab | NH HOS IL MC PC RC SNF | Allentown (South Cedarbrook Road) | 670
Facility
670
PA AVG
94
Rank
#1 / 552 |
75.8%
Facility
75.8%
PA AVG
68.1
Rank
#206 / 506 | +11% | 4.64
Facility
4.64
PA AVG
4.15
Rank
#64 / 180 | -5% | +12% | $0
Facility
$0
PA AVG
$61.2k
Rank
#1 / 183 | - | 12
Facility
12
PA AVG
31.3
Rank
#71 / 178 | 4.0
Facility
4.0
PA AVG
4.4
Rank
#102 / 178 | - | 508 | - |
22
Facility
22
PA AVG
47
Rank
#520 / 657 | County Of Lehigh Pennsylvania | $18.5MFiscal year ending 12/2023
Facility
$18.5MFiscal year ending 12/2023
PA AVG
$32.8M
Rank
#5 / 181 | $38.7MFiscal year ending 12/2023
Facility
$38.7MFiscal year ending 12/2023
PA AVG
$6.7M
Rank
#3 / 181 | 208.9%Fiscal year ending 12/2023
Facility
208.9%Fiscal year ending 12/2023
PA AVG
40%
Rank
#16 / 181 | 395465 | ||||
| Good Shepherd Home Raker Center | NH SNF | Allentown (Fairview) | 99
Facility
99
PA AVG
94
Rank
#225 / 552 |
97.8%
Facility
97.8%
PA AVG
68.1
Rank
#5 / 506 | +44% | 3.36
Facility
3.36
PA AVG
4.15
Rank
#163 / 180 | +40% | -19% | $0
Facility
$0
PA AVG
$61.2k
Rank
#1 / 183 | - | 12
Facility
12
PA AVG
31.3
Rank
#71 / 178 | 3.0
Facility
3.0
PA AVG
4.4
Rank
#61 / 178 | - | 97 | - |
60
Facility
60
PA AVG
47
Rank
#208 / 657 | - | - | - | - | 395018 | ||||
| Complete Care at Lehigh Center | NH HOS PC RC SNF | Macungie (Spring Creek Road) | 128
Facility
128
PA AVG
94
Rank
#97 / 552 |
96.0%
Facility
96.0%
PA AVG
68.1
Rank
#15 / 506 | +41% | 3.47
Facility
3.47
PA AVG
4.15
Rank
#155 / 180 | -38% | -16% | $0
Facility
$0
PA AVG
$61.2k
Rank
#1 / 183 | - | 11
Facility
11
PA AVG
31.3
Rank
#65 / 178 | 3.7
Facility
3.7
PA AVG
4.4
Rank
#94 / 178 | - | 123 | - |
18
Facility
18
PA AVG
47
Rank
#547 / 657 | - | $15.3MFiscal year ending 12/2023
Facility
$15.3MFiscal year ending 12/2023
PA AVG
$32.8M
Rank
#131 / 181 | $7.4MFiscal year ending 12/2023
Facility
$7.4MFiscal year ending 12/2023
PA AVG
$6.7M
Rank
#124 / 181 | 48.5%Fiscal year ending 12/2023
Facility
48.5%Fiscal year ending 12/2023
PA AVG
40%
Rank
#67 / 181 | 395939 | ||||
| Cedar Crest Post Acute | NH SNF | Allentown | 166
Facility
166
PA AVG
94
Rank
#38 / 552 |
94.5%
Facility
94.5%
PA AVG
68.1
Rank
#23 / 506 | +39% | 3.41
Facility
3.41
PA AVG
4.15
Rank
#163 / 180 | +12% | -18% | $0
Facility
$0
PA AVG
$61.2k
Rank
#1 / 183 | - | 7
Facility
7
PA AVG
31.3
Rank
#42 / 178 | 1.4
Facility
1.4
PA AVG
4.4
Rank
#17 / 178 | - | 157 | - |
31
Facility
31
PA AVG
47
Rank
#456 / 657 | Cedar Crest Operator Holdings LLC | $13.2M*Fiscal year ending 12/2022These figures are from this home's most recent complete cost report — an older period than most facilities report. Compare with that in mind.
Facility
$13.2M*Fiscal year ending 12/2022These figures are from this home's most recent complete cost report — an older period than most facilities report. Compare with that in mind.
PA AVG
$32.8M
Rank
#144 / 181 | $4.6M*Fiscal year ending 12/2022These figures are from this home's most recent complete cost report — an older period than most facilities report. Compare with that in mind.
Facility
$4.6M*Fiscal year ending 12/2022These figures are from this home's most recent complete cost report — an older period than most facilities report. Compare with that in mind.
PA AVG
$6.7M
Rank
#97 / 181 | 35.2%*Fiscal year ending 12/2022These figures are from this home's most recent complete cost report — an older period than most facilities report. Compare with that in mind.
Facility
35.2%*Fiscal year ending 12/2022These figures are from this home's most recent complete cost report — an older period than most facilities report. Compare with that in mind.
PA AVG
40%
Rank
#5 / 181 | 395760 |
Cedar Crest Post Acute is located in Allentown, Pennsylvania.
Here are the financial assistance programs available to residents in Pennsylvania.
Cedar Crest Post Acute has a walk score of 31. Somewhat walkable. A few nearby services may be reachable on foot, but most trips require transportation.
Cedar Crest Post Acute's occupancy is 90.7%.
No, Cedar Crest Post Acute has a no-pet policy.
Cedar Crest Post Acute is registered as a for-profit.
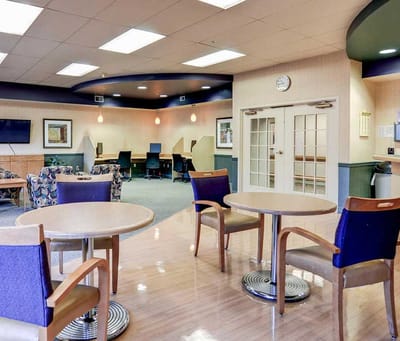
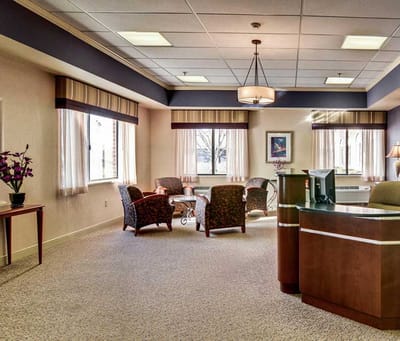
Yes — there are 4 photos of Cedar Crest Post Acute in the photo gallery on this page.
Cedar Crest Post Acute is located at 1265 S Cedar Crest Blvd, Allentown, PA 18103.
(717) 273-7959 will put you in contact with the team at Cedar Crest Post Acute.
Care Cost Calculator: See Prices in Your Area
Nursing Home Data Explorer
Don’t Wait Too Long: 7 Red Flag Signs Your Parent Needs Assisted Living Now
The True Cost of Assisted Living in 2025 – And How Families Are Paying For It
Understanding Senior Living Costs: Pricing Models, Discounts & Financial Assistance


