The Terrace at Phoebe Allentown
Nursing Home, Independent Living, Memory Care, Respite Care & Skilled Nursing · Allentown, PA
CMS overall rating Info CMS (the Centers for Medicare & Medicaid Services) is the federal agency that rates nursing home quality. Its Overall Rating runs from 1 to 5 stars, combining health inspections, staffing, and quality measures, with inspections weighted most heavily.

The Terrace at Phoebe Allentown

Nursing Home, Independent Living, Memory Care, Respite Care & Skilled Nursing · Allentown, PA
CMS overall rating Info CMS (the Centers for Medicare & Medicaid Services) is the federal agency that rates nursing home quality. Its Overall Rating runs from 1 to 5 stars, combining health inspections, staffing, and quality measures, with inspections weighted most heavily.
Calculator: See prices in your area
The Terrace at Phoebe Allentown accepts Medicare, Medicaid, and private pay.

Overview of The Terrace at Phoebe Allentown

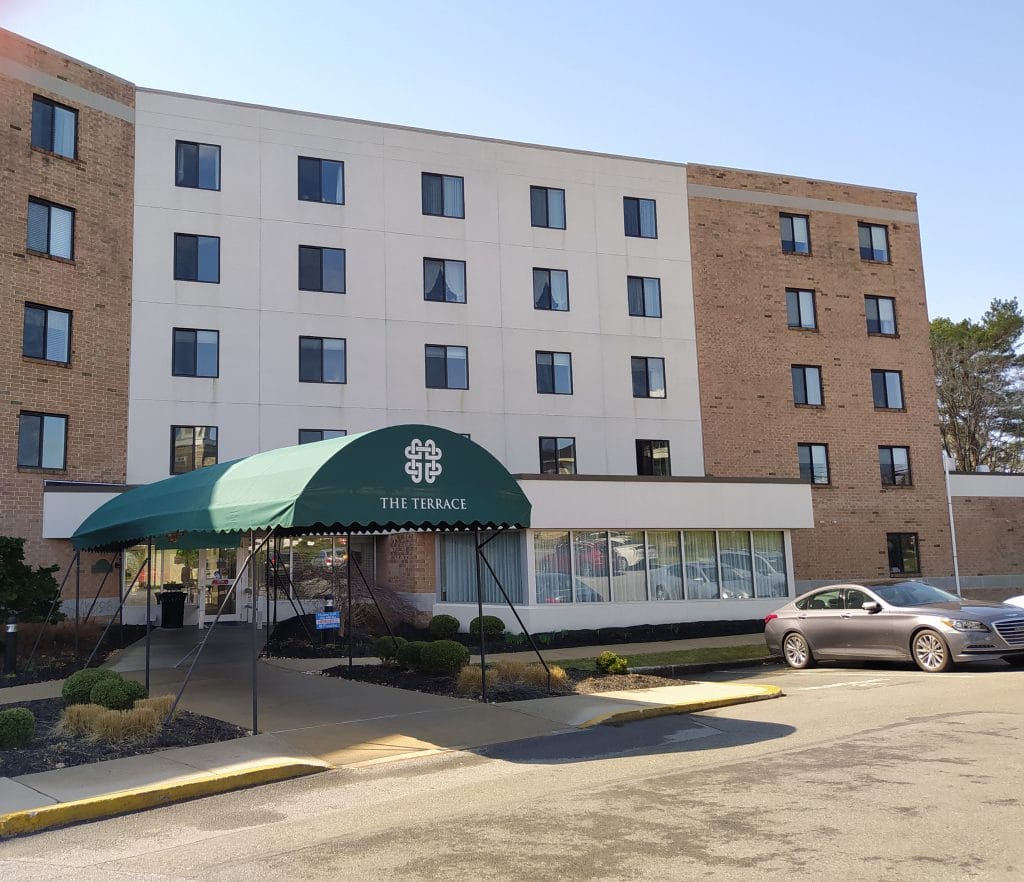
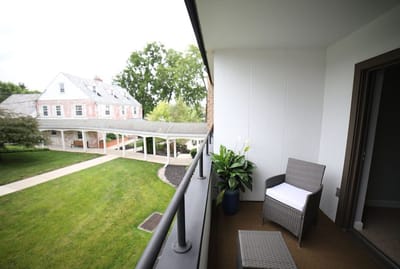
The Terrace at Phoebe Allentown is an exquisite senior living community that boasts resort-style living in a modern apartment complex exclusively for active 65+ adults. The retirement home encourages its seniors to maintain independence while receiving exceptional care from compassionate staff; they truly cares about its residents and families by creating a welcoming and comfortable environment that helps residents feel more comfortable. 

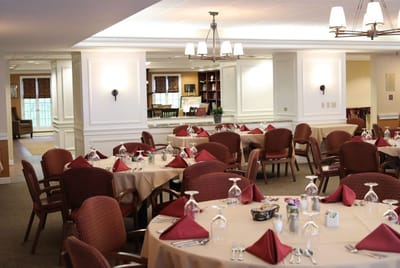
The Terrace provides a list of comprehensive amenities and services that help make the lives of its residents hassle-free, including 24-hour licensed supervision, medication services, balanced meals provided, engaging activities scheduled, and a full-service salon available. 

Quality ratings

Measured by Centers for Medicare & Medicaid Services (CMS)

Overall rating Info The Overall CMS Rating combines results from health inspections, staffing levels and quality measures. Health inspections carry the most weight. Staffing and quality scores can increase or decrease the final rating based on performance compared to state and national standards.
▼ 33.3% Below PA avg. ▼ 33.3% Below PA avg.PA average: 3.0Click the badge to see the full State ranking.Click here to see the full State ranking.
Health Inspection Info Based on the results of the facility's three most recent standard inspections and any complaint investigations. CMS reviews the number, scope, and severity of deficiencies, with more recent findings weighted more heavily.
▼ 28.5% Below PA avg. ▼ 28.5% Below PA avg.PA average: 2.8Click the badge to see the full State ranking.Click here to see the full State ranking.
Staffing Info Measures average nursing staff hours per resident per day, including Registered Nurses (RNs) and total nursing staff. Ratings are adjusted based on the level of care residents require and are compared to state and national benchmarks.
▼ 41.0% Below PA avg. ▼ 41.0% Below PA avg.PA average: 3.4Click the badge to see the full State ranking.Click here to see the full State ranking.
Quality Measures Info Based on clinical and physical health indicators reported to CMS, such as hospital readmissions, falls, pressure ulcers, and improvements in mobility. These measures reflect how well residents' health needs are being managed.
▼ 41.1% Below PA avg. ▼ 41.1% Below PA avg.PA average: 3.4Click the badge to see the full State ranking.Click here to see the full State ranking.

Staffing hours breakdown

Info Daily nursing hours per resident by staff type, reported to CMS. Higher is generally better — compare this facility to state and national averages to see where staffing stands.

Hours per resident per day — compared to Pennsylvania state averages

Total nursing care / resident Info This home is ranked 122nd out of 207 homes in Pennsylvania for nurse hours. Total adjusted nursing hours per resident per day, combining RN, LPN, and aide time. CMS adjusts this for case-mix so facilities can be fairly compared.
3h 59m per day
Rank #122 / 207Nurse hours — State benchmarkedThis home is ranked 122nd out of 207 homes in Pennsylvania. Shows adjusted nurse hours per resident per day benchmarked to the Pennsylvania average, with a ranking across 207 Pennsylvania facilities. More hours mean more direct care. The national average is about 3.5 hrs; below 3.0 is a red flag.Rankings are based only on facilities in Pennsylvania that report data for that category. Facilities without available data are excluded from the ranking.Click the rank badge to see the full State ranking.Click here to see the full State ranking.
This facility Pennsylvania avg (4h 9m per day)
vs Pennsylvania avg
-4%

4 of 6 metrics below state avg

Standout metric LPN / LVN is +20% above state avg
Staff type Hours / Day / Resident vs state avg
Registered Nurse (RN) Info RNs hold the highest nursing license and can assess residents, interpret test results, and direct care plans. More RN hours per day often signals stronger clinical oversight and faster response to health changes. 22m per day ▼ 53% State avg: 47m per day · National avg: 41m per day
LPN / LVN Info Licensed Practical Nurses (LPNs) or Licensed Vocational Nurses (LVNs) deliver routine hands-on care — medication administration, wound dressing, and monitoring vital signs. They work under RN supervision and make up a large share of daily bedside care. 1h 5m per day ▲ 20% State avg: 54m per day · National avg: 52m per day
Nurse Aide Info Certified Nurse Aides (CNAs) provide the most direct day-to-day assistance: bathing, dressing, feeding, and mobility. Nurse aide hours are typically the largest staffing category and directly affect residents' quality of life. 2h 15m per day ▲ 3% State avg: 2h 12m per day · National avg: 2h 20m per day
Weekend Total Nursing Info Combined nursing hours (RN + LPN + Nurse Aide) per resident per day on weekends. Staffing often drops on weekends — this figure reveals whether the facility maintains adequate coverage outside of weekday hours. 3h 22m per day ▼ 5% State avg: 3h 32m per day · National avg: 3h 27m per day
Physical Therapist Info Hours per resident per day provided by licensed Physical Therapists (PTs) or PT Assistants. PT services help residents recover mobility after injury or illness and are especially important for post-acute (short-stay) rehabilitation. 6m per day ▼ 4% State avg: 6m per day · National avg: 4m per day
Weekend RN Info Registered nurse hours specifically on weekends. Facilities sometimes reduce RN presence on Saturdays and Sundays — a low weekend RN figure compared to weekday hours can indicate reduced clinical oversight when most administrative staff are absent. 11m per day ▼ 67% State avg: 33m per day · National avg: 29m per day

Capacity and availability

This home usually has availability

Lower occupancy than the Pennsylvania average: 78.7%
Occupancy rate
60.7% Rank #346 / 518Occupancy rate — State benchmarkedThis home is ranked 346th out of 518 homes in Pennsylvania. Shows this facility's occupancy rate versus the Pennsylvania average, with its Statewide rank out of 518. Higher occupancy signals strong local demand and financial stability.Rankings are based only on facilities in Pennsylvania that report data for that category. Facilities without available data are excluded from the ranking.Click the rank badge to see the full State ranking.Click here to see the full State ranking.
Avg. Length of Stay Info Average number of days residents stay at this facility, based on CMS cost report data. Shorter stays often reflect post-acute or rehab care; longer stays reflect long-term care.
166 days
Bed community size
343-bed community Rank #4 / 555Bed count — State benchmarkedThis home is ranked 4th out of 555 homes in Pennsylvania. Shows this facility's certified or reported bed count compared to other Pennsylvania facilities. Larger communities may offer more amenities, programs, and on-site services for residents and families.Rankings are based only on facilities in Pennsylvania that report data for that category. Facilities without available data are excluded from the ranking.Click the rank badge to see the full State ranking.Click here to see the full State ranking.
A large-scale community that may provide a wide range of amenities, services, and structured programs.
Walk Score
Walk Score: 82 / 100 Rank #68 / 668Walk Score — State benchmarkedThis home is ranked 68th out of 668 homes in Pennsylvania. Shows how walkable this facility's neighborhood is compared to the average Walk Score across Pennsylvania facilities. Higher scores benefit residents, families, and staff.Rankings are based only on facilities in Pennsylvania that report data for that category. Facilities without available data are excluded from the ranking.Click the rank badge to see the full State ranking.Click here to see the full State ranking.
Very walkable. Most errands can be accomplished on foot, and many essentials are within a short walk.

Contact The Terrace at Phoebe Allentown

Staffing Data

Reporting period: October 1 – December 31, 2025 (Q4 2025). Source: CMS Payroll-Based Journal report.

Total staff 386
Employees 302
Contractors 84
Staff to resident ratio 1.62 : 1
12% fewer staff per resident than Pennsylvania average
Pennsylvania average ratio: 1.83 : 1 Pennsylvania average ratio: 1.83 : 1See full Pennsylvania ranking
Avg staff/day 132
Average shift 7.9 hours
0% compared with Pennsylvania average
Pennsylvania average: 7.8 hours Pennsylvania average shift: 7.8 hoursSee full Pennsylvania ranking
Total staff hours (quarter) 96,127

Nursing staff breakdown

Q4 2025 · Oct 1 – Dec 31 More info This data comes from the CMS Payroll-Based Journal report covering October 1 – December 31, 2025.
Registered Nurse

Manages medical care and health needs.

RN Staff Info 23 total: 13 full-time employees and 10 contractors. 23
Average shift length Info Average shift length. Calculated as total hours divided by days worked and average staff per day. 7.6 hours
Licensed Practical Nurse

Assists with medical care and medications.

LPN Staff Info 93 total: 70 full-time employees and 23 contractors. 93
Average shift length Info Average shift length. Calculated as total hours divided by days worked and average staff per day. 8.3 hours
Certified Nursing Assistant

Helps with daily care and mobility.

CNA Staff Info 180 total: 151 full-time employees and 29 contractors. 180
Average shift length Info Average shift length. Calculated as total hours divided by days worked and average staff per day. 8 hours

Contractor staffing

Q4 2025 · Oct 1 – Dec 31 More info This data comes from the CMS Payroll-Based Journal report covering October 1 – December 31, 2025.

Total hours from contractors

4.7%

4,491 contractor hours this quarter

Certified Nursing Assistant: 29 Licensed Practical Nurse: 23 Registered Nurse: 10 Physical Therapy Aide: 6 Physical Therapy Assistant: 5 Qualified Social Worker: 4 Speech Language Pathologist: 4 Respiratory Therapy Technician: 3

Staff by category

Q4 2025 · Oct 1 – Dec 31 More info This data comes from the CMS Payroll-Based Journal report covering October 1 – December 31, 2025.
Certified Nursing Assistant 151 29 180 49,826 92 100% 8
Licensed Practical Nurse 70 23 93 24,084 92 100% 8.3
Clinical Nurse Specialist 16 0 16 4,679 87 95% 7.8
Dietitian 7 0 7 2,878 91 99% 7.5
Registered Nurse 13 10 23 2,801 92 100% 7.6
Respiratory Therapy Technician 8 3 11 2,099 75 82% 7.8
Other Dietary Services Staff 8 0 8 1,383 90 98% 5.2
Physical Therapy Assistant 7 5 12 1,314 74 80% 7.2
Physical Therapy Aide 2 6 8 1,274 66 72% 7.1
Dental Services Staff 3 0 3 1,245 64 70% 8
Mental Health Service Worker 4 0 4 1,045 65 71% 7.8
Occupational Therapy Aide 3 0 3 962 67 73% 7.8
Qualified Social Worker 4 4 8 895 74 80% 6.6
Nurse Practitioner 1 0 1 506 61 66% 8.3
Administrator 1 0 1 472 59 64% 8
Speech Language Pathologist 1 4 5 330 46 50% 6.1
Medical Director 1 0 1 120 24 26% 5
Occupational Therapy Assistant 1 0 1 112 16 17% 7
Qualified Activities Professional 1 0 1 104 27 29% 3.9
180 Certified Nursing Assistant
% of Days 100%
93 Licensed Practical Nurse
% of Days 100%
16 Clinical Nurse Specialist
% of Days 95%
7 Dietitian
% of Days 99%
23 Registered Nurse
% of Days 100%
11 Respiratory Therapy Technician
% of Days 82%
8 Other Dietary Services Staff
% of Days 98%
12 Physical Therapy Assistant
% of Days 80%
8 Physical Therapy Aide
% of Days 72%
3 Dental Services Staff
% of Days 70%
4 Mental Health Service Worker
% of Days 71%
3 Occupational Therapy Aide
% of Days 73%
8 Qualified Social Worker
% of Days 80%
1 Nurse Practitioner
% of Days 66%
1 Administrator
% of Days 64%
5 Speech Language Pathologist
% of Days 50%
1 Medical Director
% of Days 26%
1 Occupational Therapy Assistant
% of Days 17%
1 Qualified Activities Professional
% of Days 29%

Penalties and fines

Includes penalties issued in 2025

Federal penalties imposed by CMS for regulatory violations, including civil money penalties (fines) and denials of payment for new Medicare/Medicaid admissions.

Source: CMS Penalties Database (Data as of Jan 2026)

Total fines amount $21K Rank #158 / 210Federal fines — State benchmarkedThis home is ranked 158th out of 210 homes in Pennsylvania. Shows this facility's cumulative CMS federal fine dollars versus the Pennsylvania average among facilities with fines, and where it ranks among 210 facilities in the pool. Lower total dollars mean a better rank.Rankings are based only on facilities in Pennsylvania that report data for that category. Facilities without available data are excluded from the ranking.Click the rank badge to see the full State ranking.Click here to see the full State ranking.
65% lower than Pennsylvania average

Pennsylvania average: $59K

Number of fines 2
In line with Pennsylvania average

Pennsylvania average: 2.1

Payment Denials Info Serious action where Medicare and/or Medicaid temporarily stops payments for new residents until issues are fixed. 0
100% fewer payment denials than Pennsylvania average

Pennsylvania average: 0.2

Fines amount comparison
This facility $21K
Pennsylvania average $59K
Penalty History

Penalties are imposed by CMS for violations of federal nursing home regulations.

1 penalty in the past 3 years

Jul 17, 2025 · $17K

Civil Money Penalty Info Fines imposed for noncompliance, which can be assessed per day or per instance of violation. Jul 17, 2025
$17K

Last updated: Jan 2026

Quality of care over time

These measures show how residents usually do over time at this home, based on health outcomes and preventive care.

High-risk clinical events score Info A composite score based on pressure ulcers, falls with injury, weight loss, walking ability decline, and activities of daily living decline. 14.8
35% worse than Pennsylvania average

Pennsylvania average: 11.0

Functional decline score Info A composite score based on activities of daily living decline, walking ability decline, and incontinence. 29.6
33% worse than Pennsylvania average

Pennsylvania average: 22.2

Long-stay resident measures
Need for Help with Daily Activities Increased Info Percent of long-stay residents whose need for help with daily activities has increased 29.2%
54% worse than Pennsylvania average

Pennsylvania average: 19.0%

Walking Ability Worsened Info Percent of long-stay residents whose ability to move independently worsened 28.1%
33% worse than Pennsylvania average

Pennsylvania average: 21.1%

Low Risk Residents with Bowel/Bladder Incontinence Info Percent of low risk long-stay residents who lose control of their bowels or bladder 31.6%
18% worse than Pennsylvania average

Pennsylvania average: 26.7%

Falls with Major Injury Info Percent of long-stay residents experiencing one or more falls with major injury 4.0%
27% worse than Pennsylvania average

Pennsylvania average: 3.2%

High Risk Residents with Pressure Ulcers Info Percent of long-stay high risk residents with pressure ulcers 6.7%
21% worse than Pennsylvania average

Pennsylvania average: 5.5%

Urinary Tract Infection Info Percent of long-stay residents with a urinary tract infection 3.0%
71% worse than Pennsylvania average

Pennsylvania average: 1.8%

Lost Too Much Weight Info Percent of long-stay residents who lose too much weight 5.9%
11% better than Pennsylvania average

Pennsylvania average: 6.6%

Depressive Symptoms Info Percent of long-stay residents who have depressive symptoms 4.4%
20% better than Pennsylvania average

Pennsylvania average: 5.5%

Antipsychotic Use Info Percent of long-stay residents who received an antipsychotic medication 11.7%
31% better than Pennsylvania average

Pennsylvania average: 17.1%

Pneumococcal Vaccine Info Percent of long-stay residents assessed and appropriately given the pneumococcal vaccine 84.0%
In line with Pennsylvania average

Pennsylvania average: 86.9%

Influenza Vaccine Info Percent of long-stay residents assessed and appropriately given the seasonal influenza vaccine 81.3%
13% worse than Pennsylvania average

Pennsylvania average: 93.5%

Short-stay resident measures
Pneumococcal Vaccine Info Percent of short-stay residents assessed and appropriately given the pneumococcal vaccine 61.9%
10% worse than Pennsylvania average

Pennsylvania average: 68.8%

Antipsychotic medication increase Info Percent of short-stay residents who newly received an antipsychotic medication 1.6%
5% worse than Pennsylvania average

Pennsylvania average: 1.5%

Influenza Vaccine Info Percent of short-stay residents assessed and appropriately given the seasonal influenza vaccine 40.9%
40% worse than Pennsylvania average

Pennsylvania average: 68.7%

Breakdown by payment type

Medicare

63% of new residents, usually for short-term rehab.

Typical stay 19 days

Private pay

35% of new residents, often for short stays.

Typical stay 2 - 3 months

Medicaid

2% of new residents, often for long-term daily care.

Typical stay 15 years

Facility Characteristics

Source: CMS Long-Term Care Facility Characteristics (Data as of Jan 2026)

Total residents 239
Medicare
19
7.9% of residents
Medicaid
129
54% of residents
Private pay or other
91
38.1% of residents
Programs & Services
Residents Group

Residents meet regularly to discuss policies, care quality, and activities

CCRC

Part of a Continuing Care Retirement Community offering multiple care levels

Active Resident Council

Organized group of residents that meets regularly to discuss facility policies, quality of life, and activities.

Finances and operations

Based on CMS SNF Cost Report for fiscal year ending in 06/2024.

Nonprofit
Nonprofit Corporation
Net patient revenue Info Net patient revenue — what the home actually collects for resident care, after contractual allowances, bad debt and discounts are subtracted from its gross charges (CMS cost report, Worksheet G-3). It covers resident care only; money the home earns from other sources is shown separately as "Other income."
$35.8M
Net patient income Info Net patient income: net patient revenue minus the home's total operating expenses. A positive figure means it earns more from resident care than it spends to deliver it; a negative figure means the opposite. It excludes non-operating "other income."
-$5.3M
Nonprofit Nonprofit Corporation
Net patient revenue Info Net patient revenue — what the home actually collects for resident care, after contractual allowances, bad debt and discounts are subtracted from its gross charges (CMS cost report, Worksheet G-3). It covers resident care only; money the home earns from other sources is shown separately as "Other income."
$35.8M Rank #12 / 209Revenue — State benchmarkedThis home is ranked 12th out of 209 homes in Pennsylvania. Shows this facility's annual revenue compared to the Pennsylvania average. Higher revenue generally means more resources for staffing and capital — read alongside Payroll %.Rankings are based only on facilities in Pennsylvania that report data for that category. Facilities without available data are excluded from the ranking.Click the rank badge to see the full State ranking.Click here to see the full State ranking.
Net patient income Info Net patient income: net patient revenue minus the home's total operating expenses. A positive figure means it earns more from resident care than it spends to deliver it; a negative figure means the opposite. It excludes non-operating "other income."
-$5.3M
Other income Info Money the home earns outside of resident care — such as investments, grants, rentals and other non-operating sources (CMS cost report, Worksheet G-3). It is tracked separately from net patient revenue: it is not part of that figure, and it is not included in net patient income.
$3.0M
Payroll costs Info Staff salaries plus wage-related costs — benefits such as payroll taxes, health insurance and retirement — from the home's own accounting records (CMS cost report, Worksheet A). Contract or agency labor is counted separately, under other operating costs. Rank #9 / 209Payroll — State benchmarkedThis home is ranked 9th out of 209 homes in Pennsylvania. Shows total annual staff payroll benchmarked to the Pennsylvania average. Higher payroll investment relative to peers often signals better staffing and less reliance on cheaper contract labor.Rankings are based only on facilities in Pennsylvania that report data for that category. Facilities without available data are excluded from the ranking.Click the rank badge to see the full State ranking.Click here to see the full State ranking.
$21.1M 58.8% of net patient revenue Info Payroll as a share of revenue: staff salaries and wage-related benefits divided by net patient revenue. A higher figure means more of each revenue dollar goes to staff pay. Rank #145 / 209Payroll % — State benchmarkedThis home is ranked 145th out of 209 homes in Pennsylvania. Shows payroll as a percentage of revenue versus the Pennsylvania average. Well-run Pennsylvania facilities typically land around 53–61% — the top third Statewide. Below 25% may signal understaffing or heavy agency use — read with Staffing ratings.Rankings are based only on facilities in Pennsylvania that report data for that category. Facilities without available data are excluded from the ranking.Click the rank badge to see the full State ranking.Click here to see the full State ranking.
Other operating costs Info Everything it costs to run the home apart from payroll — food, utilities, supplies, maintenance, contract labor and administration. Calculated as total operating expense minus payroll (staff salaries and wage-related benefits).
$20.0M
Total costs Info The home's total operating expense for the year — all the costs of running it, salaries included (CMS cost report, Worksheet G-3).
$41.1M

What does this home offer?

Minimum age icon
Minimum age icon

Minimum Age: 65 Years Old

Housing options icon

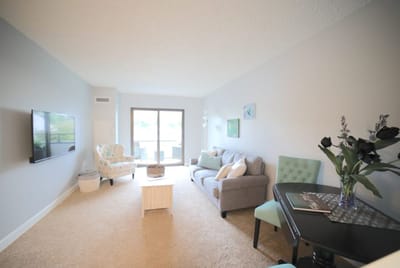
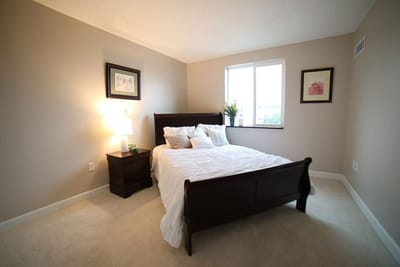
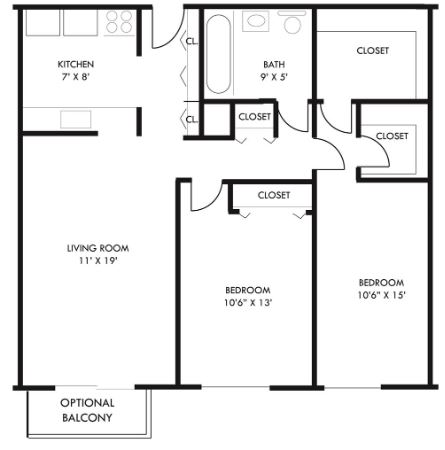
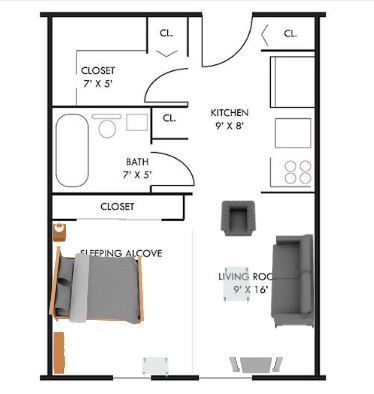
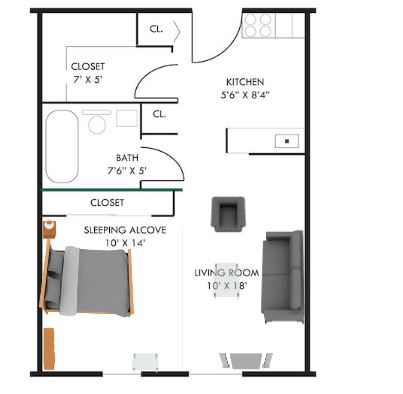
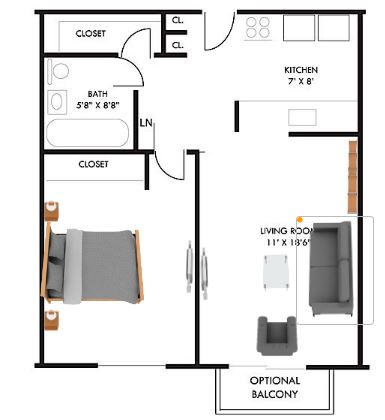
Housing Options: Studio / 1 Bed / 2 Bed

Building type icon
Building type icon

Building Type: Mid-rise

Transportation services icon

Transportation Services

Fitness and recreation icon

Fitness and Recreation

Who this home usually serves

TYPE OF STAY

Mostly short-term rehab stays

Most residents typically stay for a few weeks or months before returning home or moving on.

Most new residents arrive under Medicare (63% of admissions), and a typical Medicare stay runs around 19 days.

Admissions
583 total

Coverage residents most often arrive under.

Medicare 63%
Private pay 35%
Medicaid 2%
Discharges
529 total

Coverage residents most often leave under.

Medicare 65%
Private pay 23%
Medicaid 12%

Living Spaces & Floor Plans for The Terrace at Phoebe Allentown

Places of interest near The Terrace at Phoebe Allentown

Address 1.8 miles from city center Info Estimated distance in miles from Allentown's city center to The Terrace at Phoebe Allentown's address, calculated via Google Maps. — 0.34 miles to nearest hospital (Lehigh Valley Hospitalu201317th Street)

Calculate Travel Distance to The Terrace at Phoebe Allentown

Add your location

Address

Compare Nursing Homes around Allentown

The information below is reported by the Pennsylvania Department of Human Services and Department of Health.

5 facilities compared · CMS & PA Dept. of Health data

Cedarbrook Senior Care and Rehab
NH
HOS
IL
MC
PC
RC
SNF
Allentown (South Cedarbrook Road)
670
Facility 670
PA AVG 94
Rank #1 / 555
75.8%
Facility 75.8%
PA AVG 78.7%
Rank #208 / 518
-4%
4.64
Facility 4.64
PA AVG 4.15
Rank #70 / 207
-5% +12%
$0
Facility $0
PA AVG $61.2k
Rank #1 / 210
-
12
Facility 12
PA AVG 31.3
Rank #78 / 207
4.0
Facility 4.0
PA AVG 4.4
Rank #115 / 207
- 508 -
22
Facility 22
PA AVG 46
Rank #521 / 668
County Of Lehigh Pennsylvania
$18.5MFiscal year ending 12/2023
Facility $18.5MFiscal year ending 12/2023
PA AVG $32.8M
Rank #6 / 209
$38.7MFiscal year ending 12/2023
Facility $38.7MFiscal year ending 12/2023
PA AVG $6.7M
Rank #3 / 209
208.9%Fiscal year ending 12/2023
Facility 208.9%Fiscal year ending 12/2023
PA AVG 40%
Rank #16 / 209
395465
Riverton Enhanced Senior Living
NH
AL
IL
MC
RC
SNF
Allentown (Rittersville)
90
Facility 90
PA AVG 94
Rank #251 / 555
76.7%
Facility 76.7%
PA AVG 78.7%
Rank #194 / 518
-3%
3.51
Facility 3.51
PA AVG 4.15
Rank #174 / 207
+19% -15%
$0
Facility $0
PA AVG $61.2k
Rank #1 / 210
91
Facility 91
PA AVG 83
Rank #112 / 460
7
Facility 7
PA AVG 31.3
Rank #46 / 207
1.4
Facility 1.4
PA AVG 4.4
Rank #19 / 207
- 69 -
56
Facility 56
PA AVG 46
Rank #237 / 668
Lee-Anne Liberatore
$16.0MFiscal year ending 12/2023
Facility $16.0MFiscal year ending 12/2023
PA AVG $32.8M
Rank #140 / 209
$7.2MFiscal year ending 12/2023
Facility $7.2MFiscal year ending 12/2023
PA AVG $6.7M
Rank #127 / 209
45.1%Fiscal year ending 12/2023
Facility 45.1%Fiscal year ending 12/2023
PA AVG 40%
Rank #76 / 209
395171
Good Shepherd Home Raker Center
NH
SNF
Allentown (Fairview)
99
Facility 99
PA AVG 94
Rank #226 / 555
- -
3.36
Facility 3.36
PA AVG 4.15
Rank #186 / 207
+40% -19%
$0
Facility $0
PA AVG $61.2k
Rank #1 / 210
-
12
Facility 12
PA AVG 31.3
Rank #78 / 207
3.0
Facility 3.0
PA AVG 4.4
Rank #71 / 207
- 97 -
60
Facility 60
PA AVG 46
Rank #209 / 668
- - - - 395018
Complete Care at Lehigh Center
NH
HOS
PC
RC
SNF
Macungie (Spring Creek Road)
128
Facility 128
PA AVG 94
Rank #98 / 555
94.3%
Facility 94.3%
PA AVG 78.7%
Rank #22 / 518
+20%
3.47
Facility 3.47
PA AVG 4.15
Rank #174 / 207
-38% -16%
$0
Facility $0
PA AVG $61.2k
Rank #1 / 210
-
11
Facility 11
PA AVG 31.3
Rank #72 / 207
3.7
Facility 3.7
PA AVG 4.4
Rank #107 / 207
- 123 -
18
Facility 18
PA AVG 46
Rank #548 / 668
-
$15.3MFiscal year ending 12/2023
Facility $15.3MFiscal year ending 12/2023
PA AVG $32.8M
Rank #148 / 209
$7.4MFiscal year ending 12/2023
Facility $7.4MFiscal year ending 12/2023
PA AVG $6.7M
Rank #135 / 209
48.5%Fiscal year ending 12/2023
Facility 48.5%Fiscal year ending 12/2023
PA AVG 40%
Rank #73 / 209
395939
The Terrace at Phoebe Allentown
NH
IL
MC
RC
SNF
Allentown
343
Facility 343
PA AVG 94
Rank #4 / 555
60.7%
Facility 60.7%
PA AVG 78.7%
Rank #346 / 518
-23%
3.98
Facility 3.98
PA AVG 4.15
Rank #122 / 207
-50% -4%
$11.1k
Facility $11.1k
PA AVG $61.2k
Rank #158 / 210
-
13
Facility 13
PA AVG 31.3
Rank #82 / 207
2.2
Facility 2.2
PA AVG 4.4
Rank #44 / 207
1 240 -
82
Facility 82
PA AVG 46
Rank #68 / 668
Michelle Morton
$35.8MFiscal year ending 06/2024
Facility $35.8MFiscal year ending 06/2024
PA AVG $32.8M
Rank #12 / 209
$21.1MFiscal year ending 06/2024
Facility $21.1MFiscal year ending 06/2024
PA AVG $6.7M
Rank #9 / 209
58.8%Fiscal year ending 06/2024
Facility 58.8%Fiscal year ending 06/2024
PA AVG 40%
Rank #145 / 209
395080

Financial Assistance for
Nursing Home in Pennsylvania

The Terrace at Phoebe Allentown is located in Allentown, Pennsylvania.
Here are the financial assistance programs available to residents in Pennsylvania.

Get Financial aid guidance

Community HealthChoices (CHC)

PA Medicaid CHC

Age 65+ or disabled
General Pennsylvania resident, Medicaid-eligible, nursing home-level care need.
Income Limits (2025) ~$2,829/month 300% FBR, individual
Asset Limits $2,000 (individual), $3,000 (couple) (excludes home, car).
PA

Managed care model; high urban demand (e.g., Philadelphia, Pittsburgh).

Benefits
Personal care (5-7 hours/day, e.g., bathing, dressing) Respite care (up to 240 hours/year) Adult day care ($70/day) Home modifications ($1,500 avg.)

Pennsylvania OPTIONS Program

PA OPTIONS

Age 60+
General Pennsylvania resident, at risk of nursing home placement.
Income Limits ~$2,000/month individual, varies by region
Asset Limits $8,000 individual
PA

Cost-sharing required above certain income; rural/urban balance.

Benefits
In-home care (3-5 hours/week) Respite (up to 10 days/year) Adult day care (~$70/day) Transportation (~5 trips/month)

Living Independence for the Elderly (LIFE)

Pennsylvania LIFE (PACE)

Age 55+
General PA resident (specific counties), NFLOC, safe with LIFE support.
Income Limits (2025) ~$2,829/month (Medicaid-eligible); private pay option available.
Asset Limits $2,000 (individual), $3,000 (couple) for Medicaid enrollees.
PA

16 providers in 25 counties (e.g., Allegheny, Luzerne); LIFE branding unique to PA.

Benefits
Personal care (5-7 hours/day) Medical care Meals Transportation Respite Therapies

Medicare Savings Program (MSP)

Pennsylvania Medicare Savings Program

Age 65+ or disabled
General PA resident, Medicare Part A/B.
Income Limits (2025) ~$2,510/month (QMB), ~$3,380/month (SLMB), ~$3,598/month (QI)—individual.
Asset Limits $9,430 (individual), $14,130 (couple).
PA

Three tiers; includes Extra Help for Part D; no waitlist.

Benefits
Covers Part B premiums ($174.70/month) Deductibles ($240/year) Copays (~20%)

Family Caregiver Support Program (FCSP)

Pennsylvania Family Caregiver Support Program

Age
General Caregivers of 60+ needing care or 55+ caregivers of others; PA resident; functional needs (2+ ADLs).
Income Limits (2025) No strict cap; reimbursements up to $600/month if care recipient income < ~$2,322/month 185% FPL
Asset Limits Not assessed; need-based.
PA

High demand; includes grandparent caregivers.

Benefits
Respite (4-6 hours/week or 5 days/year) Adult day care ($60/day) Supplies (~$2,000/year) Caregiver training

VA Aid and Attendance (A&A) and Housebound Benefits

Pennsylvania VA Aid and Attendance/Housebound

Age 65+ or disabled veteran/spouse
General PA resident, wartime service, need for ADL help (A&A) or homebound.
Income Limits (2025) Net income < ~$1,984/month (veteran with dependent, A&A); pension offsets income.
Asset Limits ~$155,356 net worth limit
PA

High veteran population; supports rural/urban care needs.

Benefits
Cash (~$1,433-$2,642/month veteran, ~$951-$1,318 spouse) for care costs (e.g., in-home, assisted living)

Property Tax/Rent Rebate Program (PTRR)

Pennsylvania Property Tax/Rent Rebate Program

Age 65+
General PA resident, homeowner/renter (or widow/er 50+, disabled 18+).
Income Limits (2025) ~$45,000/year individual or couple, excludes half of Social Security
Asset Limits Not assessed; income-focused.
PA

Rebates up to $1,000; ~600,000 eligible annually.

Benefits
Rebates ($250-$1,000 based on income; e.g., $1,000 if income < $8,000)

Senior Farmers’ Market Nutrition Program (SFMNP)

Pennsylvania SFMNP

Age 60+
General PA resident, low-income.
Income Limits (2025) ~$2,322/month individual, 185% FPL
Asset Limits Not assessed.
PA

Vouchers (~$50/season) via 52 AAAs; serves ~200,000 annually.

Benefits
Vouchers (~$50/season) for fresh produce at approved markets

Frequently Asked Questions about The Terrace at Phoebe Allentown

Is The Terrace at Phoebe Allentown in a walkable area?

The Terrace at Phoebe Allentown has a walk score of 82. Very walkable. Most errands can be accomplished on foot, and many essentials are within a short walk.

What is the occupancy rate at The Terrace at Phoebe Allentown?

The Terrace at Phoebe Allentown's occupancy is 60.7%.

Does The Terrace at Phoebe Allentown operate as a for-profit or non-profit?

The Terrace at Phoebe Allentown is registered as a non-profit.

Are there photos of The Terrace at Phoebe Allentown?

Yes — there are 6 photos of The Terrace at Phoebe Allentown in the photo gallery on this page.

What is the address of The Terrace at Phoebe Allentown?

The Terrace at Phoebe Allentown is located at 1940 W Turner St, Allentown, PA 18104.

What is the phone number of The Terrace at Phoebe Allentown?

(610) 794-5555 will put you in contact with the team at The Terrace at Phoebe Allentown.

Is The Terrace at Phoebe Allentown Medicare or Medicaid certified?

Yes — The Terrace at Phoebe Allentown is a CMS-certified provider of Medicare and Medicaid.

Guides for Better Senior Living

Care Cost Calculator: See Prices in Your Area

Nursing Home Data Explorer

Don’t Wait Too Long: 7 Red Flag Signs Your Parent Needs Assisted Living Now

The True Cost of Assisted Living in 2025 – And How Families Are Paying For It

Understanding Senior Living Costs: Pricing Models, Discounts & Financial Assistance