Cerenity Humboldt
Nursing Home, Assisted Living, Hospice Care, Memory Care & Respite Care · St. Paul, MN
CMS overall rating Info CMS (the Centers for Medicare & Medicaid Services) is the federal agency that rates nursing home quality. Its Overall Rating runs from 1 to 5 stars, combining health inspections, staffing, and quality measures, with inspections weighted most heavily.

Cerenity Humboldt

Nursing Home, Assisted Living, Hospice Care, Memory Care & Respite Care · St. Paul, MN
CMS overall rating Info CMS (the Centers for Medicare & Medicaid Services) is the federal agency that rates nursing home quality. Its Overall Rating runs from 1 to 5 stars, combining health inspections, staffing, and quality measures, with inspections weighted most heavily.
Calculator: See prices in your area
Cerenity Humboldt accepts Medicare, Medicaid, and private pay.

Overview of Cerenity Humboldt

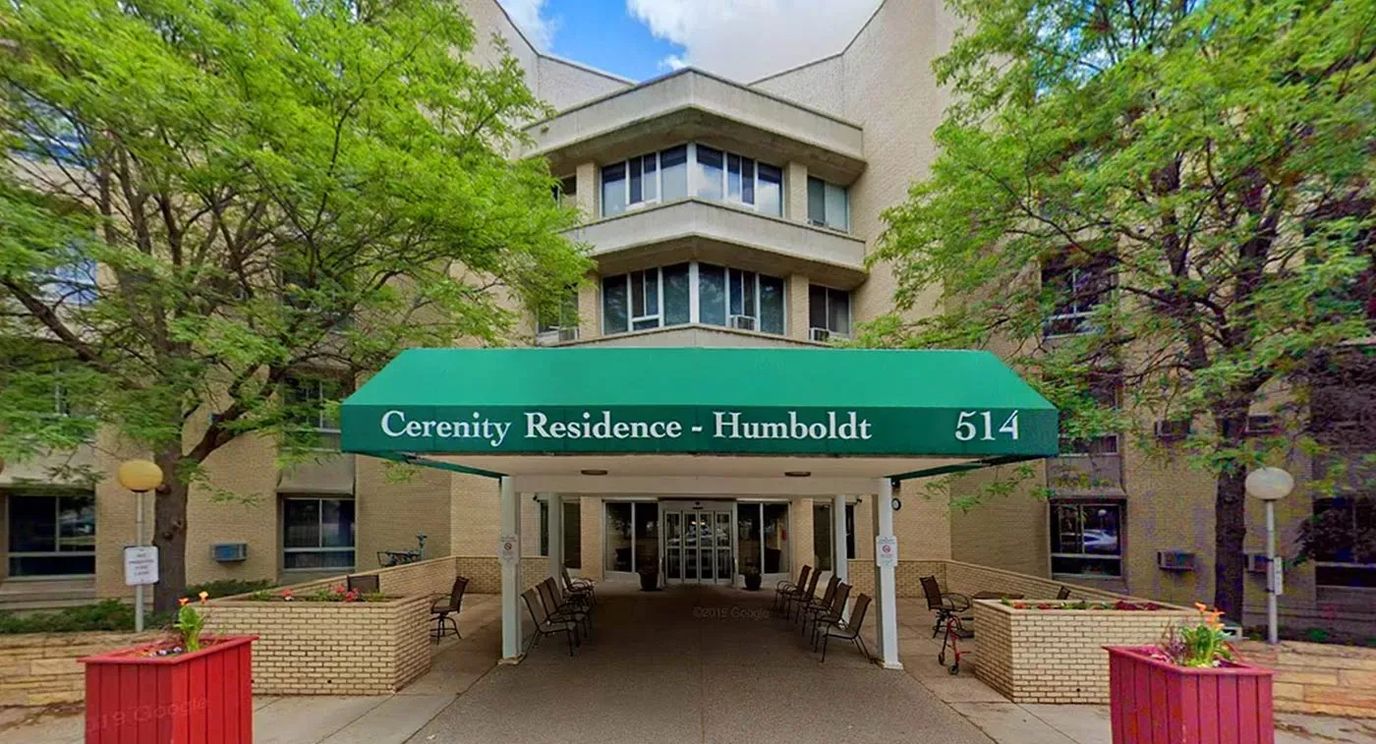
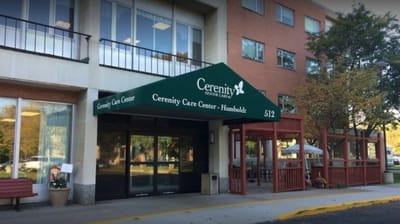
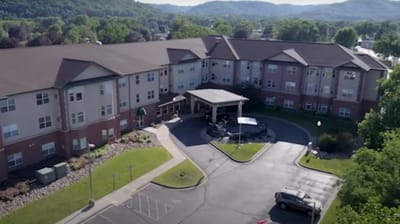
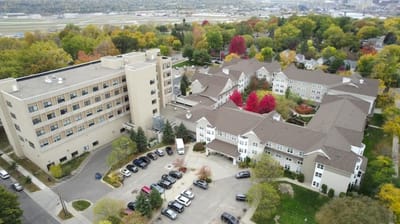
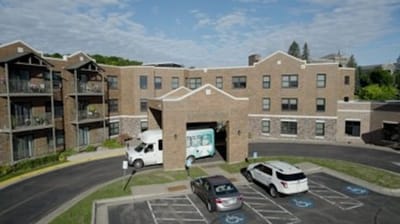
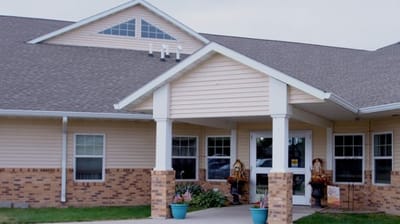
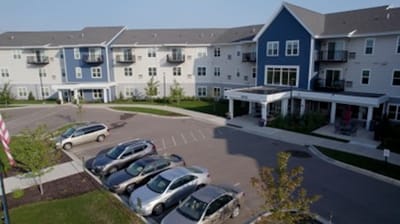
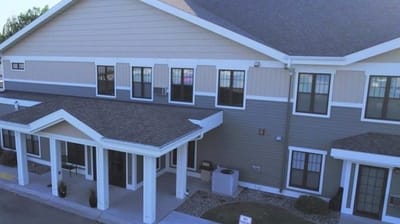
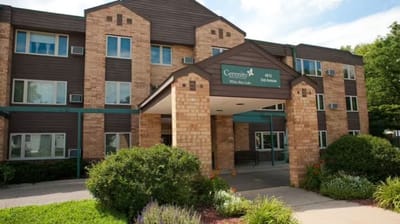
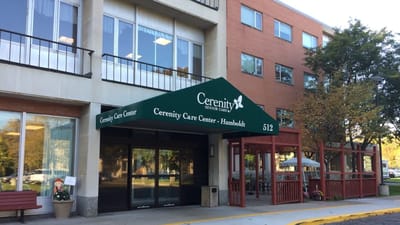
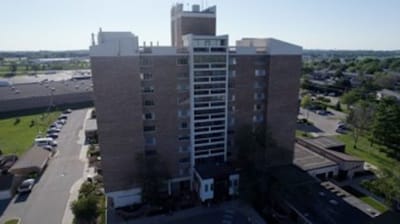
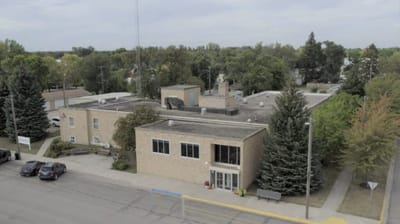
As the name suggests, Cerenity Humboldt houses assisted living, memory care, skilled nursing, rehabilitation living options in St. Paul, MN. All living options are provided with personalized care where each resident is able to   receive assistance and care that is based on their needs. The services and programs they provide are fitting to the holistic wellness of each resident who needs assistance with mental and physical aspects; their wellness programs and enriching activities allow for an innovative approach to a healthy mental, physical, and emotional aspects of their bodies to be nurtured. Cerenity Humboldt celebrates individuality which is where residents are encouraged to still live freely within the community with the help of the staff who are assured to provide care and service with compassion and respect. 
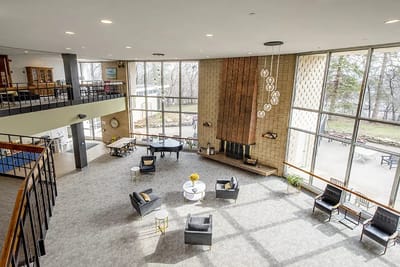
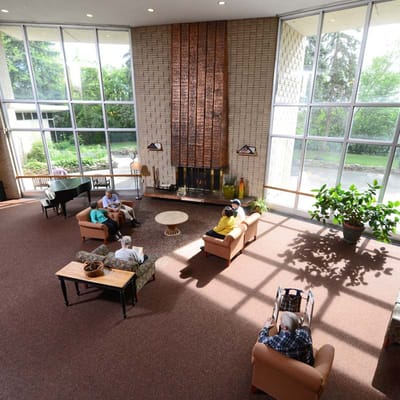
Residency at Cerenity Humboldt is a good place to spend your golden years, especially because there’s a lot of features that the community has to offer– 117 affordable apartments for seniors who want to live independently yet still prefer having additional support with everyday living. All residents receive essential services such as concierge, scheduled transportation, housekeeping and linen services, housekeeping; while every resident that is outside of independent living care receives most ADLs (i.e. medication management, bathing, grooming, eating, walking). 

(651) 222-2273

Quality ratings

Measured by Centers for Medicare & Medicaid Services (CMS)

Overall rating Info The Overall CMS Rating combines results from health inspections, staffing levels and quality measures. Health inspections carry the most weight. Staffing and quality scores can increase or decrease the final rating based on performance compared to state and national standards.
▼ 68.6% Below MN avg. ▼ 68.6% Below MN avg.MN average: 3.2Click the badge to see the full State ranking.Click here to see the full State ranking.
Health Inspection Info Based on the results of the facility's three most recent standard inspections and any complaint investigations. CMS reviews the number, scope, and severity of deficiencies, with more recent findings weighted more heavily.
▼ 64.4% Below MN avg. ▼ 64.4% Below MN avg.MN average: 2.8Click the badge to see the full State ranking.Click here to see the full State ranking.
Staffing Info Measures average nursing staff hours per resident per day, including Registered Nurses (RNs) and total nursing staff. Ratings are adjusted based on the level of care residents require and are compared to state and national benchmarks.
▼ 2.3% Below MN avg. ▼ 2.3% Below MN avg.MN average: 4.1Click the badge to see the full State ranking.Click here to see the full State ranking.
Quality Measures Info Based on clinical and physical health indicators reported to CMS, such as hospital readmissions, falls, pressure ulcers, and improvements in mobility. These measures reflect how well residents' health needs are being managed.
▼ 4.1% Below MN avg. ▼ 4.1% Below MN avg.MN average: 3.1Click the badge to see the full State ranking.Click here to see the full State ranking.

Staffing hours breakdown

Info Daily nursing hours per resident by staff type, reported to CMS. Higher is generally better — compare this facility to state and national averages to see where staffing stands.

Hours per resident per day — compared to Minnesota state averages

Total nursing care / resident Info This home is ranked 59th out of 89 homes in Minnesota for nurse hours. Total adjusted nursing hours per resident per day, combining RN, LPN, and aide time. CMS adjusts this for case-mix so facilities can be fairly compared.
4h 13m per day
Rank #59 / 89Nurse hours — State benchmarkedThis home is ranked 59th out of 89 homes in Minnesota. Shows adjusted nurse hours per resident per day benchmarked to the Minnesota average, with a ranking across 89 Minnesota facilities. More hours mean more direct care. The national average is about 3.5 hrs; below 3.0 is a red flag.Rankings are based only on facilities in Minnesota that report data for that category. Facilities without available data are excluded from the ranking.Click the rank badge to see the full State ranking.Click here to see the full State ranking.
This facility Minnesota avg (4h 46m per day)
vs Minnesota avg
-12%

5 of 6 metrics below state avg

Standout metric LPN / LVN is +50% above state avg
Staff typeHours / Day / Residentvs state avg
Registered Nurse (RN) Info RNs hold the highest nursing license and can assess residents, interpret test results, and direct care plans. More RN hours per day often signals stronger clinical oversight and faster response to health changes. 53m per day ▼ 18% State avg: 1h 4m per day · National avg: 41m per day
LPN / LVN Info Licensed Practical Nurses (LPNs) or Licensed Vocational Nurses (LVNs) deliver routine hands-on care — medication administration, wound dressing, and monitoring vital signs. They work under RN supervision and make up a large share of daily bedside care. 56m per day ▲ 50% State avg: 37m per day · National avg: 52m per day
Nurse Aide Info Certified Nurse Aides (CNAs) provide the most direct day-to-day assistance: bathing, dressing, feeding, and mobility. Nurse aide hours are typically the largest staffing category and directly affect residents' quality of life. 2h 4m per day ▼ 17% State avg: 2h 30m per day · National avg: 2h 20m per day
Weekend Total Nursing Info Combined nursing hours (RN + LPN + Nurse Aide) per resident per day on weekends. Staffing often drops on weekends — this figure reveals whether the facility maintains adequate coverage outside of weekday hours. 3h 22m per day ▼ 8% State avg: 3h 40m per day · National avg: 3h 27m per day
Physical Therapist Info Hours per resident per day provided by licensed Physical Therapists (PTs) or PT Assistants. PT services help residents recover mobility after injury or illness and are especially important for post-acute (short-stay) rehabilitation. 4m per day ▼ 6% State avg: 5m per day · National avg: 4m per day
Weekend RN Info Registered nurse hours specifically on weekends. Facilities sometimes reduce RN presence on Saturdays and Sundays — a low weekend RN figure compared to weekday hours can indicate reduced clinical oversight when most administrative staff are absent. 37m per day ▼ 11% State avg: 41m per day · National avg: 29m per day

Capacity and availability

Avg. Length of Stay
263 days
Bed community size
115-bed community Rank #88 / 532Bed count — State benchmarkedThis home is ranked 88th out of 532 homes in Minnesota. Shows this facility's certified or reported bed count compared to other Minnesota facilities. Larger communities may offer more amenities, programs, and on-site services for residents and families.Rankings are based only on facilities in Minnesota that report data for that category. Facilities without available data are excluded from the ranking.Click the rank badge to see the full State ranking.Click here to see the full State ranking.
A larger shared setting that may offer more common spaces and organized community services.
Walk Score
Walk Score: 73 / 100 Rank #90 / 632Walk Score — State benchmarkedThis home is ranked 90th out of 632 homes in Minnesota. Shows how walkable this facility's neighborhood is compared to the average Walk Score across Minnesota facilities. Higher scores benefit residents, families, and staff.Rankings are based only on facilities in Minnesota that report data for that category. Facilities without available data are excluded from the ranking.Click the rank badge to see the full State ranking.Click here to see the full State ranking.
Very walkable. Most errands can be accomplished on foot, and many essentials are within a short walk.

About this community

Occupancy

Occupancy rate
85%
Rank #106 / 331Occupancy rate — State benchmarkedThis home is ranked 106th out of 331 homes in Minnesota. Shows this facility's occupancy rate versus the Minnesota average, with its Statewide rank out of 331. Higher occupancy signals strong local demand and financial stability.Rankings are based only on facilities in Minnesota that report data for that category. Facilities without available data are excluded from the ranking.Click the rank badge to see the full State ranking.Click here to see the full State ranking.
Higher than the Minnesota average: 79.7%
Occupied beds
98 / 115
Average occupied beds in Minnesota homes 59 beds

License Details

Facility TypeAssisted Living
CountyRamsey
CMS Certification Number245255

Staffing

Key information about the people who lead and staff this community.

Leadership

ContactAnna Perez

Therapy & Rehabilitation

2 services
Rehabilitation Services
Respite Care

Staffing & Medical

1 service
Doctor on Staff

Additional Services

1 service
Home Care

Additional Policies & Features

Pets Allowed

Amenities & Lifestyle

Specific ProgramsBenedictine Experience, Dining Experience, Life Enrichment, Transportation, Comfort & Safety, Clean Environment, Spiritual Care, Pets, Living & Care, Living Options

Dining & Nutrition

Food DescriptionThe dining program at Cerenity Humboldt emphasizes a culinary experience that caters to diverse tastes and backgrounds.

Performance summary

Key indicators of commitment to quality care and safety.

Scores

Food Quality Score
69.1% Moderate

Based on the Minnesota Department of Health, Health Regulation Division surveys measuring satisfaction with food quality and meal service.

Community Activities Score
72.4% Moderate

Based on the Minnesota Department of Health, Health Regulation Division surveys measuring meaningful activities and engagement opportunities.

Safety & Privacy Score
88.2% High

Based on the Minnesota Department of Health, Health Regulation Division surveys measuring safety and privacy conditions for residents.

Religion & Spirituality Score
82.4% High

Based on the Minnesota Department of Health, Health Regulation Division surveys measuring support for religious and spiritual needs.

Family Satisfaction - Care
67.9% Moderate

Based on the Minnesota Department of Health, Health Regulation Division surveys measuring family satisfaction with overall care experience.

Family Satisfaction - Cost
64.4% Moderate

Based on the Minnesota Department of Health, Health Regulation Division surveys measuring family satisfaction with value and cost of care.

Family Satisfaction - Housekeeping
65.9% Moderate

Based on the Minnesota Department of Health, Health Regulation Division surveys measuring family satisfaction with cleanliness and housekeeping.

Contact Cerenity Humboldt

Health Inspection History

Inspections since 2023
Total health inspections 9

Minnesota average 6


Last Health inspection on May 2025

Total health citations
45 Rank #77 / 90Health citations — State benchmarkedThis home is ranked 77th out of 90 homes in Minnesota. Shows this facility's total health deficiency citations benchmarked to the Minnesota State average, with a ranking across all 90 MN facilities. Lower citation counts earn a better rank.Rankings are based only on facilities in Minnesota that report data for that category. Facilities without available data are excluded from the ranking.Click the rank badge to see the full State ranking.Click here to see the full State ranking.

Minnesota average 23.2

Citations per inspection
5 Rank #67 / 90Citations per inspection — State benchmarkedThis home is ranked 67th out of 90 homes in Minnesota. Shows average deficiency citations per CMS inspection for this facility versus the Minnesota mean across 90 facilities with citation data. Lower is better.Rankings are based only on facilities in Minnesota that report data for that category. Facilities without available data are excluded from the ranking.Click the rank badge to see the full State ranking.Click here to see the full State ranking.

Minnesota average 3.76


Health citations are formal notices following inspections when they fail to comply with safety and care standards.

20 of 45 citations resulted from standard inspections; 19 of 45 resulted from complaint investigations; and 6 of 45 came from combined inspections (standard and complaint).

Breakdown of citation severity (last 3 years)
Critical health citations
1
43% worse than Minnesota average

Minnesota average: 0.7


Serious health citations
5
900% worse than Minnesota average

Minnesota average: 0.5

1 critical citation Minnesota average: 0.7

5 serious citations Minnesota average: 0.5

37 moderate citations Minnesota average: 21.2

2 minor citations Minnesota average: 0.8
Citations history (last 3 years)
Administration moderate citation May 15, 2025
Corrected

Nursing Services serious citation May 15, 2025
Corrected

Nutrition moderate citation May 15, 2025
Corrected

Pharmacy moderate citation May 15, 2025
Corrected

Staffing Data

Reporting period: October 1 – December 31, 2025 (Q4 2025). Source: CMS Payroll-Based Journal report.

Total staff 261
Employees 128
Contractors 133
Staff to resident ratio 3.07 : 1
41% more staff per resident than Minnesota average
Minnesota average ratio: 2.19 : 1 Minnesota average ratio: 2.19 : 1See full Minnesota ranking
Avg staff/day 47
Average shift 7.7 hours
0% compared with Minnesota average
Minnesota average: 7.5 hours Minnesota average shift: 7.5 hoursSee full Minnesota ranking
Total staff hours (quarter) 33,194

Nursing staff breakdown

Q4 2025 · Oct 1 – Dec 31 More info This data comes from the CMS Payroll-Based Journal report covering October 1 – December 31, 2025.
Registered Nurse

Manages medical care and health needs.

RN Staff Info 42 total: 10 full-time employees and 32 contractors. 42
Average shift length Info Average shift length. Calculated as total hours divided by days worked and average staff per day. 7.5 hours
Licensed Practical Nurse

Assists with medical care and medications.

LPN Staff Info 32 total: 21 full-time employees and 11 contractors. 32
Average shift length Info Average shift length. Calculated as total hours divided by days worked and average staff per day. 8.1 hours
Certified Nursing Assistant

Helps with daily care and mobility.

CNA Staff Info 128 total: 43 full-time employees and 85 contractors. 128
Average shift length Info Average shift length. Calculated as total hours divided by days worked and average staff per day. 7.8 hours

Contractor staffing

Q4 2025 · Oct 1 – Dec 31 More info This data comes from the CMS Payroll-Based Journal report covering October 1 – December 31, 2025.

Total hours from contractors

16%

5,311 contractor hours this quarter

Certified Nursing Assistant: 85 Registered Nurse: 32 Licensed Practical Nurse: 11 Nurse Practitioner: 2 Qualified Social Worker: 1 Medical Director: 1 Occupational Therapy Assistant: 1

Staff by category

Q4 2025 · Oct 1 – Dec 31 More info This data comes from the CMS Payroll-Based Journal report covering October 1 – December 31, 2025.
Certified Nursing Assistant438512814,10892100%7.8
Licensed Practical Nurse2111326,13492100%8.1
Registered Nurse1032424,66192100%7.5
Physical Therapy Assistant7079907076%6.7
Clinical Nurse Specialist2029446571%8
Dietitian3037837177%7.1
Speech Language Pathologist110116856874%5.7
Occupational Therapy Aide2025766368%8
Other Dietary Services Staff2025356368%7.9
Respiratory Therapy Technician8085067278%6.2
Nurse Practitioner0224876368%7.6
Physical Therapy Aide7074756368%6.4
Dental Services Staff1014606065%7.7
Mental Health Service Worker1014605863%7.9
Administrator2024525762%7.9
Qualified Social Worker4153976470%6
RN Director of Nursing1012923639%8.1
Medication Aide/Technician3032212628%7.9
Occupational Therapy Assistant0112233%7.3
Medical Director011633%2
128 Certified Nursing Assistant
% of Days 100%
32 Licensed Practical Nurse
% of Days 100%
42 Registered Nurse
% of Days 100%
7 Physical Therapy Assistant
% of Days 76%
2 Clinical Nurse Specialist
% of Days 71%
3 Dietitian
% of Days 77%
11 Speech Language Pathologist
% of Days 74%
2 Occupational Therapy Aide
% of Days 68%
2 Other Dietary Services Staff
% of Days 68%
8 Respiratory Therapy Technician
% of Days 78%
2 Nurse Practitioner
% of Days 68%
7 Physical Therapy Aide
% of Days 68%
1 Dental Services Staff
% of Days 65%
1 Mental Health Service Worker
% of Days 63%
2 Administrator
% of Days 62%
5 Qualified Social Worker
% of Days 70%
1 RN Director of Nursing
% of Days 39%
3 Medication Aide/Technician
% of Days 28%
1 Occupational Therapy Assistant
% of Days 3%
1 Medical Director
% of Days 3%

Penalties and fines

Includes penalties issued in 2024-2025

Federal penalties imposed by CMS for regulatory violations, including civil money penalties (fines) and denials of payment for new Medicare/Medicaid admissions.

Source: CMS Penalties Database (Data as of Jan 2026)

Total fines amount $106K Rank #79 / 90Federal fines — State benchmarkedThis home is ranked 79th out of 90 homes in Minnesota. Shows this facility's cumulative CMS federal fine dollars versus the Minnesota average among facilities with fines, and where it ranks among 90 facilities in the pool. Lower total dollars mean a better rank.Rankings are based only on facilities in Minnesota that report data for that category. Facilities without available data are excluded from the ranking.Click the rank badge to see the full State ranking.Click here to see the full State ranking.
138% higher than Minnesota average

Minnesota average: $44K

Number of fines 2
In line with Minnesota average

Minnesota average: 2.0

Payment Denials Info Serious action where Medicare and/or Medicaid temporarily stops payments for new residents until issues are fixed. 1
130% more payment denials than Minnesota average

Minnesota average: 0.4

Fines amount comparison
This facility $106K
Minnesota average $44K
Penalty History

Penalties are imposed by CMS for violations of federal nursing home regulations.

3 penalties in the past 3 years

Multiple penalties were reported in the last 3 years.

Civil Money Penalty Info Fines imposed for noncompliance, which can be assessed per day or per instance of violation. May 15, 2025
$80K
Civil Money Penalty Info Fines imposed for noncompliance, which can be assessed per day or per instance of violation. Dec 5, 2024
$26K
Payment Denial Info Serious action where Medicare and/or Medicaid temporarily stops payments for new residents until issues are fixed. May 22, 2024
4 days

Last updated: Jan 2026

Quality of care over time

These measures show how residents usually do over time at this home, based on health outcomes and preventive care.

High-risk clinical events score Info A composite score based on pressure ulcers, falls with injury, weight loss, walking ability decline, and activities of daily living decline. 13.4
21% worse than Minnesota average

Minnesota average: 11.1

Functional decline score Info A composite score based on activities of daily living decline, walking ability decline, and incontinence. 26.7
18% worse than Minnesota average

Minnesota average: 22.6

Long-stay resident measures
Need for Help with Daily Activities Increased Info Percent of long-stay residents whose need for help with daily activities has increased 28.8%
52% worse than Minnesota average

Minnesota average: 18.9%

Walking Ability Worsened Info Percent of long-stay residents whose ability to move independently worsened 26.8%
13% worse than Minnesota average

Minnesota average: 23.8%

Low Risk Residents with Bowel/Bladder Incontinence Info Percent of low risk long-stay residents who lose control of their bowels or bladder 24.4%
In line with Minnesota average

Minnesota average: 25.0%

Falls with Major Injury Info Percent of long-stay residents experiencing one or more falls with major injury 2.4%
35% better than Minnesota average

Minnesota average: 3.7%

High Risk Residents with Pressure Ulcers Info Percent of long-stay high risk residents with pressure ulcers 4.4%
20% better than Minnesota average

Minnesota average: 5.4%

Urinary Tract Infection Info Percent of long-stay residents with a urinary tract infection 2.1%
24% better than Minnesota average

Minnesota average: 2.7%

Lost Too Much Weight Info Percent of long-stay residents who lose too much weight 4.6%
11% worse than Minnesota average

Minnesota average: 4.1%

Depressive Symptoms Info Percent of long-stay residents who have depressive symptoms 4.8%
9% worse than Minnesota average

Minnesota average: 4.4%

Antipsychotic Use Info Percent of long-stay residents who received an antipsychotic medication 13.9%
19% better than Minnesota average

Minnesota average: 17.2%

Pneumococcal Vaccine Info Percent of long-stay residents assessed and appropriately given the pneumococcal vaccine 94.3%
In line with Minnesota average

Minnesota average: 97.3%

Influenza Vaccine Info Percent of long-stay residents assessed and appropriately given the seasonal influenza vaccine 95.5%
In line with Minnesota average

Minnesota average: 96.0%

Short-stay resident measures
Pneumococcal Vaccine Info Percent of short-stay residents assessed and appropriately given the pneumococcal vaccine 87.4%
In line with Minnesota average

Minnesota average: 88.9%

Antipsychotic medication increase Info Percent of short-stay residents who newly received an antipsychotic medication 5.4%
181% worse than Minnesota average

Minnesota average: 1.9%

Influenza Vaccine Info Percent of short-stay residents assessed and appropriately given the seasonal influenza vaccine 79.3%
In line with Minnesota average

Minnesota average: 82.6%

Breakdown by payment type

Medicare

17% of new residents, usually for short-term rehab.

Typical stay 23 days

Private pay

54% of new residents, often for short stays.

Typical stay 1 - 2 months

Medicaid

29% of new residents, often for long-term daily care.

Typical stay 6 - 7 months

Facility Characteristics

Source: CMS Long-Term Care Facility Characteristics (Data as of Jan 2026)

Total residents 85
Medicare
3
3.5% of residents
Medicaid
51
60% of residents
Private pay or other
31
36.5% of residents
Programs & Services
Residents Group

Residents meet regularly to discuss policies, care quality, and activities

Nurse Aide Training

State-approved Nurse Aide Training and Competency Evaluation Program on-site

Active Resident Council

Organized group of residents that meets regularly to discuss facility policies, quality of life, and activities.

Finances and operations

Based on CMS SNF Cost Report for fiscal year ending in 06/2024.

Governmental community
Operated by a subsidized facility district.
Net patient revenue Info Net patient revenue — what the home actually collects for resident care, after contractual allowances, bad debt and discounts are subtracted from its gross charges (CMS cost report, Worksheet G-3). It covers resident care only; money the home earns from other sources is shown separately as "Other income."
$11.9M
Net patient income Info Net patient income: net patient revenue minus the home's total operating expenses. A positive figure means it earns more from resident care than it spends to deliver it; a negative figure means the opposite. It excludes non-operating "other income."
-$1.0M
Governmental community Operated by a subsidized facility district.
Net patient revenue Info Net patient revenue — what the home actually collects for resident care, after contractual allowances, bad debt and discounts are subtracted from its gross charges (CMS cost report, Worksheet G-3). It covers resident care only; money the home earns from other sources is shown separately as "Other income."
$11.9M Rank #42 / 89Revenue — State benchmarkedThis home is ranked 42nd out of 89 homes in Minnesota. Shows this facility's annual revenue compared to the Minnesota average. Higher revenue generally means more resources for staffing and capital — read alongside Payroll %.Rankings are based only on facilities in Minnesota that report data for that category. Facilities without available data are excluded from the ranking.Click the rank badge to see the full State ranking.Click here to see the full State ranking.
Net patient income Info Net patient income: net patient revenue minus the home's total operating expenses. A positive figure means it earns more from resident care than it spends to deliver it; a negative figure means the opposite. It excludes non-operating "other income."
-$1.0M
Other income Info Money the home earns outside of resident care — such as investments, grants, rentals and other non-operating sources (CMS cost report, Worksheet G-3). It is tracked separately from net patient revenue: it is not part of that figure, and it is not included in net patient income.
$424.6K
Payroll costs Info Staff salaries plus wage-related costs — benefits such as payroll taxes, health insurance and retirement — from the home's own accounting records (CMS cost report, Worksheet A). Contract or agency labor is counted separately, under other operating costs. Rank #41 / 89Payroll — State benchmarkedThis home is ranked 41st out of 89 homes in Minnesota. Shows total annual staff payroll benchmarked to the Minnesota average. Higher payroll investment relative to peers often signals better staffing and less reliance on cheaper contract labor.Rankings are based only on facilities in Minnesota that report data for that category. Facilities without available data are excluded from the ranking.Click the rank badge to see the full State ranking.Click here to see the full State ranking.
$5.8M 48.6% of net patient revenue Info Payroll as a share of revenue: staff salaries and wage-related benefits divided by net patient revenue. A higher figure means more of each revenue dollar goes to staff pay. Rank #54 / 89Payroll % — State benchmarkedThis home is ranked 54th out of 89 homes in Minnesota. Shows payroll as a percentage of revenue versus the Minnesota average. Well-run Minnesota facilities typically land around 61–68% — the top third Statewide. Below 25% may signal understaffing or heavy agency use — read with Staffing ratings.Rankings are based only on facilities in Minnesota that report data for that category. Facilities without available data are excluded from the ranking.Click the rank badge to see the full State ranking.Click here to see the full State ranking.
Other operating costs Info Everything it costs to run the home apart from payroll — food, utilities, supplies, maintenance, contract labor and administration. Calculated as total operating expense minus payroll (staff salaries and wage-related benefits).
$7.2M
Total costs Info The home's total operating expense for the year — all the costs of running it, salaries included (CMS cost report, Worksheet G-3).
$13.0M

Who this home usually serves

TYPE OF STAY

Mix of rehab and long-term care

This home supports both short-term rehab and long-term care, with residents staying for a wide range of durations.

Most new residents arrive under private pay (54% of admissions), and a typical private pay stay runs around 1 - 2 months.

Admissions
340 total

Coverage residents most often arrive under.

Medicare 17%
Private pay 54%
Medicaid 29%
Discharges
110 total

Coverage residents most often leave under.

Medicare 25%
Private pay 30%
Medicaid 45%

Places of interest near Cerenity Humboldt

Address 1.6 miles from city center Info Estimated distance in miles from St Paul's city center to Cerenity Humboldt's address, calculated via Google Maps.

Calculate Travel Distance to Cerenity Humboldt

Add your location

Address

Compare Nursing Homes around St Paul

The information below is reported by the Minnesota Department of Health, Health Regulation Division.

5 facilities compared · CMS & MN Dept. of Health data

Shirley Chapman Sholom Home East
NH
St Paul (West Seventh - Fort Road)
118
Facility 118
MN AVG 61
Rank #80 / 532
77.7%
Facility 77.7%
MN AVG 79.7%
Rank #176 / 331
-3%
5.55
Facility 5.55
MN AVG 4.77
Rank #12 / 89
+11%+16%
$0
Facility $0
MN AVG $47.9k
Rank #1 / 90
26
Facility 26
MN AVG 23.2
Rank #46 / 90
6.5
Facility 6.5
MN AVG 3.8
Rank #85 / 90
189-
73
Facility 73
MN AVG 43
Rank #90 / 632
Lisa Edstrom
$15.1M
Facility $15.1M
MN AVG $9.9M
Rank #18 / 89
$11.5M
Facility $11.5M
MN AVG $4.9M
Rank #12 / 89
76%
Facility 76%
MN AVG 50.7%
Rank #44 / 89
245411
St Anthony Park Home
NH
HC
PC
RC
St Paul (Saint Anthony Park)
84
Facility 84
MN AVG 61
Rank #167 / 532
88.4%
Facility 88.4%
MN AVG 79.7%
Rank #86 / 331
+11%
5.04
Facility 5.04
MN AVG 4.77
Rank #29 / 89
-12%+6%
$8.8k
Facility $8.8k
MN AVG $47.9k
Rank #52 / 90
41
Facility 41
MN AVG 23.2
Rank #73 / 90
10.3
Facility 10.3
MN AVG 3.8
Rank #89 / 90
167-
80
Facility 80
MN AVG 43
Rank #47 / 632
Alan Markowitz
$10.0M
Facility $10.0M
MN AVG $9.9M
Rank #39 / 89
$5.0M
Facility $5.0M
MN AVG $4.9M
Rank #40 / 89
50.3%
Facility 50.3%
MN AVG 50.7%
Rank #59 / 89
245063
Walker Methodist – Westwood Ridge
NH
AL
IL
MC
RC
West St Paul (West Saint Paul)
140
Facility 140
MN AVG 61
Rank #44 / 532
82.9%
Facility 82.9%
MN AVG 79.7%
Rank #133 / 331
+4%
6.74
Facility 6.74
MN AVG 4.77
Rank #4 / 89
-3%+41%
$15.6k
Facility $15.6k
MN AVG $47.9k
Rank #56 / 90
30
Facility 30
MN AVG 23.2
Rank #55 / 90
5.0
Facility 5.0
MN AVG 3.8
Rank #67 / 90
1116-
63
Facility 63
MN AVG 43
Rank #145 / 632
Walker Methodist
$9.0M
Facility $9.0M
MN AVG $9.9M
Rank #46 / 89
$6.5M
Facility $6.5M
MN AVG $4.9M
Rank #44 / 89
72%
Facility 72%
MN AVG 50.7%
Rank #44 / 89
245618
Cerenity Humboldt
NH
AL
HC
MC
RC
St Paul (Concord-Robert)
115
Facility 115
MN AVG 61
Rank #88 / 532
85.0%
Facility 85.0%
MN AVG 79.7%
Rank #106 / 331
+7%
4.21
Facility 4.21
MN AVG 4.77
Rank #59 / 89
+14%-12%
$96.7k
Facility $96.7k
MN AVG $47.9k
Rank #79 / 90
45
Facility 45
MN AVG 23.2
Rank #77 / 90
5.0
Facility 5.0
MN AVG 3.8
Rank #67 / 90
675-
73
Facility 73
MN AVG 43
Rank #90 / 632
Fairview Bethesda Hospital
$11.9M
Facility $11.9M
MN AVG $9.9M
Rank #42 / 89
$5.8M
Facility $5.8M
MN AVG $4.9M
Rank #41 / 89
48.6%
Facility 48.6%
MN AVG 50.7%
Rank #54 / 89
245255
Highland Chateau Health + Rehabilitation Clinic -
NH
HC
MC
RC
St Paul (Highland Park)
64
Facility 64
MN AVG 61
Rank #219 / 532
84.4%
Facility 84.4%
MN AVG 79.7%
Rank #120 / 331
+6%
4.15
Facility 4.15
MN AVG 4.77
Rank #59 / 89
---+74%-13%
$84.5k
Facility $84.5k
MN AVG $47.9k
Rank #77 / 90
113
Facility 113
MN AVG 23.2
Rank #89 / 90
7.1
Facility 7.1
MN AVG 3.8
Rank #87 / 90
654A+
59
Facility 59
MN AVG 43
Rank #185 / 632
Marcus Parence
$7.0M
Facility $7.0M
MN AVG $9.9M
Rank #56 / 89
$4.1M
Facility $4.1M
MN AVG $4.9M
Rank #62 / 89
58.4%
Facility 58.4%
MN AVG 50.7%
Rank #73 / 89
245028

Financial Assistance for
Nursing Home in Minnesota

Cerenity Humboldt is located in St Paul, Minnesota.
Here are the financial assistance programs available to residents in Minnesota.

Get Financial aid guidance

Elderly Waiver

Minnesota Medicaid EW

Age 65+
General Minnesota resident, Medicaid-eligible, nursing home-level care need.
Income Limits (2025) ~$2,829/month 300% FBR, individual
Asset Limits $3,000 individual, higher than most states
MN

Higher asset limit; rural access focus.

Benefits
Personal care (5-7 hours/day) Respite (240 hours/year) Adult day care (~$70/day) Home aides

Essential Community Supports (ECS)

Minnesota ECS

Age 65+
General Minnesota resident, at risk of decline but not nursing home level.
Income Limits ~$1,732/month individual, varies
Asset Limits $3,000 individual
MN

Bridges gap for those ineligible for waivers.

Benefits
In-home support (2-4 hours/week) Respite (up to 5 days/year) Transportation (~5 trips/month)

Alternative Care (AC) Program

Minnesota Alternative Care Program

Age 65+
General Minnesota resident, NFLOC, not MA-eligible.
Income Limits (2025) ~$1,255-$2,829/month (100%-300% FPL); sliding scale copays.
Asset Limits $3,000 (individual); home equity limit $713,000.
MN

CDCS option; statewide via counties.

Benefits
Personal care (4-6 hours/day) Respite (~5 days/year) Home health Meals Home mods

Minnesota Senior Health Options (MSHO)

Minnesota Senior Health Options

Age 65+
General Minnesota resident, eligible for MA and Medicare Parts A/B.
Income Limits (2025) ~$1,255/month (100% FPL for MA); spenddown allowed.
Asset Limits $3,000 (individual), $6,000 (couple).
MN

7 health plans (e.g., UCare, HealthPartners); care coordinator assigned.

Benefits
Personal care (5-7 hours/day) Medical care Respite Adult day care Home mods $900/year groceries (some plans)

Minnesota Senior Care Plus (MSC+)

Minnesota Senior Care Plus

Age 65+
General Minnesota resident, MA-eligible, not on Medicare.
Income Limits (2025) ~$1,255/month (100% FPL); spenddown allowed.
Asset Limits $3,000 (individual), $6,000 (couple).
MN

Includes EW services; 7 health plans available.

Benefits
Personal care (5-7 hours/day) Respite Adult day care Home mods Limited nursing home care

Consumer Support Grant (CSG)

Minnesota Consumer Support Grant

Age 65+ or disabled
General Minnesota resident, eligible for MA personal care but opts for grant.
Income Limits (2025) ~$1,255/month (MA-eligible); spenddown allowed.
Asset Limits $3,000 individual
MN

Can hire family; statewide via counties.

Benefits
Cash (~$500-$1,500/month) for personal care Respite Home mods Assistive tech

Medicare Savings Program (MSP)

Minnesota Medicare Savings Program

Age 65+ or disabled
General Minnesota resident, Medicare Part A/B.
Income Limits (2025) ~$2,510/month (QMB), ~$3,380/month (SLMB), ~$3,598/month (QI)—individual.
Asset Limits $9,430 (individual), $14,130 (couple).
MN

Three tiers; no waitlist; includes Extra Help for Part D.

Benefits
Covers Part B premiums ($174.70/month) Deductibles ($240/year) Copays (~20%)

VA Aid and Attendance (A&A) and Housebound Benefits

Minnesota VA Aid and Attendance/Housebound

Age 65+ or disabled veteran/spouse
General Minnesota resident, wartime service, need for ADL help (A&A) or homebound.
Income Limits (2025) Net income < ~$1,984/month (veteran with dependent, A&A); pension offsets income.
Asset Limits ~$155,356 net worth limit
MN

High veteran demand in rural/urban areas.

Benefits
Cash (~$1,433-$2,642/month veteran, ~$951-$1,318 spouse) for care costs (e.g., in-home, assisted living)

Frequently Asked Questions about Cerenity Humboldt

What neighborhood is Cerenity Humboldt in?

Cerenity Humboldt is in the Concord-Robert neighborhood of St Paul.

Is Cerenity Humboldt in a walkable area?

Cerenity Humboldt has a walk score of 73. Very walkable. Most errands can be accomplished on foot, and many essentials are within a short walk.

What is the occupancy rate at Cerenity Humboldt?

Cerenity Humboldt's occupancy is 85%.

How many beds does Cerenity Humboldt have?

Cerenity Humboldt has 115 beds.

Are there photos of Cerenity Humboldt?

Yes — there are 77 photos of Cerenity Humboldt in the photo gallery on this page.

What is the address of Cerenity Humboldt?

Cerenity Humboldt is located at 512 Humboldt Ave, St Paul, MN 55107.

What is the phone number of Cerenity Humboldt?

(651) 222-2273 will put you in contact with the team at Cerenity Humboldt.

Guides for Better Senior Living

Care Cost Calculator: See Prices in Your Area

Nursing Home Data Explorer

Don’t Wait Too Long: 7 Red Flag Signs Your Parent Needs Assisted Living Now

The True Cost of Assisted Living in 2025 – And How Families Are Paying For It

Understanding Senior Living Costs: Pricing Models, Discounts & Financial Assistance