St Anthony Park Home
Nursing Home, Hospice Care, Palliative Care & Respite Care · St. Paul, MN
CMS overall rating Info CMS (the Centers for Medicare & Medicaid Services) is the federal agency that rates nursing home quality. Its Overall Rating runs from 1 to 5 stars, combining health inspections, staffing, and quality measures, with inspections weighted most heavily.

St Anthony Park Home

Nursing Home, Hospice Care, Palliative Care & Respite Care · St. Paul, MN
CMS overall rating Info CMS (the Centers for Medicare & Medicaid Services) is the federal agency that rates nursing home quality. Its Overall Rating runs from 1 to 5 stars, combining health inspections, staffing, and quality measures, with inspections weighted most heavily.
Calculator: See prices in your area
St Anthony Park Home accepts Medicare, Medicaid, and private pay.

Overview of St Anthony Park Home

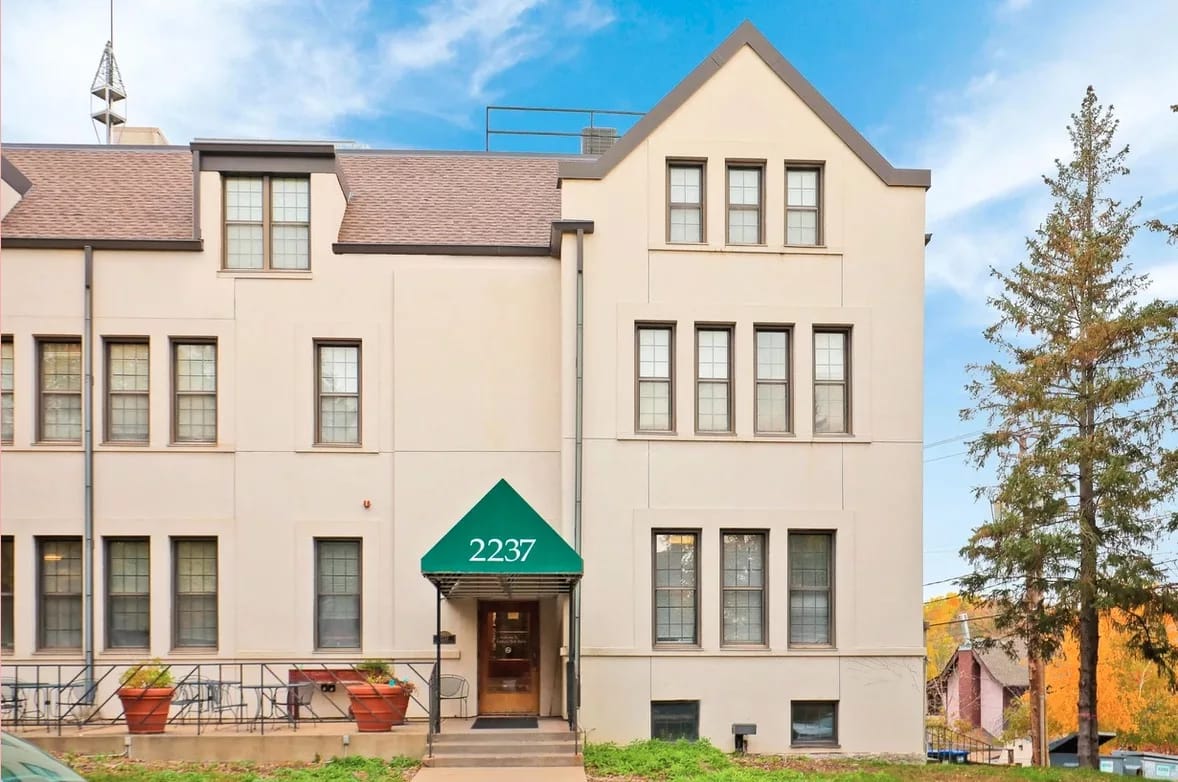
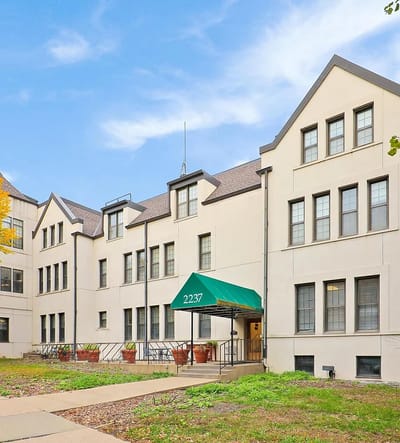
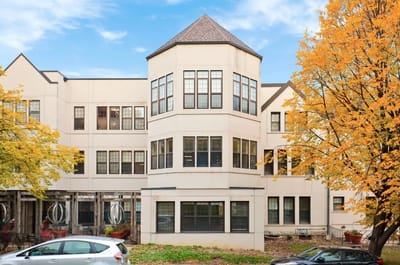
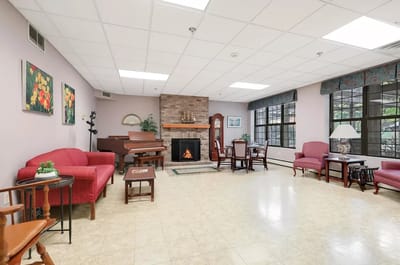
St Anthony Park Home, located in St Paul, MN, is an 83-bed skilled nursing facility. This community provides exemplary short-term, long-term, and memory care services. Their patient-centered care is well coordinated with the residents and their professional team of registered and licensed nurses, CNAs, therapists, social workers, activities team members, and dietitians. As part of their care services, each resident is provided 24/7 skilled nursing care and assistance with daily living activities as needed.
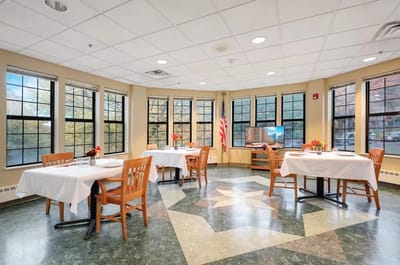
Additionally, residents are provided meals regularly, which are carefully prepared to meet their dietary needs. Housekeeping and laundry services ensure the cleanliness of the facility, an added safety measure to protect residents from infections or diseases, as well as accidents. Daily activities such as art, music, and social gatherings are also scheduled to provide entertainment as well as opportunities to stay physically active, engaged, and mentally stimulated.

St Anthony Park Home is a VA-certified facility.

(651) 646-7486

Quality ratings

Measured by Centers for Medicare & Medicaid Services (CMS)

Overall rating Info The Overall CMS Rating combines results from health inspections, staffing levels and quality measures. Health inspections carry the most weight. Staffing and quality scores can increase or decrease the final rating based on performance compared to state and national standards.
▼ 37.1% Below MN avg. ▼ 37.1% Below MN avg.MN average: 3.2Click the badge to see the full State ranking.Click here to see the full State ranking.
Health Inspection Info Based on the results of the facility's three most recent standard inspections and any complaint investigations. CMS reviews the number, scope, and severity of deficiencies, with more recent findings weighted more heavily.
▼ 64.4% Below MN avg. ▼ 64.4% Below MN avg.MN average: 2.8Click the badge to see the full State ranking.Click here to see the full State ranking.
Staffing Info Measures average nursing staff hours per resident per day, including Registered Nurses (RNs) and total nursing staff. Ratings are adjusted based on the level of care residents require and are compared to state and national benchmarks.
▲ 22.1% Above MN avg. ▲ 22.1% Above MN avg.MN average: 4.1Click the badge to see the full State ranking.Click here to see the full State ranking.
Quality Measures Info Based on clinical and physical health indicators reported to CMS, such as hospital readmissions, falls, pressure ulcers, and improvements in mobility. These measures reflect how well residents' health needs are being managed.
▲ 27.9% Above MN avg. ▲ 27.9% Above MN avg.MN average: 3.1Click the badge to see the full State ranking.Click here to see the full State ranking.

Staffing hours breakdown

Info Daily nursing hours per resident by staff type, reported to CMS. Higher is generally better — compare this facility to state and national averages to see where staffing stands.

Hours per resident per day — compared to Minnesota state averages

Total nursing care / resident Info This home is ranked 29th out of 89 homes in Minnesota for nurse hours. Total adjusted nursing hours per resident per day, combining RN, LPN, and aide time. CMS adjusts this for case-mix so facilities can be fairly compared.
5h 2m per day
Rank #29 / 89Nurse hours — State benchmarkedThis home is ranked 29th out of 89 homes in Minnesota. Shows adjusted nurse hours per resident per day benchmarked to the Minnesota average, with a ranking across 89 Minnesota facilities. More hours mean more direct care. The national average is about 3.5 hrs; below 3.0 is a red flag.Ranking totals vary by category as each rank only includes facilities that report data for that metric. Homes missing that data point aren't included in the ranking.Click the rank badge to see the full State ranking.Click here to see the full State ranking.
This facility Minnesota avg (4h 46m per day)
vs Minnesota avg
+6%

1 of 6 metrics below state avg

Standout metric Weekend RN is +28% above state avg
Staff typeHours / Day / Residentvs state avg
Registered Nurse (RN) Info RNs hold the highest nursing license and can assess residents, interpret test results, and direct care plans. More RN hours per day often signals stronger clinical oversight and faster response to health changes. 1h 6m per day ■ Avg State avg: 1h 4m per day · National avg: 41m per day
LPN / LVN Info Licensed Practical Nurses (LPNs) or Licensed Vocational Nurses (LVNs) deliver routine hands-on care — medication administration, wound dressing, and monitoring vital signs. They work under RN supervision and make up a large share of daily bedside care. 45m per day ▲ 21% State avg: 37m per day · National avg: 52m per day
Nurse Aide Info Certified Nurse Aides (CNAs) provide the most direct day-to-day assistance: bathing, dressing, feeding, and mobility. Nurse aide hours are typically the largest staffing category and directly affect residents' quality of life. 2h 57m per day ▲ 16% State avg: 2h 33m per day · National avg: 2h 21m per day
Weekend Total Nursing Info Combined nursing hours (RN + LPN + Nurse Aide) per resident per day on weekends. Staffing often drops on weekends — this figure reveals whether the facility maintains adequate coverage outside of weekday hours. 4h 28m per day ▲ 21% State avg: 3h 41m per day · National avg: 3h 26m per day
Physical Therapist Info Hours per resident per day provided by licensed Physical Therapists (PTs) or PT Assistants. PT services help residents recover mobility after injury or illness and are especially important for post-acute (short-stay) rehabilitation. 2m per day ▼ 42% State avg: 4m per day · National avg: 4m per day
Weekend RN Info Registered nurse hours specifically on weekends. Facilities sometimes reduce RN presence on Saturdays and Sundays — a low weekend RN figure compared to weekday hours can indicate reduced clinical oversight when most administrative staff are absent. 53m per day ▲ 28% State avg: 41m per day · National avg: 29m per day

Capacity and availability

This home usually has limited availability

Higher occupancy than the Minnesota average: 79.7%
Occupancy rate
88.4% Rank #86 / 331Occupancy rate — State benchmarkedThis home is ranked 86th out of 331 homes in Minnesota. Shows this facility's occupancy rate versus the Minnesota average, with its Statewide rank out of 331. Higher occupancy signals strong local demand and financial stability.Ranking totals vary by category as each rank only includes facilities that report data for that metric. Homes missing that data point aren't included in the ranking.Click the rank badge to see the full State ranking.Click here to see the full State ranking.
Avg. Length of Stay
165 days
Bed community size
84-bed community Rank #167 / 532Bed count — State benchmarkedThis home is ranked 167th out of 532 homes in Minnesota. Shows this facility's certified or reported bed count compared to other Minnesota facilities. Larger communities may offer more amenities, programs, and on-site services for residents and families.Ranking totals vary by category as each rank only includes facilities that report data for that metric. Homes missing that data point aren't included in the ranking.Click the rank badge to see the full State ranking.Click here to see the full State ranking.
A larger shared setting that may offer more common spaces and organized community services.
Walk Score
Walk Score: 80 / 100 Rank #47 / 632Walk Score — State benchmarkedThis home is ranked 47th out of 632 homes in Minnesota. Shows how walkable this facility's neighborhood is compared to the average Walk Score across Minnesota facilities. Higher scores benefit residents, families, and staff.Ranking totals vary by category as each rank only includes facilities that report data for that metric. Homes missing that data point aren't included in the ranking.Click the rank badge to see the full State ranking.Click here to see the full State ranking.
Very walkable. Most errands can be accomplished on foot, and many essentials are within a short walk.

About this community

Therapy & Rehabilitation

3 services
Rehabilitation Services
Respite Care
Short-Term Rehab

Staffing & Medical

1 service
24-Hour Staffing

Additional Services

1 service
Hospice & Palliative Support

Amenities & Lifestyle

ActivitiesDaily Activities & Recreation
Specific ProgramsRespiratory Therapy Services, Daily Activities & Recreation, Therapy Gym & Treatment Areas

Contact St Anthony Park Home

Staffing Data

Reporting period: October 1 – December 31, 2025 (Q4 2025). Source: CMS Payroll-Based Journal report.

Total staff 136
Employees 97
Contractors 39
Staff to resident ratio 1.89 : 1
14% fewer staff per resident than Minnesota average
Minnesota average ratio: 2.19 : 1 Minnesota average ratio: 2.19 : 1See full Minnesota ranking
Avg staff/day 43
Average shift 8.2 hours
9% better than Minnesota average
Minnesota average: 7.5 hours Minnesota average shift: 7.5 hoursSee full Minnesota ranking
Total staff hours (quarter) 32,624

Nursing staff breakdown

Q4 2025 · Oct 1 – Dec 31 More info This data comes from the CMS Payroll-Based Journal report covering October 1 – December 31, 2025.
Registered Nurse

Manages medical care and health needs.

RN Staff Info 17 total: 11 full-time employees and 6 contractors. 17
Average shift length Info Average shift length. Calculated as total hours divided by days worked and average staff per day. 8.7 hours
Licensed Practical Nurse

Assists with medical care and medications.

LPN Staff Info 17 total: 11 full-time employees and 6 contractors. 17
Average shift length Info Average shift length. Calculated as total hours divided by days worked and average staff per day. 8.9 hours
Certified Nursing Assistant

Helps with daily care and mobility.

CNA Staff Info 83 total: 56 full-time employees and 27 contractors. 83
Average shift length Info Average shift length. Calculated as total hours divided by days worked and average staff per day. 8.4 hours

Contractor staffing

Q4 2025 · Oct 1 – Dec 31 More info This data comes from the CMS Payroll-Based Journal report covering October 1 – December 31, 2025.

Total hours from contractors

11.8%

3,863 contractor hours this quarter

Certified Nursing Assistant: 27 Licensed Practical Nurse: 6 Registered Nurse: 6

Staff by category

Q4 2025 · Oct 1 – Dec 31 More info This data comes from the CMS Payroll-Based Journal report covering October 1 – December 31, 2025.
Certified Nursing Assistant56278318,2208896%8.4
Registered Nurse116175,19892100%8.7
Licensed Practical Nurse116174,6239199%8.9
Nurse Practitioner2028885661%8
Other Dietary Services Staff4048406672%7.1
Administrator2028165661%8
Clinical Nurse Specialist2026625661%8.1
Dietitian1014485661%8
Physical Therapy Assistant2022874549%5
Respiratory Therapy Technician2022385054%4.7
Qualified Social Worker1011893134%6.1
Speech Language Pathologist1011282628%4.9
Mental Health Service Worker202871213%7.2
83 Certified Nursing Assistant
% of Days 96%
17 Registered Nurse
% of Days 100%
17 Licensed Practical Nurse
% of Days 99%
2 Nurse Practitioner
% of Days 61%
4 Other Dietary Services Staff
% of Days 72%
2 Administrator
% of Days 61%
2 Clinical Nurse Specialist
% of Days 61%
1 Dietitian
% of Days 61%
2 Physical Therapy Assistant
% of Days 49%
2 Respiratory Therapy Technician
% of Days 54%
1 Qualified Social Worker
% of Days 34%
1 Speech Language Pathologist
% of Days 28%
2 Mental Health Service Worker
% of Days 13%

Penalties and fines

Includes penalties issued in 2024

Federal penalties imposed by CMS for regulatory violations, including civil money penalties (fines) and denials of payment for new Medicare/Medicaid admissions.

Source: CMS Penalties Database (Data as of Jan 2026)

Total fines amount $14K Rank #52 / 90Federal fines — State benchmarkedThis home is ranked 52nd out of 90 homes in Minnesota. Shows this facility's cumulative CMS federal fine dollars versus the Minnesota average among facilities with fines, and where it ranks among 90 facilities in the pool. Lower total dollars mean a better rank.Ranking totals vary by category as each rank only includes facilities that report data for that metric. Homes missing that data point aren't included in the ranking.Click the rank badge to see the full State ranking.Click here to see the full State ranking.
69% lower than Minnesota average

Minnesota average: $44K

Number of fines 1
50% fewer fines than Minnesota average

Minnesota average: 2.0

Payment Denials Info Serious action where Medicare and/or Medicaid temporarily stops payments for new residents until issues are fixed. 0
100% fewer payment denials than Minnesota average

Minnesota average: 0.4

Fines amount comparison
This facility $14K
Minnesota average $44K
Penalty History

Penalties are imposed by CMS for violations of federal nursing home regulations.

1 penalty in the past 3 years

Oct 8, 2024 · $14K

Civil Money Penalty Info Fines imposed for noncompliance, which can be assessed per day or per instance of violation. Oct 8, 2024
$14K

Last updated: Jan 2026

Quality of care over time

These measures show how residents usually do over time at this home, based on health outcomes and preventive care.

High-risk clinical events score Info A composite score based on pressure ulcers, falls with injury, weight loss, walking ability decline, and activities of daily living decline. 9.4
15% better than Minnesota average

Minnesota average: 11.1

Functional decline score Info A composite score based on activities of daily living decline, walking ability decline, and incontinence. 23.0
In line with Minnesota average

Minnesota average: 22.6

Long-stay resident measures
Average Minnesota avg: 2.6 Info CMS star rating based on long-stay quality measure performance. 5 stars = significantly above average, 1 star = significantly below average.
Need for Help with Daily Activities Increased Info Percent of long-stay residents whose need for help with daily activities has increased 17.0%
10% better than Minnesota average

Minnesota average: 18.9%

Walking Ability Worsened Info Percent of long-stay residents whose ability to move independently worsened 17.3%
27% better than Minnesota average

Minnesota average: 23.8%

Low Risk Residents with Bowel/Bladder Incontinence Info Percent of low risk long-stay residents who lose control of their bowels or bladder 34.8%
39% worse than Minnesota average

Minnesota average: 25.0%

Falls with Major Injury Info Percent of long-stay residents experiencing one or more falls with major injury 6.7%
79% worse than Minnesota average

Minnesota average: 3.7%

High Risk Residents with Pressure Ulcers Info Percent of long-stay high risk residents with pressure ulcers 3.2%
41% better than Minnesota average

Minnesota average: 5.4%

Urinary Tract Infection Info Percent of long-stay residents with a urinary tract infection 1.5%
45% better than Minnesota average

Minnesota average: 2.7%

Lost Too Much Weight Info Percent of long-stay residents who lose too much weight 2.9%
29% better than Minnesota average

Minnesota average: 4.1%

Depressive Symptoms Info Percent of long-stay residents who have depressive symptoms 8.4%
94% worse than Minnesota average

Minnesota average: 4.4%

Antipsychotic Use Info Percent of long-stay residents who received an antipsychotic medication 21.7%
26% worse than Minnesota average

Minnesota average: 17.2%

Pneumococcal Vaccine Info Percent of long-stay residents assessed and appropriately given the pneumococcal vaccine 99.3%
In line with Minnesota average

Minnesota average: 97.3%

Influenza Vaccine Info Percent of long-stay residents assessed and appropriately given the seasonal influenza vaccine 100.0%
In line with Minnesota average

Minnesota average: 96.0%

Short-stay resident measures
Below average Minnesota avg: 3.1 Info CMS star rating based on short-stay quality measure performance. 5 stars = much above average, 1 star = much below average.
Pneumococcal Vaccine Info Percent of short-stay residents assessed and appropriately given the pneumococcal vaccine 78.0%
12% worse than Minnesota average

Minnesota average: 88.9%

Antipsychotic medication increase Info Percent of short-stay residents who newly received an antipsychotic medication 2.2%
13% worse than Minnesota average

Minnesota average: 1.9%

Influenza Vaccine Info Percent of short-stay residents assessed and appropriately given the seasonal influenza vaccine 91.3%
11% better than Minnesota average

Minnesota average: 82.6%

Re-hospitalized after SNF stay Info Percentage of short-stay residents who were re-hospitalized after their nursing home admission. 28.4%
23% worse than Minnesota average

Minnesota average: 23.1%

Emergency department visits Info Percentage of short-stay residents who had an outpatient emergency department visit. 0.0%
100% better than Minnesota average

Minnesota average: 14.0%

Falls with major injury Info Percentage of SNF residents who experience falls with major injury during their stay. 0.0%
100% better than Minnesota average

Minnesota average: 0.8%

Successful return to home or community Info Rate of successful return to home or community from a skilled nursing facility. 50.3%
In line with Minnesota average

Minnesota average: 50.6%

Breakdown by payment type

Medicare

18% of new residents, usually for short-term rehab.

Typical stay 22 days

Private pay

56% of new residents, often for short stays.

Typical stay 5 - 6 months

Medicaid

25% of new residents, often for long-term daily care.

Typical stay 8 - 9 months

Facility Characteristics

Source: CMS Long-Term Care Facility Characteristics (Data as of Jan 2026)

Total residents 72
Medicare
4
5.6% of residents
Medicaid
20
27.8% of residents
Private pay or other
48
66.7% of residents
Programs & Services
Residents Group

Residents meet regularly to discuss policies, care quality, and activities

Active Resident Council

Organized group of residents that meets regularly to discuss facility policies, quality of life, and activities.

Finances and operations

Based on CMS SNF Cost Report for fiscal year ending in 09/2023.

Voluntary non-profit community
Operated by a church.
Net patient revenue Info Net patient revenue — what the home actually collects for resident care, after contractual allowances, bad debt and discounts are subtracted from its gross charges (CMS cost report, Worksheet G-3). It covers resident care only; money the home earns from other sources is shown separately as "Other income."
$10.0M
Net patient income Info Net patient income: net patient revenue minus the home's total operating expenses. A positive figure means it earns more from resident care than it spends to deliver it; a negative figure means the opposite. It excludes non-operating "other income."
-$766.9K
Voluntary non-profit community Operated by a church.
Net patient revenue Info Net patient revenue — what the home actually collects for resident care, after contractual allowances, bad debt and discounts are subtracted from its gross charges (CMS cost report, Worksheet G-3). It covers resident care only; money the home earns from other sources is shown separately as "Other income."
$10.0M Rank #39 / 89Revenue — State benchmarkedThis home is ranked 39th out of 89 homes in Minnesota. Shows this facility's annual revenue compared to the Minnesota average. Higher revenue generally means more resources for staffing and capital — read alongside Payroll %.Ranking totals vary by category as each rank only includes facilities that report data for that metric. Homes missing that data point aren't included in the ranking.Click the rank badge to see the full State ranking.Click here to see the full State ranking.
Net patient income Info Net patient income: net patient revenue minus the home's total operating expenses. A positive figure means it earns more from resident care than it spends to deliver it; a negative figure means the opposite. It excludes non-operating "other income."
-$766.9K
Other income Info Money the home earns outside of resident care — such as investments, grants, rentals and other non-operating sources (CMS cost report, Worksheet G-3). It is tracked separately from net patient revenue: it is not part of that figure, and it is not included in net patient income.
$1.6M
Payroll costs Info Staff salaries plus wage-related costs — benefits such as payroll taxes, health insurance and retirement — from the home's own accounting records (CMS cost report, Worksheet A). Contract or agency labor is counted separately, under other operating costs. Rank #40 / 89Payroll — State benchmarkedThis home is ranked 40th out of 89 homes in Minnesota. Shows total annual staff payroll benchmarked to the Minnesota average. Higher payroll investment relative to peers often signals better staffing and less reliance on cheaper contract labor.Ranking totals vary by category as each rank only includes facilities that report data for that metric. Homes missing that data point aren't included in the ranking.Click the rank badge to see the full State ranking.Click here to see the full State ranking.
$5.0M 50.3% of net patient revenue Info Payroll as a share of revenue: staff salaries and wage-related benefits divided by net patient revenue. A higher figure means more of each revenue dollar goes to staff pay. Rank #59 / 89Payroll % — State benchmarkedThis home is ranked 59th out of 89 homes in Minnesota. Shows payroll as a percentage of revenue versus the Minnesota average. Well-run Minnesota facilities typically land around 61–68% — the top third Statewide. Below 25% may signal understaffing or heavy agency use — read with Staffing ratings.Ranking totals vary by category as each rank only includes facilities that report data for that metric. Homes missing that data point aren't included in the ranking.Click the rank badge to see the full State ranking.Click here to see the full State ranking.
Other operating costs Info Everything it costs to run the home apart from payroll — food, utilities, supplies, maintenance, contract labor and administration. Calculated as total operating expense minus payroll (staff salaries and wage-related benefits).
$5.7M
Total costs Info The home's total operating expense for the year — all the costs of running it, salaries included (CMS cost report, Worksheet G-3).
$10.8M

Who this home usually serves

TYPE OF STAY

Mix of rehab and long-term care

This home supports both short-term rehab and long-term care, with residents staying for a wide range of durations.

Most new residents arrive under private pay (56% of admissions), and a typical private pay stay runs around 5 - 6 months.

Admissions
169 total

Coverage residents most often arrive under.

Medicare 18%
Private pay 56%
Medicaid 25%
Discharges
164 total

Coverage residents most often leave under.

Medicare 12%
Private pay 63%
Medicaid 24%

Places of interest near St Anthony Park Home

Address 5.5 miles from city center Info Estimated distance in miles from St Paul's city center to St Anthony Park Home's address, calculated via Google Maps. — 1 miles to nearest hospital (Minnesota scope)

Calculate Travel Distance to St Anthony Park Home

Add your location

Address

Compare Nursing Home around St Paul

The information below is reported by the Minnesota Department of Health, Health Regulation Division.

5 facilities compared · CMS & MN Dept. of Health data

Shirley Chapman Sholom Home East
NH
St Paul (West Seventh - Fort Road)
118
Facility 118
MN AVG 61
Rank #80 / 532
77.7%
Facility 77.7%
MN AVG 79.7%
Rank #176 / 331
-3%
5.55
Facility 5.55
MN AVG 4.77
Rank #12 / 89
+11%+16%
$0
Facility $0
MN AVG $47.9k
Rank #1 / 90
26
Facility 26
MN AVG 23.2
Rank #46 / 90
6.5
Facility 6.5
MN AVG 3.8
Rank #85 / 90
189-
73
Facility 73
MN AVG 43
Rank #90 / 632
Lisa Edstrom
$15.1M
Facility $15.1M
MN AVG $9.9M
Rank #18 / 89
$11.5M
Facility $11.5M
MN AVG $4.9M
Rank #12 / 89
76%
Facility 76%
MN AVG 50.7%
Rank #44 / 89
245411
St Anthony Park Home
NH
HC
PC
RC
St Paul (Saint Anthony Park)
84
Facility 84
MN AVG 61
Rank #167 / 532
88.4%
Facility 88.4%
MN AVG 79.7%
Rank #86 / 331
+11%
5.04
Facility 5.04
MN AVG 4.77
Rank #29 / 89
-12%+6%
$8.8k
Facility $8.8k
MN AVG $47.9k
Rank #52 / 90
41
Facility 41
MN AVG 23.2
Rank #73 / 90
10.3
Facility 10.3
MN AVG 3.8
Rank #89 / 90
167-
80
Facility 80
MN AVG 43
Rank #47 / 632
Alan Markowitz
$10.0M
Facility $10.0M
MN AVG $9.9M
Rank #39 / 89
$5.0M
Facility $5.0M
MN AVG $4.9M
Rank #40 / 89
50.3%
Facility 50.3%
MN AVG 50.7%
Rank #59 / 89
245063
Walker Methodist – Westwood Ridge
NH
AL
IL
MC
RC
West St Paul (West Saint Paul)
140
Facility 140
MN AVG 61
Rank #44 / 532
82.9%
Facility 82.9%
MN AVG 79.7%
Rank #133 / 331
+4%
6.74
Facility 6.74
MN AVG 4.77
Rank #4 / 89
-3%+41%
$15.6k
Facility $15.6k
MN AVG $47.9k
Rank #56 / 90
30
Facility 30
MN AVG 23.2
Rank #55 / 90
5.0
Facility 5.0
MN AVG 3.8
Rank #67 / 90
1116-
63
Facility 63
MN AVG 43
Rank #145 / 632
Walker Methodist
$9.0M
Facility $9.0M
MN AVG $9.9M
Rank #46 / 89
$6.5M
Facility $6.5M
MN AVG $4.9M
Rank #44 / 89
72%
Facility 72%
MN AVG 50.7%
Rank #44 / 89
245618
Cerenity Humboldt
NH
AL
HC
MC
RC
St Paul (Concord-Robert)
115
Facility 115
MN AVG 61
Rank #88 / 532
85.0%
Facility 85.0%
MN AVG 79.7%
Rank #106 / 331
+7%
4.21
Facility 4.21
MN AVG 4.77
Rank #59 / 89
+14%-12%
$96.7k
Facility $96.7k
MN AVG $47.9k
Rank #79 / 90
45
Facility 45
MN AVG 23.2
Rank #77 / 90
5.0
Facility 5.0
MN AVG 3.8
Rank #67 / 90
675-
73
Facility 73
MN AVG 43
Rank #90 / 632
Fairview Bethesda Hospital
$11.9M
Facility $11.9M
MN AVG $9.9M
Rank #42 / 89
$5.8M
Facility $5.8M
MN AVG $4.9M
Rank #41 / 89
48.6%
Facility 48.6%
MN AVG 50.7%
Rank #54 / 89
245255
Highland Chateau Health + Rehabilitation Clinic -
NH
HC
MC
RC
St Paul (Highland Park)
64
Facility 64
MN AVG 61
Rank #219 / 532
84.4%
Facility 84.4%
MN AVG 79.7%
Rank #120 / 331
+6%
4.15
Facility 4.15
MN AVG 4.77
Rank #59 / 89
---+74%-13%
$84.5k
Facility $84.5k
MN AVG $47.9k
Rank #77 / 90
113
Facility 113
MN AVG 23.2
Rank #89 / 90
7.1
Facility 7.1
MN AVG 3.8
Rank #87 / 90
654A+
59
Facility 59
MN AVG 43
Rank #185 / 632
Marcus Parence
$7.0M
Facility $7.0M
MN AVG $9.9M
Rank #56 / 89
$4.1M
Facility $4.1M
MN AVG $4.9M
Rank #62 / 89
58.4%
Facility 58.4%
MN AVG 50.7%
Rank #73 / 89
245028

Financial Assistance for
Nursing Home in Minnesota

St Anthony Park Home is located in St Paul, Minnesota.
Here are the financial assistance programs available to residents in Minnesota.

Get Financial aid guidance

Elderly Waiver

Minnesota Medicaid EW

Age 65+
General Minnesota resident, Medicaid-eligible, nursing home-level care need.
Income Limits (2025) ~$2,829/month 300% FBR, individual
Asset Limits $3,000 individual, higher than most states
MN

Higher asset limit; rural access focus.

Benefits
Personal care (5-7 hours/day) Respite (240 hours/year) Adult day care (~$70/day) Home aides

Essential Community Supports (ECS)

Minnesota ECS

Age 65+
General Minnesota resident, at risk of decline but not nursing home level.
Income Limits ~$1,732/month individual, varies
Asset Limits $3,000 individual
MN

Bridges gap for those ineligible for waivers.

Benefits
In-home support (2-4 hours/week) Respite (up to 5 days/year) Transportation (~5 trips/month)

Alternative Care (AC) Program

Minnesota Alternative Care Program

Age 65+
General Minnesota resident, NFLOC, not MA-eligible.
Income Limits (2025) ~$1,255-$2,829/month (100%-300% FPL); sliding scale copays.
Asset Limits $3,000 (individual); home equity limit $713,000.
MN

CDCS option; statewide via counties.

Benefits
Personal care (4-6 hours/day) Respite (~5 days/year) Home health Meals Home mods

Minnesota Senior Health Options (MSHO)

Minnesota Senior Health Options

Age 65+
General Minnesota resident, eligible for MA and Medicare Parts A/B.
Income Limits (2025) ~$1,255/month (100% FPL for MA); spenddown allowed.
Asset Limits $3,000 (individual), $6,000 (couple).
MN

7 health plans (e.g., UCare, HealthPartners); care coordinator assigned.

Benefits
Personal care (5-7 hours/day) Medical care Respite Adult day care Home mods $900/year groceries (some plans)

Minnesota Senior Care Plus (MSC+)

Minnesota Senior Care Plus

Age 65+
General Minnesota resident, MA-eligible, not on Medicare.
Income Limits (2025) ~$1,255/month (100% FPL); spenddown allowed.
Asset Limits $3,000 (individual), $6,000 (couple).
MN

Includes EW services; 7 health plans available.

Benefits
Personal care (5-7 hours/day) Respite Adult day care Home mods Limited nursing home care

Consumer Support Grant (CSG)

Minnesota Consumer Support Grant

Age 65+ or disabled
General Minnesota resident, eligible for MA personal care but opts for grant.
Income Limits (2025) ~$1,255/month (MA-eligible); spenddown allowed.
Asset Limits $3,000 individual
MN

Can hire family; statewide via counties.

Benefits
Cash (~$500-$1,500/month) for personal care Respite Home mods Assistive tech

Medicare Savings Program (MSP)

Minnesota Medicare Savings Program

Age 65+ or disabled
General Minnesota resident, Medicare Part A/B.
Income Limits (2025) ~$2,510/month (QMB), ~$3,380/month (SLMB), ~$3,598/month (QI)—individual.
Asset Limits $9,430 (individual), $14,130 (couple).
MN

Three tiers; no waitlist; includes Extra Help for Part D.

Benefits
Covers Part B premiums ($174.70/month) Deductibles ($240/year) Copays (~20%)

VA Aid and Attendance (A&A) and Housebound Benefits

Minnesota VA Aid and Attendance/Housebound

Age 65+ or disabled veteran/spouse
General Minnesota resident, wartime service, need for ADL help (A&A) or homebound.
Income Limits (2025) Net income < ~$1,984/month (veteran with dependent, A&A); pension offsets income.
Asset Limits ~$155,356 net worth limit
MN

High veteran demand in rural/urban areas.

Benefits
Cash (~$1,433-$2,642/month veteran, ~$951-$1,318 spouse) for care costs (e.g., in-home, assisted living)

Frequently Asked Questions about St Anthony Park Home

What neighborhood is St Anthony Park Home in?

St Anthony Park Home is in the Saint Anthony Park neighborhood.

Is St Anthony Park Home in a walkable area?

St Anthony Park Home has a walk score of 80. Very walkable. Most errands can be accomplished on foot, and many essentials are within a short walk.

What is the occupancy rate at St Anthony Park Home?

St Anthony Park Home's occupancy is 88.4%.

Are there photos of St Anthony Park Home?

Yes — there are 9 photos of St Anthony Park Home in the photo gallery on this page.

What is the phone number of St Anthony Park Home?

(651) 646-7486 will put you in contact with the team at St Anthony Park Home.

Is St Anthony Park Home Medicare or Medicaid certified?

Yes — St Anthony Park Home is a CMS-certified provider of Medicare and Medicaid.

Guides for Better Senior Living

Care Cost Calculator: See Prices in Your Area

Nursing Home Data Explorer

Don’t Wait Too Long: 7 Red Flag Signs Your Parent Needs Assisted Living Now

The True Cost of Assisted Living in 2025 – And How Families Are Paying For It

Understanding Senior Living Costs: Pricing Models, Discounts & Financial Assistance