Chaffee Nursing Center
Nursing Home, Skilled Nursing & Hospice Care · Cape Girardeau, MO
CMS overall rating Info The Overall CMS Rating is scored from 1 to 5 stars and combines results from health inspections, staffing levels, and quality measures. Health inspections carry the most weight. Staffing and quality scores can increase or decrease the final rating based on performance compared to state and national standards.

Chaffee Nursing Center

Nursing Home, Skilled Nursing & Hospice Care · Cape Girardeau, MO
CMS overall rating Info The Overall CMS Rating is scored from 1 to 5 stars and combines results from health inspections, staffing levels, and quality measures. Health inspections carry the most weight. Staffing and quality scores can increase or decrease the final rating based on performance compared to state and national standards.
Calculator: See prices in your area
Chaffee Nursing Center accepts Medicare, Medicaid, and private pay.

Overview of Chaffee Nursing Center

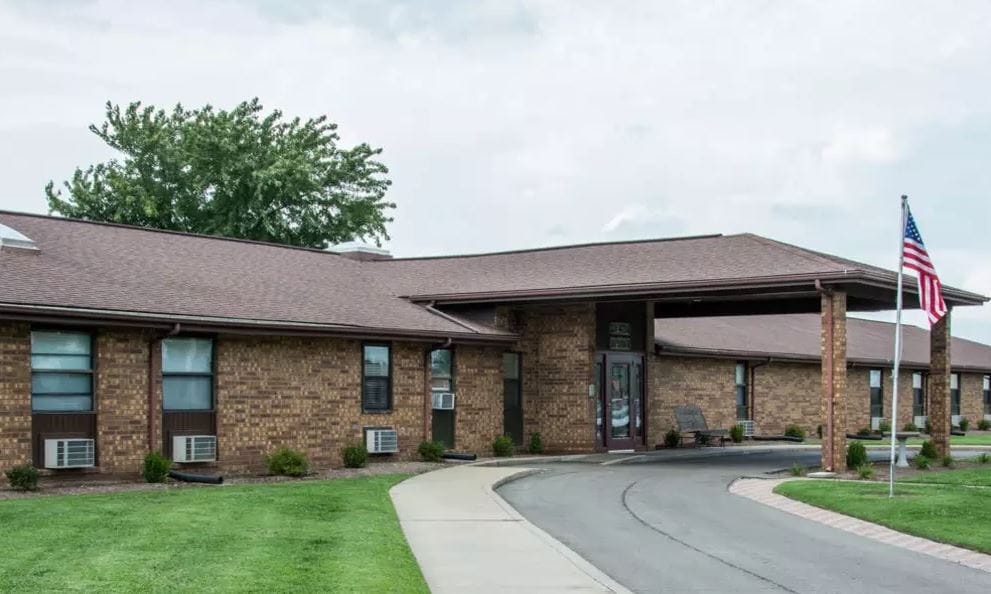
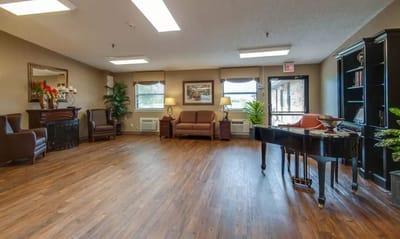
Located in the harmonious neighborhood of MO-77, Chaffee, MO, is the unique senior living community of Chaffee Nursing Center Skilled Nursing by Americare provides skilled nursing, hospice, home health care, and rehabilitation. Enjoy unmatched comfort and convenience with carefully built and sophisticated studio accommodations. The community takes pride in a team of kind and highly skilled professionals delivering top-tier care and assistance for seniors to flourish and live to their potential.

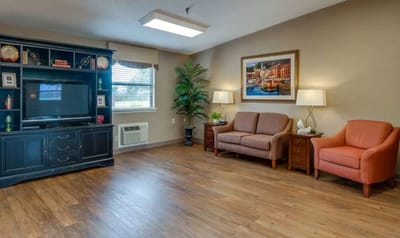
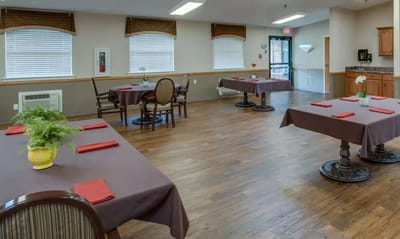
Explore new interests and relive old hobbies through fun activities and stimulating programs for a joyful and well-engaged retirement. Interact with the community over delightful and healthy meals for an unforgettable dining experience. Chaffee Nursing Center strives to provide a safe place for seniors who want to maximize their freedom while receiving support for their special needs.

(573) 887-3333

Quality ratings

Measured by Centers for Medicare & Medicaid Services (CMS)

Overall rating Info The Overall CMS Rating combines results from health inspections, staffing levels and quality measures. Health inspections carry the most weight. Staffing and quality scores can increase or decrease the final rating based on performance compared to state and national standards.
▲ 101.3% Above MO avg. ▲ 101.3% Above MO avg.Click the badge to see the full State ranking.Click here to see the full State ranking.
Health Inspection Info Based on the results of the facility's three most recent standard inspections and any complaint investigations. CMS reviews the number, scope, and severity of deficiencies, with more recent findings weighted more heavily.
▲ 80.2% Above MO avg. ▲ 80.2% Above MO avg.Click the badge to see the full State ranking.Click here to see the full State ranking.
Staffing Info Measures average nursing staff hours per resident per day, including Registered Nurses (RNs) and total nursing staff. Ratings are adjusted based on the level of care residents require and are compared to state and national benchmarks.
▲ 82.8% Above MO avg. ▲ 82.8% Above MO avg.Click the badge to see the full State ranking.Click here to see the full State ranking.
Quality Measures Info Based on clinical and physical health indicators reported to CMS, such as hospital readmissions, falls, pressure ulcers, and improvements in mobility. These measures reflect how well residents' health needs are being managed.
▼ 24.7% Below MO avg. ▼ 24.7% Below MO avg.Click the badge to see the full State ranking.Click here to see the full State ranking.

Staffing hours breakdown

Info Daily nursing hours per resident by staff type, reported to CMS. Higher is generally better — compare this facility to state and national averages to see where staffing stands.

Hours per resident per day — compared to Missouri state averages

Total nursing care / resident Info This home is ranked 100th out of 276 homes in Missouri. Total adjusted nursing hours per resident per day, combining RN, LPN, and aide time. CMS adjusts this for case-mix so facilities can be fairly compared.
3h 58m per day
Rank #100 / 276Nurse hours — State benchmarkedThis home is ranked 100th out of 276 homes in Missouri. Shows adjusted nurse hours per resident per day benchmarked to the Missouri average, with a ranking across 276 Missouri SNFs. More hours mean more direct care. The national average is about 3.5 hrs; below 3.0 is a red flag.Click the rank badge to see the full State ranking.Click here to see the full State ranking.
This facility Missouri avg (3h 44m per day)
vs Missouri avg
+6%

1 of 6 metrics below state avg

Standout metric Registered Nurse (RN) is +50% above state avg
Staff typeHours / Day / Residentvs state avg
Registered Nurse (RN) Info RNs hold the highest nursing license and can assess residents, interpret test results, and direct care plans. More RN hours per day often signals stronger clinical oversight and faster response to health changes. 42m per day ▲ 50% State avg: 28m per day · National avg: 41m per day
LPN / LVN Info Licensed Practical Nurses (LPNs) or Licensed Vocational Nurses (LVNs) deliver routine hands-on care — medication administration, wound dressing, and monitoring vital signs. They work under RN supervision and make up a large share of daily bedside care. 45m per day ▲ 10% State avg: 41m per day · National avg: 52m per day
Nurse Aide Info Certified Nurse Aides (CNAs) provide the most direct day-to-day assistance: bathing, dressing, feeding, and mobility. Nurse aide hours are typically the largest staffing category and directly affect residents' quality of life. 2h 17m per day ■ Avg State avg: 2h 20m per day · National avg: 2h 21m per day
Weekend Total Nursing Info Combined nursing hours (RN + LPN + Nurse Aide) per resident per day on weekends. Staffing often drops on weekends — this figure reveals whether the facility maintains adequate coverage outside of weekday hours. 3h 3m per day ■ Avg State avg: 3h 3m per day · National avg: 3h 26m per day
Physical Therapist Info Hours per resident per day provided by licensed Physical Therapists (PTs) or PT Assistants. PT services help residents recover mobility after injury or illness and are especially important for post-acute (short-stay) rehabilitation. 3m per day ▲ 50% State avg: 2m per day · National avg: 4m per day
Weekend RN Info Registered nurse hours specifically on weekends. Facilities sometimes reduce RN presence on Saturdays and Sundays — a low weekend RN figure compared to weekday hours can indicate reduced clinical oversight when most administrative staff are absent. 17m per day ▼ 15% State avg: 20m per day · National avg: 29m per day

Types of Care at Chaffee Nursing Center

Skilled Nursing Hospice Care

Capacity and availability

This home usually has availability

Occupancy lower than 85% suggests more openings may be available.

Higher occupancy than the Missouri average: 66.6%
Occupancy rate 80.9% Rank #97 / 283Occupancy rate — State benchmarkedThis home is ranked 97th out of 283 homes in Missouri. Shows this facility's occupancy rate versus the Missouri average, with its Statewide rank out of 283. Higher occupancy signals strong local demand and financial stability.Click the rank badge to see the full State ranking.Click here to see the full State ranking.
Avg. Length of Stay 151 days
Occupancy rate
80.9% Rank #97 / 283Occupancy rate — State benchmarkedThis home is ranked 97th out of 283 homes in Missouri. Shows this facility's occupancy rate versus the Missouri average, with its Statewide rank out of 283. Higher occupancy signals strong local demand and financial stability.Click the rank badge to see the full State ranking.Click here to see the full State ranking.
Avg. Length of Stay
151 days
Walk Score
Walk Score: 25 / 100 Rank #425 / 562Walk Score — State benchmarkedThis home is ranked 425th out of 562 homes in Missouri. Shows how walkable this facility's neighborhood is compared to the average Walk Score across Missouri SNFs. Higher scores benefit residents, families, and staff.Click the rank badge to see the full State ranking.Click here to see the full State ranking.
Somewhat walkable. A few nearby services may be reachable on foot, but most trips require transportation.

Contact Chaffee Nursing Center

Staffing Data

Reporting period: October 1 – December 31, 2025 (Q4 2025). Source: CMS Payroll-Based Journal report.

Total staff 93
Employees 76
Contractors 17
Staff to resident ratio 1.58:1
7% worse than Missouri average
Missouri average ratio: 1.69:1 Missouri average ratio: 1.69:1See full Missouri ranking
Avg staff/day 34
Average shift 7.9 hours
0% compared with Missouri average
Missouri average: 8.1 hours Missouri average shift: 8.1 hoursSee full Missouri ranking
Total staff hours (quarter) 24,861

Nursing staff breakdown

Q4 2025 · Oct 1 – Dec 31 More info This data comes from the CMS Payroll-Based Journal report covering October 1 – December 31, 2025.
Registered Nurse

Manages medical care and health needs.

RN Staff 7
Average shift length Info Average shift length. Calculated as total hours divided by days worked and average staff per day. 10.3 hours

No contractors work on this role.

Licensed Practical Nurse

Assists with medical care and medications.

LPN Staff 13
Average shift length Info Average shift length. Calculated as total hours divided by days worked and average staff per day. 8.5 hours

No contractors work on this role.

Certified Nursing Assistant

Helps with daily care and mobility.

CNA Staff 32
Average shift length Info Average shift length. Calculated as total hours divided by days worked and average staff per day. 8.2 hours

No contractors work on this role.

Contractor staffing

Q4 2025 · Oct 1 – Dec 31 More info This data comes from the CMS Payroll-Based Journal report covering October 1 – December 31, 2025.

Total hours from contractors

7.8%

1,940 contractor hours this quarter

Speech Language Pathologist: 6 Qualified Social Worker: 2 Respiratory Therapy Technician: 2 Physical Therapy Aide: 2 Physical Therapy Assistant: 1 Medical Director: 1 Therapeutic Recreation Specialist: 1 Occupational Therapy Assistant: 1 Occupational Therapy Aide: 1

Staff by category

Q4 2025 · Oct 1 – Dec 31 More info This data comes from the CMS Payroll-Based Journal report covering October 1 – December 31, 2025.
Certified Nursing Assistant3203210,06192100%8.2
Licensed Practical Nurse130133,82392100%8.5
Nurse Aide in Training100102,2149098%9.8
Registered Nurse7072,10192100%10.3
Clinical Nurse Specialist3031,3107885%7
Physical Therapist4041,0489098%5.6
Dental Services Staff1015206166%8.5
RN Director of Nursing1014846267%7.8
Nurse Practitioner1014696065%7.8
Speech Language Pathologist0664536470%5.8
Administrator1014475661%8
Dietitian1014406368%7
Physical Therapy Aide0223496470%5.4
Respiratory Therapy Technician0222926166%4.8
Physical Therapy Assistant0112695863%4.6
Therapeutic Recreation Specialist0112414246%5.7
Qualified Social Worker0222246267%3.6
Medical Director011641415%4.6
Occupational Therapy Aide0112833%9.4
Occupational Therapy Assistant0112233%7.2
Other Dietary Services Staff202522%2.5
32 Certified Nursing Assistant
% of Days 100%
13 Licensed Practical Nurse
% of Days 100%
10 Nurse Aide in Training
% of Days 98%
7 Registered Nurse
% of Days 100%
3 Clinical Nurse Specialist
% of Days 85%
4 Physical Therapist
% of Days 98%
1 Dental Services Staff
% of Days 66%
1 RN Director of Nursing
% of Days 67%
1 Nurse Practitioner
% of Days 65%
6 Speech Language Pathologist
% of Days 70%
1 Administrator
% of Days 61%
1 Dietitian
% of Days 68%
2 Physical Therapy Aide
% of Days 70%
2 Respiratory Therapy Technician
% of Days 66%
1 Physical Therapy Assistant
% of Days 63%
1 Therapeutic Recreation Specialist
% of Days 46%
2 Qualified Social Worker
% of Days 67%
1 Medical Director
% of Days 15%
1 Occupational Therapy Aide
% of Days 3%
1 Occupational Therapy Assistant
% of Days 3%
2 Other Dietary Services Staff
% of Days 2%

Penalties and fines

Federal penalties imposed by CMS for regulatory violations, including civil money penalties (fines) and denials of payment for new Medicare/Medicaid admissions.

Source: CMS Penalties Database

No penalties in the past 3 years

No civil money penalties or payment denials were reported in the last 3 years.

Quality of care over time

These measures show how residents usually do over time at this home, based on health outcomes and preventive care.

High-risk clinical events score Info A composite score based on pressure ulcers, falls with injury, weight loss, walking ability decline, and activities of daily living decline. 5.8
47% better than Missouri average

Missouri average: 10.9

Functional decline score Info A composite score based on activities of daily living decline, walking ability decline, and incontinence. 10.6
46% better than Missouri average

Missouri average: 19.5

Long-stay resident measures
Average Missouri avg: 2.7 Info CMS star rating based on long-stay quality measure performance. 5 stars = significantly above average, 1 star = significantly below average.
Need for Help with Daily Activities Increased Info Percent of long-stay residents whose need for help with daily activities has increased 7.5%
62% better than Missouri average

Missouri average: 19.8%

Walking Ability Worsened Info Percent of long-stay residents whose ability to move independently worsened 8.9%
57% better than Missouri average

Missouri average: 20.6%

Low Risk Residents with Bowel/Bladder Incontinence Info Percent of low risk long-stay residents who lose control of their bowels or bladder 15.4%
15% better than Missouri average

Missouri average: 18.1%

Falls with Major Injury Info Percent of long-stay residents experiencing one or more falls with major injury 5.6%
38% worse than Missouri average

Missouri average: 4.0%

High Risk Residents with Pressure Ulcers Info Percent of long-stay high risk residents with pressure ulcers 0.4%
92% better than Missouri average

Missouri average: 5.0%

Urinary Tract Infection Info Percent of long-stay residents with a urinary tract infection 8.7%
218% worse than Missouri average

Missouri average: 2.7%

Lost Too Much Weight Info Percent of long-stay residents who lose too much weight 6.6%
18% worse than Missouri average

Missouri average: 5.6%

Depressive Symptoms Info Percent of long-stay residents who have depressive symptoms 0.0%
100% better than Missouri average

Missouri average: 12.8%

Antipsychotic Use Info Percent of long-stay residents who received an antipsychotic medication 19.8%
10% better than Missouri average

Missouri average: 22.0%

Pneumococcal Vaccine Info Percent of long-stay residents assessed and appropriately given the pneumococcal vaccine 100.0%
17% better than Missouri average

Missouri average: 85.2%

Influenza Vaccine Info Percent of long-stay residents assessed and appropriately given the seasonal influenza vaccine 100.0%
10% better than Missouri average

Missouri average: 90.9%

Hospitalizations per 1,000 days Info Number of hospitalizations per 1,000 long-stay resident days. 1.77
15% better than Missouri average

Missouri average: 2.08

ED visits per 1,000 days Info Number of outpatient emergency department visits per 1,000 long-stay resident days. 2.75
17% worse than Missouri average

Missouri average: 2.35

Short-stay resident measures
Below average Missouri avg: 2.1 Info CMS star rating based on short-stay quality measure performance. 5 stars = much above average, 1 star = much below average.
Pneumococcal Vaccine Info Percent of short-stay residents assessed and appropriately given the pneumococcal vaccine 98.9%
48% better than Missouri average

Missouri average: 66.6%

Antipsychotic medication increase Info Percent of short-stay residents who newly received an antipsychotic medication 2.4%
7% worse than Missouri average

Missouri average: 2.2%

Influenza Vaccine Info Percent of short-stay residents assessed and appropriately given the seasonal influenza vaccine 96.3%
52% better than Missouri average

Missouri average: 63.5%

Re-hospitalized after SNF stay Info Percentage of short-stay residents who were re-hospitalized after their nursing home admission. 23.5%
7% better than Missouri average

Missouri average: 25.3%

Emergency department visits Info Percentage of short-stay residents who had an outpatient emergency department visit. 19.2%
43% worse than Missouri average

Missouri average: 13.4%

Falls with major injury Info Percentage of SNF residents who experience falls with major injury during their stay. 4.3%
453% worse than Missouri average

Missouri average: 0.8%

Ability to care for self at discharge Info Percentage of residents at or above expected ability to care for themselves at discharge. 41.9%
22% worse than Missouri average

Missouri average: 53.7%

Successful return to home or community Info Rate of successful return to home or community from a skilled nursing facility. 63.5%
26% better than Missouri average

Missouri average: 50.6%

Breakdown by payment type

Medicare

38% of new residents, usually for short-term rehab.

Typical stay 1 - 2 months

Private pay

42% of new residents, often for short stays.

Typical stay 3 - 4 months

Medicaid

20% of new residents, often for long-term daily care.

Typical stay 1 - 2 years

Facility Characteristics

Source: CMS Long-Term Care Facility Characteristics (Data as of Jan 2026)

Total residents 59
Medicare
11
18.6% of residents
Medicaid
35
59.3% of residents
Private pay or other
13
22% of residents
Programs & Services
Residents Group

Residents meet regularly to discuss policies, care quality, and activities

Nurse Aide Training

State-approved Nurse Aide Training and Competency Evaluation Program on-site

Active Resident Council

Organized group of residents that meets regularly to discuss facility policies, quality of life, and activities.

Finances and operations

Privately-owned community
Operated by a business corporation.
Home revenue
$5.6M
Profit
$480.9K
Privately-owned community Operated by a business corporation.
Home revenue
$5.6M Rank #172 / 286Revenue — State benchmarkedThis home is ranked 172nd out of 286 homes in Missouri. Shows this facility's annual revenue compared to the Missouri SNF average. Higher revenue generally means more resources for staffing and capital — read alongside Payroll %.Click the rank badge to see the full State ranking.Click here to see the full State ranking.
Profit
$480.9K
Payroll costs Info The portion of the home's budget spent on staff, including nurses, caregivers, and other employees who support care and operations. Rank #178 / 286Payroll — State benchmarkedThis home is ranked 178th out of 286 homes in Missouri. Shows total annual staff payroll benchmarked to the Missouri average. Higher payroll investment relative to peers often signals better staffing and less reliance on cheaper contract labor.Click the rank badge to see the full State ranking.Click here to see the full State ranking.
$3.0M
53.1% of revenue Rank #157 / 286Payroll % — State benchmarkedThis home is ranked 157th out of 286 homes in Missouri. Shows payroll as a percentage of revenue versus the Missouri average. Well-run Missouri SNFs typically land around 60–71% — the top third Statewide. Below 25% may signal understaffing or heavy agency use — read with Staffing ratings.Click the rank badge to see the full State ranking.Click here to see the full State ranking.
Other operating costs Info All remaining costs needed to run the home, such as food, utilities, building maintenance, supplies and administrative expenses.
$2.2M
Total costs $5.2M

What does this home offer?

Room sizes icon
Room sizes icon

Room Sizes: 216 / 220 sq. ft.

Housing options icon

Housing Options: Studio

Building type icon
Building type icon

Building Type: Single-story

Transportation services icon

Transportation Services

Fitness and recreation icon

Fitness and Recreation

Who this home usually serves

TYPE OF STAY

Mix of rehab and long-term care

This home supports both short-term rehab and long-term care, with residents staying for a wide range of durations.

Places of interest near Chaffee Nursing Center

Address 14.5 miles from city center Info Estimated distance in miles from Chaffee's city center to Chaffee Nursing Center's address, calculated via Google Maps.

Calculate Travel Distance to Chaffee Nursing Center

Add your location

Address

Financial Assistance for
Nursing Home in Missouri

Chaffee Nursing Center is located in Chaffee, Missouri.
Here are the financial assistance programs available to residents in Missouri.

Get Financial aid guidance

Aged and Disabled Waiver

Missouri Medicaid A&D Waiver

Age 65+ or disabled
General Missouri resident, Medicaid- eligible, nursing home-level care need.
Income Limits (2025) ~$2,829/month 300% FBR, individual
Asset Limits $2,000 (individual), $3,000 (couple).
MO

Rural access prioritized.

Benefits
Personal care (5-7 hours/day) Respite (240 hours/year) Adult day care (~$65/day) Home health services

Missouri Supplemental Nursing Care (SNC)

MO SNC

Age 65+
General Missouri resident, in approved facility.
Income Limits ~$1,215/month individual
Asset Limits $2,000 individual
MO

Supplements SSI; facility-based only.

Benefits
Monthly cash payment (~$156-$292/month) for care costs

Structured Family Caregiving Waiver (SFCW)

Missouri Structured Family Caregiving Waiver

Age 65+
General Missouri resident, MO HealthNet-eligible, NFLOC, dementia diagnosis, live with caregiver.
Income Limits (2025) ~$2,901/month (300% FBR, individual); QIT required.
Asset Limits $5,909.25 (individual), $11,818.45 (couple).
MO

Caregiver must be family; small program size.

Benefits
Cash stipend ($1,000-$1,500/month) to family caregiver Respite Training Supplies ($500/year)

MO HealthNet Aged, Blind, and Disabled (ABD)

Missouri MO HealthNet ABD

Age 65+ or disabled
General Missouri resident, MO HealthNet-eligible, needs help with 1+ ADL.
Income Limits (2025) ~$1,690/month (individual, projected); spenddown allowed.
Asset Limits $5,909.25 (individual), $11,818.45 (couple).
MO

Less intensive than waivers; statewide access.

Benefits
Personal care (2-4 hours/day) Homemaker services Limited respite Medical equipment

Medicare Savings Program (MSP)

Missouri Medicare Savings Program

Age 65+ or disabled
General Missouri resident, Medicare Part A/B.
Income Limits (2025) ~$2,510/month (QMB), ~$3,380/month (SLMB), ~$3,598/month (QI)—individual.
Asset Limits $9,430 (individual), $14,130 (couple).
MO

Three tiers; no waitlist; includes Extra Help for Part D.

Benefits
Covers Part B premiums ($174.70/month) Deductibles ($240/year) Copays (~20%)

Missouri Caregiver Program (Customized Caregiver Training & Relief)

Missouri Caregiver Program

Age
General Caregivers of 60+ with dementia, Missouri resident, functional needs (2+ ADLs).
Income Limits (2025) No strict cap; prioritizes low-income ~$24,980/year individual
Asset Limits Not assessed; need-based.
MO

Administered via AAAs and Alzheimer’s Association; rural focus.

Benefits
Respite (4-6 hours/week) Training Assistive tech ($500/year) Supplies

VA Aid and Attendance (A&A) and Housebound Benefits

Missouri VA Aid and Attendance/Housebound

Age 65+ or disabled veteran/spouse
General Missouri resident, wartime service, need for ADL help (A&A) or homebound.
Income Limits (2025) Net income < ~$1,984/month (veteran with dependent, A&A); pension offsets income.
Asset Limits ~$155,356 net worth limit
MO

High veteran demand in rural/urban areas.

Benefits
Cash (~$1,433-$2,642/month veteran, ~$951-$1,318 spouse) for care costs (e.g., in-home, assisted living)

Frequently Asked Questions about Chaffee Nursing Center

What neighborhood is Chaffee Nursing Center in?

Chaffee Nursing Center is in the Chaffee neighborhood.

Is Chaffee Nursing Center in a walkable area?

Chaffee Nursing Center has a walk score of 25. Somewhat walkable. A few nearby services may be reachable on foot, but most trips require transportation.

What is the occupancy rate at Chaffee Nursing Center?

Chaffee Nursing Center's occupancy is 80.9%.

What is the phone number of Chaffee Nursing Center?

(573) 887-3333 will put you in contact with the team at Chaffee Nursing Center.

Is Chaffee Nursing Center Medicare or Medicaid certified?

Yes — Chaffee Nursing Center is a CMS-certified provider of Medicare and Medicaid.

Guides for Better Senior Living

Care Cost Calculator: See Prices in Your Area

Nursing Home Data Explorer

Don’t Wait Too Long: 7 Red Flag Signs Your Parent Needs Assisted Living Now

The True Cost of Assisted Living in 2025 – And How Families Are Paying For It

Understanding Senior Living Costs: Pricing Models, Discounts & Financial Assistance

Explore Open Rooms
1 Contact details
2 What type of senior care service are you looking for?
3 What budget do you have in mind for senior care?
4 How soon do you need to find care?
5 Additional details

Thank you for your interest!

Our team will be in touch shortly to help with next steps.